Methanex: The Global Methanol Leader - Investor Presentation | July 2020 - Methanex Corporation
←
→
Page content transcription
If your browser does not render page correctly, please read the page content below
Methanex: The Global
Methanol Leader
Investor Presentation | July 2020
Forward-looking statements & non-GAAP measures

    Information contained in these materials or presented orally on the earnings conference call, either
    in prepared remarks or in response to questions, contains forward-looking statements. Actual results
    could differ materially from those contemplated by the forward-looking statements. For more
    information, we direct you to our 2019 Annual MD&A and our second quarter 2020 MD&A, as well
    as slide 34 of this presentation.

    This presentation also contains certain non-GAAP financial measures that do not have any
    standardized meaning and therefore are unlikely to be comparable to similar measures presented by
    other companies. For more information regarding these non-GAAP measures, please see our 2019
    Annual MD&A and our second quarter 2020 MD&A.
    All amounts are shown in US dollars except where otherwise stated.

2
Global industry leader well-positioned to capitalize on market recovery
          1. Global methanol leader
            Global industry leader with leading market share, global production footprint and integrated
            global supply chain that enables us to be the supplier of choice to customers around the world.

          2. Long-term industry outlook remains positive
            Essential ingredient used in a variety of chemical derivatives and serves as a building block to
            produce a multitude of everyday consumer and industrial items. Also used in an increasing
            number of energy-related applications and as a clean-burning and economic alternative fuel.

          3. Strong cash flow generation and shareholder returns
            Assets well positioned on industry cost curve to be competitive through the methanol price
            cycle. Significant cash flow potential driven by leverage to methanol prices. Returned $1.9
            billion to shareholders since January 1, 2013.

          4. Growth potential
            Unique growth opportunities in Louisiana allowing Methanex to increase production capacity
            at advantaged capital costs when conditions improve.
3
In an industry where scale and flexibility drive value…
    Methanex is the world’s largest producer and supplier of methanol

                                                                                             Integrated global capabilities enable a
                                       C   t db t l   h

                                  6 manufacturing
        Over 9 million
                                sites with 11 plants                     Integrated global   clear competitive advantage of secure
                                     strategically                       supply chain and
          tonnes of
                                    positioned to                           distribution                        and reliable supply
      operating capacity
                                supply every major                            network
                                   global market

                                                           Local customer
                    Waterfront
                                                           service in every
                Shipping subsidiary                        major market to
                 enables seamless                         quickly adapt and
                  transportation                             respond to
                     network                              customers’ needs

4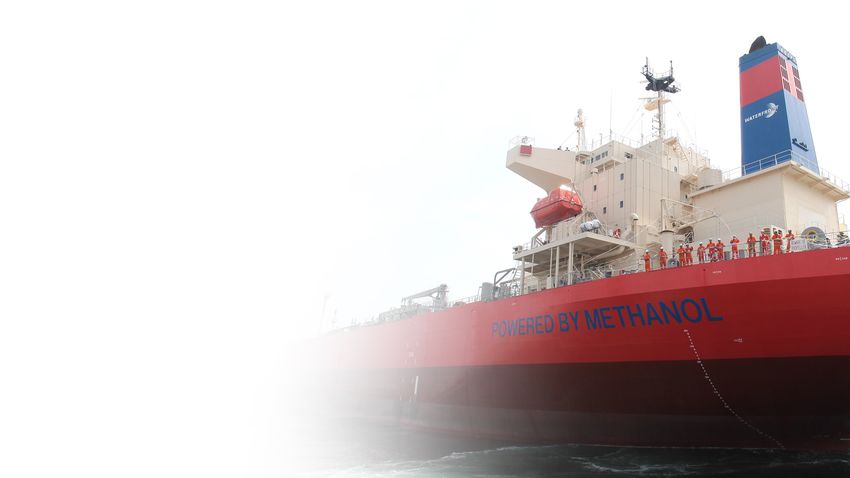
Growing production with a clear focus on shareholders
    Production                                             Shares outstanding                                       Production per thousand shares
    (M tonnes)                                             (M)                                                      (M tonnes)

                            85%                                                         19%                                       133%

                                                                                                                                                          100
                                                     7.6

                                                                   96.1

                                                                                                                                                     93
                                                            94.3

                                                                          92.3

                                                                                                                                                86
                                               7.2
                                        7.2

                                                                                        89.8
                                                                                 89.7
                                 7.0

                                                                                                                                           78
                                                                                               83.8
                          5.2

                                                                                                      77.3
                   4.9

                                                                                                             76.2
            4.3

                                                                                                                                      58
     4.1

                                                                                                                                 53
                                                                                                                           45
                                                                                                                     43
     2012 2013 2014 2015 2016 2017 2018 2019                2012 2013 2014 2015 2016 2017 2018 2019                  2012 2013 2014 2015 2016 2017 2018 2019

       Balanced approach to capital allocation1:
       • Invested approximately $2.6 billion in capital expenditures and grew from 7 to 11 plants in operation
       • Returned approximately $1.9 billion of capital to shareholders through dividends and share buybacks
        1   From January 1, 2013 to June 30, 2020
5
Resilient business model and strong liquidity position
                                                                                                    Strong liquidity position
    Recent actions to protect business and preserve cash
    ($M)                                                                                            • Nearly ~$800 million of cash on hand at end of Q2 2020

         Defer growth capital                Reduced regular                     Reduce 2020        • Recently negotiated meaningful financial covenant relief
            (Geismar 3)1                    quarterly dividend2               maintenance capital   • No near-term debt maturities
                $500M                                   $100M                           $30M        • Focused on cash preservation and continue to evaluate all
                                                                                                      options to ensure we maintain financial capacity and
            $700
                                                                                                      flexibility

                                      35                                                            Continue to deliver secure and reliable supply
                             Up to
                                     Acres                                                          to our customers around the world
                             $200       35                                                          • Integrated global capabilities with network of production
                                                                               $150       $120
                                       Acres$110                                                      sites and extensive global supply chain and distribution
                                                               $11                                    network
           Original         Revised          Original       Revised          Original    Revised    • Well-positioned to generate long-term value over the
                                                                                                      commodity cycle
     1   Reflects original and revised forecasted spending from 4/1/2020 to 9/30/2021

     2   Reflects $100 million in annual cash savings

6
Long-term industry
    outlook remains positive

7
Methanol is an essential ingredient in modern life
         TRADITIONAL CHEMICAL APPLICATIONS                                ENERGY-RELATED APPLICATIONS
    Essential ingredient used in countless industrial and            Represents a growing demand segment for
    consumer products (over 50% of global methanol demand)           methanol (close to 50% of global methanol demand)
     End uses                                                   End uses
     •   Essential ingredient used in a      Adhesives          •   Used in an increasing number of
         variety of chemical derivatives                            energy-related applications and         Methanol-to-
         and serves as a building block to   Insulation             as a clean-burning and economic         olefins (MTO)
         produce a multitude of everyday                            alternative fuel                        Methyl tertiary-
         consumer and industrial items       Lumber                                                         butyl ether (MTBE)
                                                                Demand drivers
     •   Limited, if any, cost-effective                                                                    Fuel
         substitutes for methanol-based      Paint              •   Influenced by energy prices,            applications
         chemical derivative products                               price of end products and
                                             Solvents               government regulations/policies
     Demand drivers                                                 that support clean-burning fuels

     •   Linked to GDP and industrial        Synthetic fibers
         production levels, particularly
         automotive and construction
         markets

8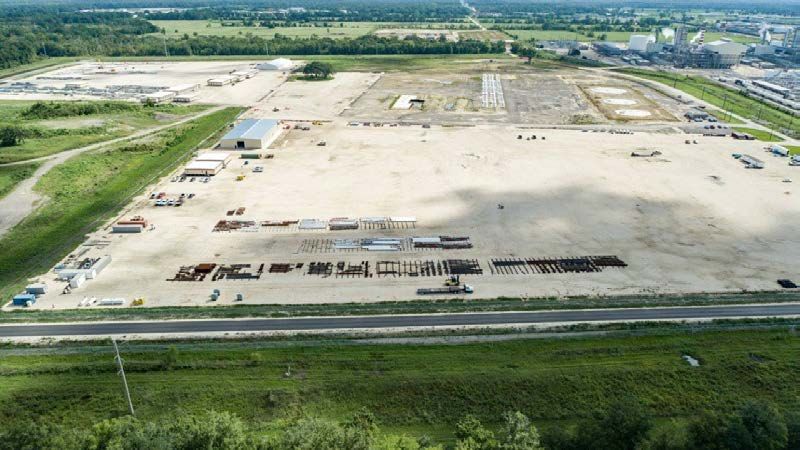
Methanol can be used to produce olefins, which are then used to produce
    a variety of everyday products
                                                                            Methanol-to-olefin (MTO) plants produce a
                                                            Methanol          wide variety of downstream products

                              Ethylene                                                        Propylene

     Polyethylene       EDC              EO     Ethyl benzene     Polypropylene         ACN                PO              Cumene

                        PVC              MEG      Styrene                         Synthetic rubbers Polyether polyols       Phenol

                                                                                                                        Polycarbonates/
                                         PET     Polystyrene                                          Polyurethane       Phenolic resins

     Packaging      Construction     Textiles    Containers      Consumer goods     Household &        Insulation,        Computers
9                                                                                 consumer goods        bedding
Methanol is a clean-burning alternative fuel

                           Marine fuel                                  Vehicle                                     Lower
                           that meets                                   fuel that                                   emission
                           environmental                                reduces                                     fuel source
                           regulations                                  emissions
     • Regulations (IMO 2020) require          • Methanol is an affordable gasoline     • Methanol is used as an alternative to
       cleaner-burning fuels                     substitute in China                      coal for industrial boilers and kilns to
                                                                                          reduce emissions
     • Methanol is a clean-burning fuel that   • Reduces emissions when blended with
       meets regulations and is cost             or substituted for gasoline            • Currently represents approximately
       competitive over the cycle                                                         two million tons of demand
                                               • Several other countries are at the
     • Approximately 40% of Waterfront           assessment or near-commercial stage
       Shipping’s (Methanex’s wholly owned       for low-level methanol fuel blending
       subsidiary) fleet is able to run on
       methanol, and other low-sulphur
       fuels which provides flexibility

                     Represents significant upside potential for long-term demand
10
Long-term industry supply/demand fundamentals remain strong
NEAR-TERM OUTLOOK LONG-TERM OUTLOOK REMAINS INTACT
• Uncertain near-term demand outlook due to impact of • Over the long-term, we believe that new industry
COVID-19 on manufacturing activity and low oil prices capacity additions will be needed to meet demand
growth
• Current methanol prices at cyclical lows and estimated
to be marginally below cash costs of the industry • Continued long-term demand growth for methanol as an
marginal producer essential ingredient used in countless everyday products,
an increasing number of energy-related applications and
• Expect rationalization of high-cost industry supply in a
as a clean-burning and economic alternative fuel
sustained low-price environment to the benefit of low-
cost producers • Limited industry capacity additions expected post 2022
based on significant capital cost and uncertain near-term
• Near-term large-scale capacity additions (Trinidad,
outlook
United States, Iran, China)1 face uncertain timing given
state of global economy and low methanol price
environment
1 Trinidad (Caribbean Gas Chemical Ltd. – 1.0M tonnes), United States (Koch
Methanol/Yuhuang – 1.7M tonnes), Iran (Bushehr – 1.7M tonnes, Kimiya Pars – 1.7M
tonnes) and China (6.0M tonnes net of expected supply rationalizations).
Source: IHS Chemical Global Methanol Supplemental Issue (June 2020)
11Global, pure-play
methanol leader
12Industry leadership is core to our strategy and superior performance
Scale and flexibility enables Methanex to be the
Estimated industry market share supplier of choice to customers around the world
• Strong customers that are leaders in their industry
15%
• Ability to optimize global sourcing plans while maintaining
security of supply for customers
10%
Methanex is the • Improved industry structure: new market development,
market leader product stewardship and advocacy
We continually enhance this key value driver by
5% growing our production as the market grows
• ~13% global market share – double that of our next
competitor
0%
• Unique global position as the only supplier with well-
established production and sales in all major regions
13 Source: MethanexClear competitive advantage from integrated global capabilities
Investing in industry-leading, secure,
reliable supply from a global network
of plants is a fundamental driver of
long-term results
• Network of production sites to supply
every major global market
• Fleet of dedicated ocean vessels
• Extensive integrated global supply chain
and distribution network
• “Local” customer service
14Methanol customers value secure and reliable supply
• 30% of global industry demand from top 20 consumers
– Reflects a broad and diversified consumer base of global
chemical companies and end users
• Methanex supplies primarily traditional chemical
derivative customers who value:
– Security of supply
– Global presence
– Quality product
– Commitment to Responsible Care®
Responsible Care is a UN recognized sustainability initiative
adopted by the global chemical industry
15Methanex is well positioned on the global industry cost curve
• Methanex plants are competitive across a wide
Illustrative methanol industry cost curve range of methanol prices – we estimate that our
($/tonne)
assets are positioned on the low-to-mid portion
of the industry cost curve
• Flat portion of cost curve provides price support
in a low energy price environment
• Industry has high cost operators and responds to
Global periods of excess supply or demand
methanol
demand • Steep high end of cost curve reflects high cost
coal and natural gas-based production in China
• Other higher cost regions are Russia, Europe,
45 55 65 75 85
India
Global production (million tonnes)
16Methanex annual production capacity
Production capacity
(000s tonnes)
Current Future # of plants
Plant potential 1 potential 2 (2020) Gas supply Supply chain
New Zealand 1,900 2,200 3 Multiple medium-to long-term physical contracts Asia Pacific
North America and other major
Geismar 2,000 4,000 2 Physical contract, financial hedges and spot market
markets around the globe
Asia and other major markets
Trinidad (Mx share) 1,700 2,000 2 Physical contract
around the globe
South America and other major
Chile 1,300 1,720 2 Multiple short-to-medium term contracts
markets around the globe
Egypt (Mx share) 630 630 1 Long-term contract Egypt and Europe
Medicine Hat 600 600 1 Physical contract, physical hedges Western Canada and US
Total 8,130 11,150 11
In late 1Q 2020, we idled our Titan plant in Trinidad and Chile IV plant to respond to lower methanol demand due to the COVID-19 pandemic and lower oil prices.
1 Current potential = reflects New Zealand operating rate of 85% (1.9 million tonnes), Trinidad operating rate of 85% (1.7 million tonnes) and Chile operating rate of 75%
(1.3 million tonnes). We cannot predict actual gas restrictions at these plants.
2 Includes annual operating capacity for existing plants plus future incremental capacity from Geismar debottleneck project (0.2 million tonnes) and Geismar 3 project (1.8
17 million tonnes).Geismar 3 project has significant capital and operating cost advantages
Project overview
• Size: 1.8 million tonnes per year
• Location: Geismar, Louisiana; adjacent to existing G1 and G2 facilities
• Status: on temporary care and maintenance
• Continue to explore partnership arrangements
Three distinct advantages vs. US Gulf greenfield projects
• Achieves significant capital cost savings by using excess hydrogen
from G1 and G2 to eliminate need for a primary reformer
• Brownfield site: shared piperack capacity, control rooms, storage
tanks, etc.
July 2020: Geismar 3 site
• Well-situated industrial park: nearby oxygen supply, utilities, marine
terminal
18Geismar 3 project is significantly de-risked
Rigorous well-defined execution plan
• Well-defined scope and budget
• Early work to establish firm pricing for key equipment,
materials and services
• Healthy contingency for residual risk
• Progress has been safe, on time and on budget
Various factors to consider for project restart
• Global economic recovery
• Methanol market conditions
• Ability to effectively finance the project
• Ability for suppliers to execute construction and to July 2020: Geismar 3 site
deliver material and equipment
19Strong cash flow
generation with
significant leverage to
methanol prices
20Average Modified ROCE of 12% over last 10 years
Adjusted EPS and Modified ROCE
Adjusted EPS1
$8.00 24%
Modified ROCE2
$7.00 21%
$6.00 18%
$5.00 15%
$4.00 12%
$3.00 9%
$2.00 6%
$1.00 3%
$0.00 0%
2010 2011 2012 2013 2014 2015 2016 2017 2018 2019
1 Adjusted EPS = Adjusted net income per common share attributable to Methanex shareholders (excludes the after-tax mark-to-market impact of share-based
compensation and the impact of certain items associated with specific identified events)
2 Modified ROCE = Adjusted net income before finance costs (after-tax) divided by average productive capital employed. Average productive capital employed is the sum of
average total assets (excluding plants under construction) less the average of current non-interest-bearing liabilities.
3 Adjusted net income and Adjusted net income per common share are non-GAAP measures - for more information regarding non-GAAP measures, please see our 2019
Annual MD&A
21Long-term valuation considerations
• Flexible cost structure as the
Annual operating capacity1 price for approximately 60% of
Current potential (8.1 million tonnes)2 Future potential (11.2 million tonnes)3 our natural gas supply (our most
Average significant operating cost) is
Realized Adjusted Free Free Adjusted Free Free
EBITDA cash flow cash flow EBITDA cash flow cash flow linked to methanol pricing –
Price
capability 4 capability 5 yield6 capability 4 capability 5 yield 6 therefore, our operating costs
move down as methanol prices
$275 600 175 11% 775 325 21%
decline
$300 750 300 20% 1,100 575 38%
• Cost structure per tonne
$350 1,050 525 34% 1,500 900 59% continues to benefit from
$400 1,375 800 52% 1,950 1,250 82% significant leverage on our fixed
costs as production increases
Significant leverage to methanol prices - long-term average price ~$350/MT
• Significant cash flow potential
driven by leverage to methanol
prices
1 Methanex interest (63.1% Atlas, 50% Egypt)
2 Refer to slide 17 (footnote 1)
3 Refer to slide 17 (footnote 2)
4 Adjusted EBITDA reflects Methanex's proportionate ownership interest and assumes plants operate at full production rates except
where indicated.
5 After lease payments, cash interest, debt service, maintenance capital (approx. $120 million), cash taxes and other cash payments.
6 Based on 76 million shares outstanding as of 6/30/2020 and share price of US$20/share.
22Long-term valuation considerations (continued)
Sensitivities versus run-rate of:
Estimated sensitivities
($ millions) • Average realized price: $350/tonne
• Volume: 8.1 million tonnes
EBITDA +/- $10/tonne ARP
• Adjusted EBITDA capability: $1.1 billion
• Free cash flow capability: $525 million
FCF +/- $10/tonne ARP
EBITDA +/- 100,000 tonnes volume
FCF +/- 100,000 tonnes volume
-80 -60 -40 -20 0 20 40 60 80
Estimate $10/MT increase in methanol price results in ~$60 million increase in Adjusted EBITDA
23Methanex historical realized pricing
• Methanex posts reference
Average realized price per tonne
prices:
~ US$395 (real)
~ US$350 (nominal)
– Monthly in North America
$550 and Asia
– Quarterly in Europe
$450 • Realized pricing is lower than
posted reference pricing due
to customer discounts and
$350
other factors
$250 Collapse in
oil prices COVID-19 and
Financial crisis collapse in oil
prices
$150
2008 2009 2010 2011 2012 2013 2014 2015 2016 2017 2018 2019 2020
Source: Methanex. Assumes 2% inflation.
24Various short-term factors can affect earnings
These factors are less meaningful in the long-
Illustrative impact on earnings
($/tonne) term
Margins at a given • Difference between posted and realized prices can vary:
price are generally
higher in a rising – Rising prices can reduce/narrow our discount rate
price environment
– Declining prices can increase/widen our discount rate
Margins are • FIFO inventory accounting can impact cost of sales:
generally lower in
a declining price – Cost of sales can decrease in a rising price environment
environment
– Cost of sales can increase in a falling price environment
• Shipment timing can result in a short-term inventory
build or draw position
• Planned/unplanned outages can temporarily increase
logistics costs as we move product globally to serve our
customers
Stable price Rising price Declining price
environnent environment environment
25Balanced approach to
capital allocation
26Balanced approach to capital allocation
1 2 3
ESSENTIAL PROFITABLE GROWTH SHAREHOLDER RETURNS
Share
Debt service Maintenance Low-cost growth opportunities Dividends
buybacks
• ~$130 million annual interest • Disciplined capital investment • Since January 1, 2013,
expense decisions based on strict returned approximately $1.9
project return criteria billion of capital to
• $35 million debt payments
shareholders through
(MX share) • Focus on unique
dividends and share
opportunities in Louisiana
• Next maturity - $250 million, buybacks
March 2022 – Geismar 1 & 2 debottleneck
project
• ~$120 million maintenance
– Geismar 3 project when
capex (2020)
market conditions improve
Near-term focus on protecting the balance sheet and preserving liquidity
27Balanced approach to capital allocation
Since January 1, 2013
Capital investments and capital returned to shareholders
($ millions) • Invested over $2.6 billion
in capital expenditures
and grew from 7 to 11
G1 & G2 builds plants in operation, with
production increasing
from 4.1 to 7.6 million
tonnes
• Returned approximately
658
$1.9 billion of capital to
579 550 shareholders through
479
388 dividends and share
343
244 244 262 buybacks
75 100 99 103 161
2013 2014 2015 2016 2017 2018 2019
Capital investments Capital returns (dividends and share buybacks)
28Solid financial position and liquidity
Strong liquidity position (as at 6/30/2020)
Balanced debt maturity schedule
• Cash (Mx share)1 - $776 million ($ millions)
• Includes increased financial flexibility from draw on our 700
credit facilities
• Negotiated meaningful financial covenant relief
300 300
250
• No near-term debt maturities
• Focused on cash preservation and continue to evaluate all
options to ensure we maintain financial capacity and
2020 … 2022 … 2024 … … 2029 … … … 2044
flexibility
Taken prudent steps to protect business
Balance sheet perspective
• Deferred ~$500 million in capital spending on Geismar 3
project for up to 18 months • Prudent approach to financial management
• Reduced quarterly dividend ($100 million in annual cash • Target ~3.0x debt/EBITDA over the cycle
savings) • Current ratings: Moody’s Ba1 | S&P BB | Fitch BB
• Reduce 2020 maintenance capital spending by $30 million
1 Includes Methanex proportionate share of cash
29Methanex is committed to Responsible Care®
• The Responsible Care® Ethic and Principles for Sustainability is a
United Nations recognized sustainability initiative adopted by the
global chemical industry
• At Methanex, Responsible Care® is the foundation of everything
we do and a key element of our global culture:
Community Employee health
safety and safety
Environmental Product
protection stewardship
Social
responsibility
https://www.methanex.com/responsible-care/responsible-care-sustainability-reports
30Best-in-class corporate governance
BOARD COMPOSITION • DIRECTOR COMPENSATION
• 11 of 12 Independent directors (92%) • Required director equity ownership
of 3x total annual retainer
• Separate chair and CEO
• Prohibition on hedging
• All Committee members are independent
• Not eligible for stock options
• Diversity policy and 42% of directors are female
• Active Board renewal process, average tenure is
five years and average age is 61 years old
• Diverse skills matrix
CORPORATE GOVERNANCE SHAREHOLDER RIGHTS
• Strong risk and strategy oversight • Annual election of directors
• Annual Board, Committee and director evaluations • Individual director elections
• Board orientation and education • Director majority voting policy
• Code of business conduct • Annual “Say-on-Pay”
• In camera sessions at every Board and
Committee meeting
31APPENDIX
Management alignment
• Executive shareholding requirements:
– CEO – 5 times salary in Methanex shares or share units
– Senior executives (5 members) – 3x salary
– Other senior management (~60 employees) – 1x salary guideline
• Short-term incentive linked to ROCE (return on capital employed)
• Long-term incentive targets:
– Stock options and share appreciation rights
– Performance share units
• Payout linked to relative total shareholder return
and 3-year average ROCE
– “…Management does well when shareholders do well!”
32Summary
• Global industry leader with competitive assets
• Solid franchise value that is difficult to replicate
• Integrated global capabilities with network of production sites and
global supply chain
• Solid financial position
• Significant cash flow potential driven by leverage to methanol prices
• Low capital cost growth potential in Louisiana
• Track record of returning excess cash to shareholders through dividends
and share buybacks
Continue to deliver secure and reliable supply to our customers around
the world. Well-positioned to capitalize on market recovery.
33Forward-looking information
This presentation, our Second Quarter 2020 Management’s Discussion and Analysis (“MD&”A) as well as comments made during the Second Quarter 2020 Investor Conference call contain forward-looking statements with respect
to us and our industry. These statements relate to future events or our future performance. All statements other than statements of historical fact are forward-looking statements. Statements that include the words "believes,"
"expects," "may," "will," "should," "potential," "estimates," "anticipates," "aim," "goal", "targets" or other comparable terminology and similar statements of a future or forward-looking nature identify forward-looking statements.
More particularly and without limitation, any statements regarding the following are forward-looking statements: expected demand for methanol and its derivatives; expected new methanol supply or restart of idled capacity and
timing for start-up of the same; expected shutdowns (either temporary or permanent) or restarts of existing methanol supply (including our own facilities), including, without limitation, the timing and length of planned
maintenance outages; expected methanol and energy prices; expected levels of methanol purchases from traders or other third parties; expected levels, timing and availability of economically priced natural gas supply to each of
our plants; capital committed by third parties towards future natural gas exploration and development in the vicinity of our plants; our expected capital expenditures; anticipated operating rates of our plants; expected operating
costs, including natural gas feedstock costs and logistics costs; expected tax rates or resolutions to tax disputes; expected cash flows, earnings capability and share price; availability of committed credit facilities and other financing;
our ability to meet covenants or obtain or continue to obtain waivers associated with our long-term debt obligations, including, without limitation, the Egypt limited recourse debt facilities that have conditions associated with the
payment of cash or other distributions and the finalization of certain land title registrations and related mortgages which require actions by Egyptian governmental entities; expected impact on our results of operations in Egypt or
our financial condition as a consequence of actions taken or inaction by Egyptian governmental entities; our shareholder distribution strategy and anticipated distributions to shareholders; commercial viability and timing of, or our
ability to execute future projects, plant restarts, capacity expansions, plant relocations or other business initiatives or opportunities, including our Geismar 3 Project; our financial strength and ability to meet future financial
commitments; expected global or regional economic activity (including industrial production levels); expected outcomes of litigation or other disputes, claims and assessments; expected actions of governments, governmental
agencies, gas suppliers, courts, tribunals or other third parties; and the potential future impact of the COVID-19 pandemic.
We believe that we have a reasonable basis for making such forward-looking statements. The forward-looking statements in this document are based on our experience, our perception of trends, current conditions and expected
future developments as well as other factors. Certain material factors or assumptions were applied in drawing the conclusions or making the forecasts or projections that are included in these forward-looking statements, including,
without limitation, future expectations and assumptions concerning the following: the supply of, demand for and price of methanol, methanol derivatives, natural gas, coal, oil and oil derivatives; our ability to procure natural gas
feedstock on commercially acceptable terms; operating rates of our facilities; receipt or issuance of third-party consents or approvals, including, without limitation, governmental registrations of land title and related mortgages in
Egypt and governmental approvals related to rights to purchase natural gas; the establishment of new fuel standards; operating costs, including natural gas feedstock and logistics costs, capital costs, tax rates, cash flows, foreign
exchange rates and interest rates; the availability of committed credit facilities and other financing; timing of completion and cost of our Geismar 3 Project; global and regional economic activity (including industrial production
levels); absence of a material negative impact from major natural disasters; absence of a material negative impact from changes in laws or regulations; absence of a material negative impact from political instability in the countries
in which we operate; and enforcement of contractual arrangements and ability to perform contractual obligations by customers, natural gas and other suppliers and other third parties.
However, forward-looking statements, by their nature, involve risks and uncertainties that could cause actual results to differ materially from those contemplated by the forward-looking statements. The risks and uncertainties
primarily include those attendant with producing and marketing methanol and successfully carrying out major capital expenditure projects in various jurisdictions, including, without limitation: conditions in the methanol and other
industries including fluctuations in the supply, demand and price for methanol and its derivatives, including demand for methanol for energy uses; the price of natural gas, coal, oil and oil derivatives; our ability to obtain natural gas
feedstock on commercially acceptable terms to underpin current operations and future production growth opportunities; the ability to carry out corporate initiatives and strategies; actions of competitors, suppliers and financial
institutions; conditions within the natural gas delivery systems that may prevent delivery of our natural gas supply requirements; our ability to meet timeline and budget targets for our Geismar 3 Project, including cost pressures
arising from labour costs; competing demand for natural gas, especially with respect to domestic needs for gas and electricity in Chile and Egypt; actions of governments and governmental authorities, including, without limitation,
implementation of policies or other measures that could impact the supply of or demand for methanol or its derivatives; changes in laws or regulations; import or export restrictions, anti-dumping measures, increases in duties,
taxes and government royalties and other actions by governments that may adversely affect our operations or existing contractual arrangements; world-wide economic conditions; the future impact of the COVID-19 pandemic; and
other risks described in our 2019 Annual Management’s Discussion and Analysis and our Second Quarter 2020 Management’s Discussion and Analysis.
Having in mind these and other factors, investors and other readers are cautioned not to place undue reliance on forward-looking statements. They are not a substitute for the exercise of one’s own
due diligence and judgment. The outcomes implied by forward-looking statements may not occur and we do not undertake to update forward-looking statements except as required by applicable
34 securities laws.Appendix 35
APPENDIX
     Methanol production process

                                 1                                                2                                                 3                             4
                Desulphurization of natural gas                             Reforming                                   Methanol synthesis                   Distillation

                                                                                                                                                                  Refined
                                                                                                                                                Methanol          Methanol
                                                                                        Air Separator                                           Reactors
                                            Desulphurization                                 Unit

                                                                                                          Make-up Gas                   Purge
                                                                                                          Compressor

      Natural gas        Compressor
                                                                Steam
                                                               Reformer
                                                                                             Waste Heat                                             Raw
                                                                                              Recovery                                            Methanol
                                                                          Autothermal                                                                         Water
                                                                           Reformer                                       Recycle Gas
                                                                                                                          Compressor

36
APPENDIX
Global methanol industry demand
By application By region
Other
Traditional MTO Europe
16% 16% 10%
South
America
2%
Acetic Acid
8% North
America
MTBE 9%
11%
China
59%
Other
10%
Other fuel
Formaldehyde applications
28% 11%
AP (ex. China)
DME 10%
Biodiesel
6%
4%
1 Source: IHS Chemical Supply and Demand Spring 2020 Update
37APPENDIX
Global methanol industry demand – by application
% of global
Applications demand1 End uses
• Used as wood adhesive for plywood, particleboard and other engineered wood products
Traditional Formaldehyde ~28%
• Also used as raw material for a variety of building and automotive products
chemical
applications • Used to produce a wide variety of products including adhesives, paper, paint, plastics, resins,
Acetic acid ~8%
(Over 50% of solvents, pharmaceuticals and textiles
global methanol
• Used to produce a wide range of products including adhesives, coatings, plastics, film, textiles,
demand ) Other ~16%
paints, solvents, paint removers, polyester resins/fibers, silicone products
Methanol-to-olefins • Used as an alternative feedstock to produce light olefins (ethylene and propylene) to produce
~16%
(MTO) various everyday products used in packaging, textiles, plastic parts/containers and auto components
Methyl tert-butyl • Used as an oxygenate blending into gasoline to contribute octane and reduce the amount of
Energy-related ~11%
ether (MTBE) harmful exhaust emissions from motor vehicles
applications
(Close to 50% of • Used as an alternative clean-burning fuel for transportation, industrial boilers and kilns, and in a
Fuel applications ~11%
global methanol smaller quantity, for cooking stoves
demand)
Dimethyl ether • A clean-burning fuel that is used as a substitute for liquified petroleum gas (LPG) for household
~6%
(DME ) cooking and heating. Can be used as a clean-burning substitute for diesel fuel in transportation
Biodiesel ~4% • A renewable fuel made from plant oils or animal fats that uses methanol in the production process
1 Source: IHS Chemical Supply and Demand Spring 2020 Update
38APPENDIX
Methanex cost structure
Natural gas
Representative operating cost distribution
• Flexible price structure as approximately 60% of our natural
gas supply contracts are linked to methanol prices:
– North America: ~75% of current natural gas requirements under
Logistics2 long-term fixed price contract or hedges
– Rest of world: natural gas price varies based on methanol prices
which enables assets to be competitive across price cycle
Logistics
Natural • Fleet of ~30 leased and owned vessels supplemented with
gas1 short-term COA vessels and spot vessel shipments
Fixed /
• Integrated supply chain allows benefit of back-haul shipments
G&A
• Network of owned and leased terminals worldwide
• Various in-region logistics capabilities including tanker, barge,
rail, truck and pipeline
Fixed manufacturing and G&A costs
• Primarily people costs (approx. 1,545 employees)
1 Natural gas prices vary with methanol pricing.
39 2 Logistics costs vary based on oil/bunker fuel prices.Thank you Investor Relations T: 604 661 2600 invest@methanex.com www.methanex.com linkedin.com/company/methanex-corporation @Methanex
You can also read