RMI INVESTOR PRESENTATION - STRATEGIC RESTRUCTURE AND RESULTS ANNOUNCEMENT
←
→
Page content transcription
If your browser does not render page correctly, please read the page content below

RMI INVESTOR
                           PRESENTATION
                       STRATEGIC RESTRUCTURE AND
                         RESULTS ANNOUNCEMENT
                                     20 September 2021

                           FOCUS • COLLABORATE • GROW

THIS PRESENTATION AND THE INFORMATION CONTAINED HEREIN IS RESTRICTED AND IS NOT FOR RELEASE, PUBLICATION OR DISTRIBUTION, DIRECTLY OR INDIRECTLY, IN WHOLE OR IN PART, IN OR INTO THE UNITED STATES,
AUSTRALIA, CANADA, JAPAN OR ANY OTHER STATE OR JURISDICTION IN WHICH SUCH RELEASE, PUBLICATION OR DISTRIBUTION WOULD BE UNLAWFUL. PLEASE SEE THE IMPORTANT DISCLAIMERS AT THE END OF THIS PRESENTATION.
FOCUS
                                                                                                                               C O L L A B O R AT E
                                                                                                                                           GROW

TOPICS

 1     RMI STRATEGIC RESTRUCTURE                                                                           Herman Bosman

                                                                                                           Marthinus Visser
 2     OUTSURANCE RESULTS FOR THE YEAR ENDED 30 JUNE 2021
                                                                                                           Jan Hofmeyr

 3     HASTINGS RESULTS FOR THE 6 MONTHS ENDED JUNE 2021                                                   Toby van der Meer

 4     RMI RESULTS FOR THE YEAR ENDED JUNE 2021                                                            Herman Bosman

 5     CONCLUSION                                                                                          Herman Bosman

Capitalised terms have the same meaning as that used in the Restructure announcement published on SENS on 20 September 2021
WHAT HAS RMI ANNOUNCED TODAY?
A fundamental Restructure to align with our evolution as a P&C focused investor
                                                                CURRENT RMI

                                                          Current shareholders

                                                                RMI (listed)
             24.8%                 26.8%                89.1%                    30%            100%       100%

    1            UNBUNDLING OF DISCOVERY AND MMH                        2               RMI RIGHTS ISSUE

                                                   RMI POST STRATEGIC RESTRUCTURE

                                                          Current shareholders

                                                                RMI (listed)
                                   89.1%                30%                      100%           100%

                                                                                                                  2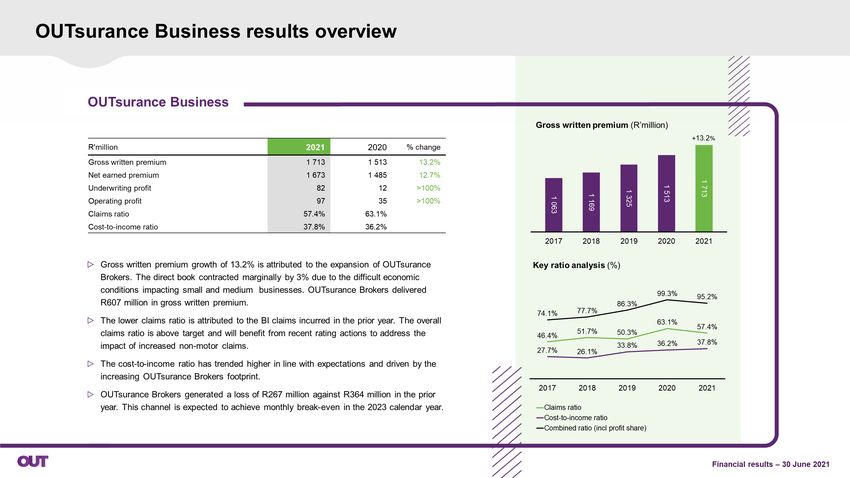
RESTRUCTURE CONSISTENT WITH OUR GROUP’S HISTORY AND ETHOS
   Restructure follows several milestone corporate actions which have all added shareholder value and structured the ownership of assets more
   efficiently

                                                                                                           Acquired Magnum
      Group                                                                                                   (Discovery)
    formation
      as RCI                                                                                        RMB merger

      ‘77                  '80               ‘81                  ‘82           ‘83          ‘84            ‘85 ‘85                 ‘86                ‘87          ‘88               ‘89

    Discovery listed   Formed FirstRand   Acquired
       Launched          Bought FNB     Southern Life     OUT      Launched                                             Discovery         RMH      Acquired 77%
     Discovery Life       from Anglo     from Anglo      formed     Vitality                                            formation         listed   of Momentum

                          ‘99       ‘98      ‘98        ‘98       ‘97           ‘96          ‘95               ‘94             ‘93 ‘93                 ‘92          ‘91               ‘90

                                                                                                                                                    Discovery
                                                                                         Discovery UK       Discovery                               unbundled      Youi
                                                                                            created         BEE deal                                from FSR      formed

                           ‘00               ‘01                  ‘02           ‘03          ‘04              ‘05                   ‘06                ‘07          ‘08               ‘09
           RMH’s
         interest in    Launched                                                                                                                      MMH         RMI/H     Momentum Unbundling
Delisted FirstRand      Discovery                         Acquired a stake in                               New team                                  BEE          BEE      Metropolitan / Listing
Hastings unbundled        Bank                                 Hastings                                     appointed                                 deal         deal       merger      of RMI

    ‘20 ‘20               ‘19                ‘18                  ‘17           ‘16          ‘15              ‘14                   ‘13                ‘12        ‘11 ‘11           ‘10 ‘10

    RMI’s association with Discovery and MMH dates from the early 1990s with the group acquiring a controlling interest in MMH in 1992 and providing access to the seed funding
    and license to build Discovery in 1993
                                                                                                                                                                                              3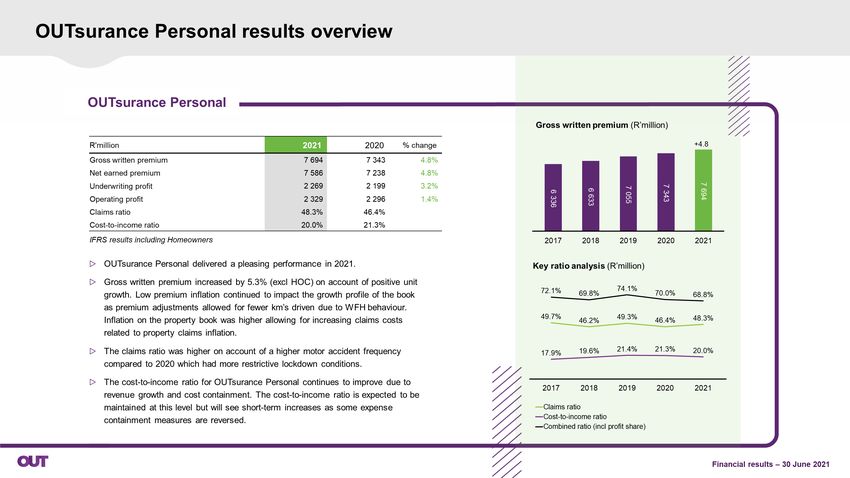
PROUD ASSOCIATION WITH MMH AND DISCOVERY
Partnership from inception to todays large, established businesses; resilient operations; poised for future growth

                                                                                            Attractive TSRs since RMI listing:
                                                                                                                                                Elements of success
                                                                                            Discovery (308%), MMH (115%)                        RMI has acted as a stable, long-term,
                                                                                                                                                value-additive shareholder, by partnering
                                                                                                                                                with their management teams and
                                                                                                                                                boards
                                                                                                                                                This approach has driven growth
                                                                                                                            TSR
                                                                                                                                                and innovation at Discovery and MMH,
                                                                                                                            SA life index TSR
                                                                                                                                                which have created some of the most
                                                                                                                                                iconic financial services brands
                                                                                                                                                in South Africa
                                                                      Participation
                                                                                                  Launch of
                                                                      in Discovery                                                              RMI liberates investments at the
                                                                                                  Discovery
                                                                       rights issue
                                                                                                    Bank
                                                                                                                            Market cap today:   appropriate stage in their life cycle
                                                                                                                            R84.1bn
                                                                                                                                                Discovery and MMH are well-established
 Discovery market                                                                   Traction in Reset Launch of Reinvent                        businesses under the stewardship of
                                                                                   and Grow strategy and Grow strategy
   cap in 2011:                                                                                                                                 leading management teams and boards
     R23.6bn                                                         RMI increased
                MMH BEE                                           shareholding in MMH
   MMH market transaction
   cap in 2011:                                                                                                             Market cap today:   Unbundlings to be implemented as pro
    R24.6bn                                                                                                                 R29.4bn
                                                                                                                                                rata distribution in specie in terms of
              2010     2011     2012    2013     2014     2015     2016    2017    2018    2019     2020      2021   2022                       section 46 of the Companies Act and
                                                                                                                                                Income Tax Act

                                       The Restructure will have no impact on the respective solvency positions of these businesses
Source: Reuters and Bloomberg; as at 17 September 2021; Note: TSR rebased to 100                                                                                                            4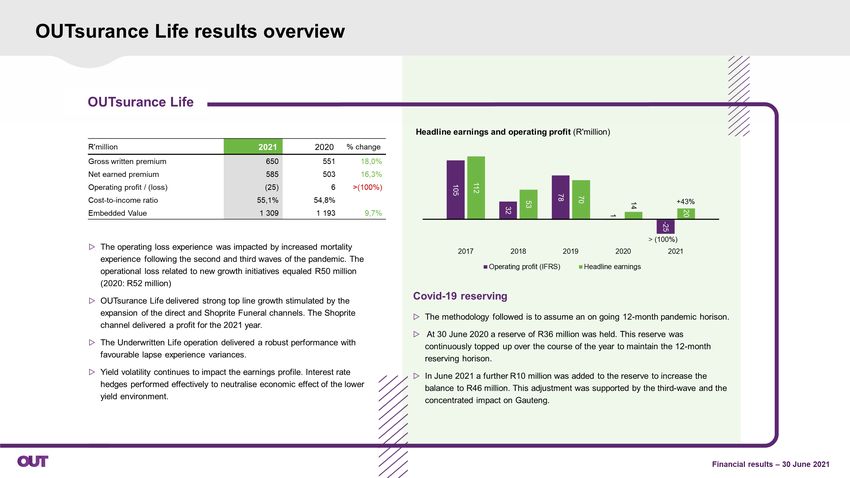
Longer-term focus

WHY ARE WE IMPLEMENTING THE RESTRUCTURE?
Portfolio focused on (1) unlisted P&C assets; (2) optimised capital structure; (3) value unlock through discount reduction

1
                                           P&C premium performance since 2005
    o Deliberate focus to align
      structure to strategy as                10
      an international P&C-
      biased investor                           5

    o Not a comment on the                      0
      state of life insurance in                                                             GFC
      South Africa or a                       (5)
      reflection on Discovery
                                             (10)
      nor MMH
                                                        5          6           7         8            9   10        11    12    13         14   15        16    17     18         19
    • WHY – PRO-
                                                             World Life            World P&C
      STRUCTURAL
      CHOICE?
     • Preference for unlisted             P&C ROE performance since 2013
       assets                                 25
                                                                                                                                                                             20
     • Currently, exposed to                  20                                                                                      16
                                                                                                                                                     18         18
       two competing and                      15            12                 13               12                        13
                                                                                                               11
       listed life assets via
                                              10                                                                          13                                                 14
       minority interests                                   11                                                                        12
                                                                               10               10             9                                     9
                                                5
     • Significant levels of                                                                                                                                     7
       influence and agility at                 0
       unlisted OUTsurance                               2013                2014              2015        2016          2017        2018        2019          2020F        2021F
       and Hastings
                                                            Life          Non-Life

Sources: Global Insurance Report 2021, Allianz Research, 12 May 2021                                                                                                                   5
WHY ARE WE IMPLEMENTING THE RESTRUCTURE?
Portfolio focused on (1) unlisted P&C assets; (2) optimised structure; (3) value unlock through discount reduction
2
     Regulatory robustness as direction of travel points to increased economic inclusivity and de-concentration of the economy
     Efficient and agile capital structure, delivering sustainable and predictable dividends

                                                                        CURRENT RMI                                                                        RMI POST RESTRUCTURE
                                                                                 Leverage ratio          Current leverage
                                                                                   covenant                   ratio
                                         Gross debt

                                                                                                                                        Gross debt
                                                                                                                                         (ZARbn)
       Reducing                           (ZARbn)                                     4.0x                    3.4x                                                    Leverage ratio   Gross debt target
                                                                     11.8        Interest cover          Current interest                            6.0
       leverage                                                                                                                                                          < 2.5x            < R6bn
                                                                                 ratio covenant            cover ratio
                                                                                     2.25x                    3.6x

       Maintaining
       smaller
                                        ○ Current: contingency buffer of R2bn                                                           ○ Reduced contingency buffer of R1 billion
       contingency
       buffer

       Enhanced                         ○ Current policy: growth in line with CPI                                                       ○ Target: dividend payout ratio of 50% of free cash flow
       dividend yield                   ○ At current share price, a yield of ~1.4%                                                        generated (1) (as set out on slide 16)

    The Unbundlings and reduction in collateral assets drive requirement for an equity raise of up to R6.5bn to align capital structure with new asset base and dividend flow post the
    Restructure

Market data as at 30 June 2021
(1) Free cash flow generated is defined as gross cash flow received from portfolio companies, net of debt costs and central overheads                                                                      6
Short-term value creation

  WHY ARE WE IMPLEMENTING THE RESTRUCTURE?
  Portfolio focused on (1) unlisted P&C assets; (2) optimised capital structure; (3) value unlock through discount reduction
  3
      Restructure is expected to unlock material shareholder value through a reduction in the discount at which RMI currently trades to its underlying intrinsic value

   Market Cap / Intrinsic net asset value (NAV) (x)
      1,4

      1,2

      1,0

      0,8
                                                                                                                                                                  ~29%
                                                                                                                                                                Discount to
      0,6                                                                                                                                                      intrinsic NAV

      0,4
       Sep-11            Sep-12            Sep-13             Sep-14            Sep-15       Sep-16   Sep-17     Sep-18         Sep-19         Sep-20          Sep-21
                     RMI                    SA IHC average
  Market data as at 17 September 2021
  Note: SA IHC average comprises of Brait, Naspers, PSG Group, Reinet, Remgro, RMH and RMI                                                                                     7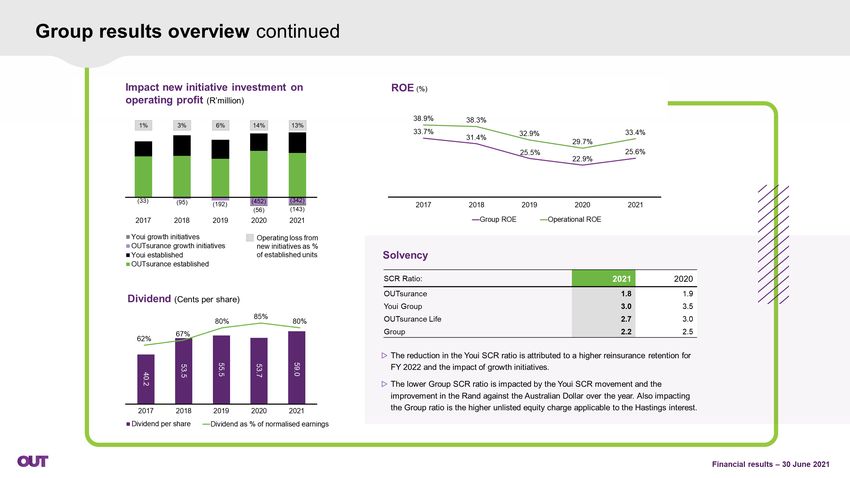
OTHER SALIENT TERMS OF THE RESTRUCTURE
The Restructure is underpinned by support from ~65% of shareholders

                 ○ RMI has received in-principle support from shareholders representing 65% of RMI shares:

                     • its largest shareholders, Remgro and Royal Bafokeng Holdings

 Key                 • the founders of the RMB group of companies, Messrs Laurie Dippenaar, Paul Harris, GT Ferreira and Pat Goss
 shareholder
 support             • large institutional shareholders, Coronation Asset Management (Pty) Limited, Allan Gray (Pty) Limited and Abax Investments (Pty)
                       Limited (all on behalf of various clients)
                 o RMI’s lending banks have indicated their support for the Restructure as well as for the capital structure post implementation of the
                   Restructure

                 ○ It is envisaged that the Restructure will be implemented in Q2 2022

                 ○ Rights Issue will be implemented prior to the Unbundlings as an indivisible component of the Restructure
 Timing
                 ○ Management and the RMI Board will remain dynamic in assessing market conditions and customary regulatory approvals

                 ○ The RMI Board reserves the right, in its discretion, to decide not to proceed with the Restructure and/or to change any aspects thereof

                 ○ RMI’s appointed non-executive directors will remain on the Discovery and Momentum Metropolitan boards respectively, until at least the
 Governance
                   implementation of the Restructure

                                                                                                                                                             8
UNPACKING KEY COMPONENTS OF FUTURE RMI

     1     NET ASSET VALUE BUILD-UP

     2     PORTFOLIO COMPOSITION

     3     STRATEGIC POSITIONING

     4     FOCUS ON:

           4.1   Growth

           4.2   Cash generation and dividend framework

           4.3   Expansion

                                                          9
1 NET ASSET VALUE BUILD-UP
o The indicative effects of the Restructure set out below are for illustrative purposes only and are based on 30 June 2021 market prices with internal valuations
calculated for unlisted assets
Indicative RMI SOTP valuation Post-Restructure (Rbn)
Market value of listed stakes Internal valuation Illustrative impact of Restructure
35,4 1,6
66,4 Current RMI
market cap
(8,5)
R47.2bn
6,5 44,3
9,3 (20,8)
7,8 (7,8)
20,8
(1) Net HoldCo Current RMI Net Discovery (1) MMH Up to R6.5bn Illustrative RMI Net
Liabilities Intrinsic Value Unbundling Unbundling Rights Issue Intrinsic Value Post
Restructuring
R28.6bn in value returned to shareholders; market capitalisation reflective of underlying assets
Source: Market data and internal management valuations as at 30 June 2021
(1) Does not include effects of R1.5bn Discovery announced capital raise
(2) The FY21 INAV dividend yield is highly indicative and is included for illustrative purposes only to demonstrate the effects of the Restructure. This analysis excludes the effects of de-leveraging and change in the
share count on the dividend. 102 PORTFOLIO COMPOSITION
Evolving towards an unlisted, geographically diverse P&C investor
PORTFOLIO MIX(1)
3 8 1 1
2014 (%) 2021 (%) 13 POST
28 RESTRUCTURE
40 OUTsurance OUTsurance 2022E (%)
25
MMH 51 MMH
Discovery Discovery OUTsurance
RMBSI 16 Hastings Hastings
87
29
AC / IMG AC / IMG
1 1
2014 (%) 2021 (%) POST
INDUSTRY (1)
RESTRUCTURE
41 2022E (%)
49 51
Life 58 Life
P&C P&C P&C
99
AC / IMG AC / IMG
2 8 13
GEOGRAPHY (1)
17 2014 (%) 2021 (%) POST
13 RESTRUCTURE
2022E (%)
22
South Africa South Africa 65 South Africa
81 Australia 79 Australia Australia
New Zealand UK UK
(1) Note: indicated data is based on contribution to normalised headline earnings 113 STRATEGIC POSITIONING
Reflecting our strategic positioning
Following the Restructure RMI’s portfolio will become simpler reflecting:
1 Focused P&C player
2 Portfolio of globally relevant, difficult to otherwise access, unlisted assets
3 Single entry point to portfolio of assets
4 More predictable cashflows through P&C focused portfolio and enhanced dividend profile
5 Network of non-competing and collaborating local champions
124.1 GROWTH: ATTRACTIVE OUTLOOK FOR OUTSURANCE AND HASTINGS
Drivers of growth in our core assets
P&C focus o In South Africa, OUTsurance Business and OUTsurance Life continue their strong acceleration in new
business volumes
Growth through o Youi CTP product and the Youi Blue Zebra broker partnership continue to grow
new initiatives
o Hastings focus on building out a higher APV segment and Home insurance
Leveraging the existing, o Significant cooperation benefits identified between Hastings and Sampo
collaborative platform
1
SIGNIFICANT
5.2 million >USD2bn 8 810 187
COMBINED SCALE customers GWP employees Actuaries and
AND EXPERTISE data scientists
2 ~ R9.4bn GWP (1) ~ R10.5bn GWP ~ £980m GWP (2)
UNDERPINNED ~ R1.9bn earnings ~ R740m earnings ~ £85m PAT (2) (3)
BY STRONG ~ 76% combined ratio ~ 88% combined ratio ~ 93% combined ratio (4)
FUNDAMENTALS ~ >80% cash conversion ~ >80% cash conversion ~ 66% cash conversion
3 World-class Brand building Reinsurance
Best-in-class
COLLABORATION AND GROUP call centre and direct structuring
bodily injury
EFFECTS and offshoring marketing and pricing
experience
capability excellence expertise
(1) Excludes OUTsurance Life; (2) FY2020 figures; (3) Excluding transaction costs; (4) Hastings tracks a combined operating ratio 134.2 CASH GENERATION: FACILITATES GROWTH AND DIVIDENDS
KEY PORTFOLIO ASSETS HAVE STRONG TRACK RECORD OF CASH GENERATION
RMI POST RESTRUCTURE
Pay-out ratio 62% 67% 80% 85% 80%
(% of earnings)
TARGET A DIVIDEND PAY-OUT RATIO OF
Dividend 50% OF FREE CASH FLOW GENERATED
HISTORICAL
4.3% 5.3% 5.4% 5.2% 5.2%
yield(1)
2 032 2 108 2 040 2 241
Dividends
(R’m) 1 527
REMAINING CASH TO BE USED TO:
SUPPORT PORTFOLIO BUSINESSES IN
FY2017 FY2018 FY2019 FY2020 FY2021
GROWTH OPPORTUNITIES
FORWARD
LOOKING
EXPECTED DIVIDEND PAY-OUT OF ~60-80%
OPTIMISE CAPITAL STRUCTURE AND REDUCE LEVERAGE
Pay-out ratio
(% of Adjusted 67% 56% 59% 88% 85%
PAT) (2)
Dividend
HISTORICAL
2.3% 3.9% 4.9% 5.3% 4.5%
yield(1)
Dividends 1 508 1 643 POTENTIAL INVESTMENT ACTIVITY
(R’m)(3)
1 394
1 206
721
FY2016 FY2017 FY2018 FY2019 FY2020
IF INVESTMENT OPPORTUNITIES DO NOT MEET CRITERIA,
FORWARD
LOOKING
CURRENT DIVIDEND POLICY IN LINE WITH AGREEMENT AS AT TIME OF EXCESS CASH WILL BE RETURNED TO SHAREHOLDERS
DELISTING. REVISED POLICY TO BE AGREED IN MEDIUM-TERM
(1) Based on constant reported internal valuation of OUTsurance and Hastings as at 30 June 2021
(2) Excludes certain non-cash items
(3) Average GBP/ZAR exchange rate per year 144.3 EXPANSION: STRUCTURED APPROACH TO INVESTING FOR FUTURE GROWTH
Any further expansion will be deliberate and informed by our style as a disciplined, long-term investor in appropriate assets
Leveraging platform to enter new markets
o RMI will continue to selectively assess investments in unlisted P&C, in order to be a value-adding partner to
GROWTH AMBITIONS
Geographical
AND FRAMEWORK
expansion ‘local champions’ in select markets either directly or through portfolio companies
o South Africa not excluded per se
Life-stage expansion through P&C
Life-stage
o In dynamic P&C markets, not all future local champions will currently be an incumbent
expansion
o Flexibility to also target earlier stage investments through insurtech
o Additional benefit of technology contribution to current portfolio
INVESTMENT ACTIVITY TO CONFORM WITH GROUP’S INVESTMENT FRAMEWORK
CAPITAL POLICY STRATEGY FINANCIAL RETURNS
○ P&C focused, with preference for unlisted
○ Geographically diversified ○ Different return hurdles depending on stage of
○ Leverage ratio remains within target range of
○ Across all life stages investment, but overall portfolio return target of
15%
○ Dividend accretive within 3 years(1)
○ Partner to world-class entrepreneurial management ○ EPS accretive within 3 years (1)
teams
Further detail will be discussed with shareholders in the coming months pre implementation of the Restructure
1. Does not pertain to early-stage investments 1517
18
19
20
21
22
23
24
25
26
27
28
29
30
Hastings Group

Hastings H1 Results
Reminder of what we do

• Technology led challenger to traditional UK insurers in motor and home insurance
• Experts in digital and price comparison distribution
• Heavy users of large complex data to enable more refined and more rapid risk selection,
  pricing and claims optimisation
• High digitalisation of customer experience, high retention
• Simple financial model: Low cost, stable and diversified underwriting and retail income,
  highly cash generative

                                                                                             Page 32
H1 financial highlights
Good financial momentum in 2021…
• Profit before tax of £76 million*, up 20% year on year
• Calendar year loss ratio of 63.4%
• Live customer policies of 3.1 million, + 4% year on year.
Customer retention continues to be high and above market averages
• Solvency coverage ratio of 170% (30 June)
• Market premium reductions during Q1, with signs of this stabilising during Q2
• Claims remained below 2019 levels, however up in Q2 as restrictions were lifted
* Excluding the impact of acquisition accounting
Page 33A few H1 operational highlights
And good progress on operational and strategic initiatives
Customer service
• Focus on customers through ongoing Covid support,
systems enhancements and process and supplier
changes, leading to continued high customer NPS scores
• High colleague engagement, including continued
homeworking
• New products, pricing models and sources of data,
laying the foundations for continued profitable growth
• Mobile app enhancements live
• Progress on claims initiatives including optimizing
and digitalising repair journeys for customers
• Home insurance customer policies up 27% year-on year
to almost 300,000
Page 34Digital: one example of capabilities needed and strategic focus area
Digital capabilities
• Embraced mobile app – one of the first mainstream UK
insurance providers to launch one
• Now highest rated app out of mainstream UK insurance
providers
• Significant adoption and growth – 1.7m log ins in H1
2021, +70%
• Increased self serve, supporting low cost
• High customer engagement and positive feedback -
increasing customer NPS and retention
• Potential future value driver – e.g. New YouDrive
telematics product
Hi John,
Page 35Hastings is setting out to become a market leader…
Hastings is setting out to become a market leader…
Become the
Best and Biggest Digital Insurance Provider
Hastings today Market leaders
Large scale
3.1m policies 6m+ policies
ambition
£131m UK profit £600m+ UK profit
Pricing Customer Claims Digital New
Home
6 clear focus areas and anti-fraud retention transformation (low cost) propositions
to drive profitable
growth:
Underpinned by
Colleagues, Culture and focus on ESG
…with acceleration through new ownership and strategic investment
Page 36Delivering on our vision – strategic focus areas
A significant change and technology programme continues, building on 2019/20 momentum
and leveraging our new technology
Hastings 2021 change programme
Pricing Customer Claims Digital New
Home
and anti-fraud retention transformation (low cost) propositions
• Next generation PCW • New pricing models • Optimisation of new • New mobile quote • Strengthened • New multi car launch
market, lifetime value (incl FCA pricing claims repair partners and buy platform leadership and pricing • New app
and fraud models practices) • TPPD: Bilaterals & • Next generation team based telematics
• New cloud based data • 2nd generation PCW more aggressive stance mobile app • New models and data proposition rollout
platform renewals ‘loyalty tool’ • Advanced claims • New functionality: enrichment • Test and learn
• Alternative risk pricing • New digital renewals analytics policy changes, claims, • New internal claims approach to other
models capability • New bodily injury renewals capabilities products
• Significant data • Customer service approach (fraud, • Digital adoption drive • New policy wording
enrichment pipeline improvement plan Whiplash reform) and excesses
• Footprint expansion • Brand and comms • Automation and • Panel insurer hosted
testing relaunch digitalisation pricing
10m UK switchers p.a. £300m £750m c.£100m 8% market share 10m
£1bn premium premiums lost claims operational = 2m policie households with
£300m retail income on renewal p.a cost p.a expenses p.a. & £400m premium multiple vehicles
Page 37Benefits from P&C ownership
Strategic and financial benefits of collaboration with non-competing P&C leaders in their markets
• Strong embedded relationship with RMI and OUTsurance:
• Collaboration benefits realised in pricing, call centre capabilities and outsourcing
• Pipeline of other collaboration topics, with agile exchange of information and ideas
• New framework of collaboration established with Sampo and its subsidiaries:
• Sampo and subsidiaries bring additional expertise in P&C
• Workstreams established spanning pricing, claims and digital
• Capital strength of shareholders provides opportunities to reduce reliance on quota share
reinsurance, generating an attractive return on capital
Page 38Regulatory reforms
Hastings is well positioned in the face of regulatory change
FCA review of pricing practices
• Final policy statement received in Q2
• Expected to stop practices of aggressive new business discounting
• Therefore alignment of pricing likely to increase new business prices
“6 million policy holders paid high
• Hastings business model well positioned
prices in 2018. If they paid the
average for their risk they would
have saved £1.2bn.”
Whiplash reforms
• Became effective May 2021
• Small bodily injury claims to reduce
• Still too early to assess effectiveness, but impact unlikely to be material
Page 39RMI FOCUS • COLLABORATE • GROW
RMI’s FY2021 RESULTS: RESILIENCE IN TOUGH ENVIRONMENT

    NORMALISED EARNINGS                        DIVIDEND PER SHARE

    +15%                                       22.5cps
    to R3.5bn                                  FY21 total: 45cps

    FUNDING AND HOLDING COMPANY COSTS          NET FUNDING COSTS          532

    +1.2%                                      HOLDING COMPANY EXPENSES

                                               TOTAL
                                                                           65

                                                                          597
    % of market cap

                                                                                41
IN CONCLUSION
Our purpose is to add discernible value by providing our stakeholders
with the opportunity to access unique, geographically diversified property & casualty insurance businesses
We will achieve this through our partnerships with unlisted, dynamic, growth companies
across all life phases which are local champions in select markets that demonstrate attractive characteristics
Our collaborative model and flexible capital structure will enable us
to provide attractive returns to our shareholders now and into the future
The Restructure enables RMI to: FOCUS COLLABORATE GROW
42QUESTIONS FOCUS • COLLABORATE • GROW
IMPORTANT INFORMATION - DISCLAIMER

Shareholders should note that the RMI Board reserves the right, in its discretion, to decide not to proceed with the Restructure and, as such, the Restructure may or may not proceed.
The release, publication or distribution of this presentation in jurisdictions other than South Africa may be restricted by law and therefore persons into whose possession this presentation may come should inform themselves about, and observe, any such applicable restrictions or requirements.
Any failure to comply with such restrictions or requirements may constitute a violation of the securities laws and regulations of any such jurisdiction. To the fullest extent permitted by applicable law, the Company disclaims any responsibility or liability for the violation of such restrictions or
requirements by any person.
This presentation is for information purposes only and is not, and should not be construed as to constitute, an offer to sell or the solicitation of an offer to buy securities and neither this document nor anything herein nor any copy thereof may be taken into or distributed, directly or indirectly, in
or into any jurisdiction in which to do so would be prohibited by applicable law.
These materials are not for distribution, directly or indirectly, in or into the United States (including its territories and possessions, any State of the United States and the District of Columbia) Canada, Australia or Japan. These materials do not constitute or form a part of any offer or solicitation
to purchase or subscribe for, or otherwise invest in, securities in the United States. The securities mentioned herein have not been, and will not be, registered under the United States Securities Act of 1933 (the “Securities Act”).
The securities may not be offered or sold in the United States or except pursuant to an exemption from, or in a transaction not subject to, the registration requirements of the Securities Act. There will be no public offer of any securities in the United States.
In the United Kingdom, this presentation is being distributed only to, and is directed only at, persons who: (A) (i) are "investment professionals" specified in Article 19(5) of the Financial Services and Markets Act (Financial Promotion) Order 2005 (the "Order") or (ii) high net worth entities falling
within Article 49(2)(a) to (d) of the Order or (iii) are other persons to whom it may otherwise lawfully be communicated; and (B) are "qualified investors" within the meaning of Article 2(e) of the Prospectus Regulation (Regulation (EU) 2017/1129) as it forms part of retained EU law as defined in
the European Union (Withdrawal) Act 2018 (all such persons together being referred to as "Relevant Persons"). In the European Economic Area (the "EEA"), this presentation is addressed only to and directed only at, persons in member states who are "qualified investors" within the meaning
of Article 2(e) of the Prospectus Regulation (Regulation ((EU) 2017/1129) ("Qualified Investors"). This presentation must not be acted on or relied on (i) in the United Kingdom, by persons who are not Relevant Persons, and (ii) in any member state of the EEA, by persons who are not
Qualified Investors. Any investment or investment activity to which this presentation relates is available only to: (i) in the United Kingdom, Relevant Persons; and (ii) in any member state of the EEA, Qualified Investors, and will be engaged in only with such persons.
In South Africa, the information contained in this presentation does not constitute or form a part of any offer to the public for the sale of, or subscription for, or an invitation, advertisement or the solicitation of an offer to purchase and/or subscribe for, securities as defined in and/or contemplated
by the Companies Act 71 of 2008, as amended (“Companies Act”). Accordingly, this presentation does not, nor does it intend to, constitute a "registered prospectus" or an advertisement relating to an offer to the public, as contemplated by the Companies Act and no prospectus has been, or
will be, filed with the South African Companies and Intellectual Property Commission in respect of this presentation.
The information contained in this presentation constitutes factual information as contemplated in Section 1(3)(a) of the Financial Advisory and Intermediary Services Act, 37 of 2002, as amended ("FAIS Act") and should not be construed as an express or implied recommendation, guide or
proposal that any particular transaction in respect of the RMI shares or in relation to the business or future investments of RMI, is appropriate to the particular investment objectives, financial situations or needs of a prospective investor, and nothing contained in this presentation should be
construed as constituting the canvassing for, or marketing or advertising of, financial services in South Africa. RMI is not a financial services provider licensed as such under the FAIS Act.
The financial adviser to RMI is acting exclusively for RMI and no one else in connection with the Restructure. The financial adviser will not regard any other person as its client in relation to the Restructure and will not be responsible to anyone other than RMI for providing the protections
afforded to its client nor for giving advice in relation to the Restructure or any other transaction or arrangement referred to in this presentation.
No representation or warranty, express or implied, is made or given, and no responsibility is accepted, by or on behalf of the financial adviser or any of its affiliates or any of its directors, officers or employees or any other person, as to the accuracy, completeness, fairness or verification of the
information or opinions contained this presentation and nothing contained in this presentation is, or shall be relied upon as, a promise or representation by the financial adviser or any of its affiliates as to the past or future. Accordingly, the financial adviser and its affiliates and directors, officers
and employees disclaim, to the fullest extent permitted by applicable law, all and any liability, whether arising in tort or contract or that they might otherwise be found to have in respect of this presentation and/or any such statement.
Nothing contained in this presentation constitutes, or is intended to constitute, investment, tax, legal, accounting, or other professional advice.
Shareholders are advised that the information in this presentation has not been reviewed and reported on by RMI’s external auditors and it does not constitute a profit forecast..
Forward-looking statements
This presentation contains statements about the RMI and the RMI group of companies (the "Group") that are, or may be, forward-looking statements. All statements (other than statements of historical fact) are, or may be deemed to be, forward-looking statements, including, without limitation,
those concerning: strategy; the economic outlook for the industries in which RMI and the Group operates or invests as well as markets generally; production; cash costs and other operating results; growth prospects and outlook for operations and/or investments, individually or in the
aggregate; liquidity, capital resources and expenditure, statements in relation to Restructure, its implementation and the benefits of the Restructure. These forward-looking statements are not based on historical facts, but rather reflect current expectations concerning future results and events
and generally may be identified by the use of forward-looking words or phrases such as "believe", "aim", "expect", "anticipate", "intend", "foresee", "forecast", "likely", "should", "planned", "may", "estimated", "potential" or similar words and phrases. Examples of forward-looking statements
include statements regarding a future financial position.
By their nature, forward-looking statements involve known and unknown risks and uncertainties because they relate to events and depend on circumstances that may or may not occur in the future. The Company cautions that forward-looking statements are not guarantees of future
performance. Actual results, financial and operating conditions, returns and the developments within the industries and markets in which the Company and/or the Group operates and/or invests may differ materially from those made in, or suggested by, the forward-looking statements
contained in this presentation. All these forward-looking statements are based on estimates, predictions and assumptions, as regards the Company and the Group, all of which estimates, predictions and assumptions, although the Company believes them to be reasonable, are inherently
uncertain and may not eventuate or eventuate in the manner the Company expects. Factors which may cause the actual results, performance or achievements to be materially different from any future results, performance or achievements expressed or implied in those statements or
assumptions include matters not yet known to the Company or not currently considered material by the Company.
Investors should keep in mind that any forward-looking statement made in this presentation or elsewhere is applicable only at the date on which such forward-looking statement is made. New factors that could cause the business of the Company and the Group not to develop as expected may
emerge from time to time and it is not possible to predict all of them. Further, the extent to which any factor or combination of factors may cause actual results, performance, or achievement to differ materially from those contained in any forward-looking statement is not known. The Company
has no duty to, and does not intend to, update, or revise the forward-looking statements contained in this presentation or any other information herein, except as may be required by law. Any forward-looking statement has not been reviewed nor reported on by the Company's external auditor
or any other expert.

                                                                                                                                                                                                                                                                                                                44
You can also read