VIETJET AVIATION JOINT STOCK COMPANY - PRESENTATION SEPTEMBER 2018
←
→
Page content transcription
If your browser does not render page correctly, please read the page content below
VietJet Aviation Joint Stock Company
                          Presentation

                        September 2018
Company Overview
Ranking Vietjet Ranking Vietjet
Business Description Pax Market Share (4) vs. VN carriers vs. all carriers
21.0% 1 1
46.9%
Having commenced operations in December 2011, VietJet had grown rapidly to become the largest
airline in Vietnam after only 4 years of operations, commanding a market share of 45% and 43% by 18.3% 2 3
42.9%
passenger count and capacity(5) respectively
14.2% 2 5
35.3%
Operating revenue CAGR was at 43% over 2015-17, while profitability has remained best-in-class
with adjusted EBITDAR(1) margin of 32.7% in 2017, compared to peer average of 27%-28% 4.9%
35.0% 2 5
Went public in the country’s then-largest IPO in Feb 2017, with market capitalization having tripled 27.4%
27.4% 2 2
since then to reach ~USD 3.6bn
16.2%
49.6% 1 1
Strong earnings and the IPO have resulted in a robust balance sheet, with Net Debt/ Equity(2) falling to
1.9x in 1H18 from 7.8x in 2015 10.3%
15.2% 2 3
One of the most efficient airlines in the world with CASK ex-fuel of 2.32 cents in 2017 6.2%
21.1% 3 7
One of the youngest and fastest growing fleets in the world, further sustained by a large order book 33.3%
49.6% 1 1
of 371 aircraft to be delivered by 2025(3)
45.0% 1 1
Load factor remains at 88% in 2017, amongst the highest in Asia Pacific, despite aggressive growth 45.0%
MS Vietjet vs. all carriers MS Vietjet vs. Vietnamese
Strong Projected Passenger Growth Growing Fleet supported by Orderbook Domestic Market Share(5)
(millions of passengers) (# aircraft)
By Passenger Count
70
66 Jetstar Others
Pacific 2%
30 15%
60 11 VietJet
25 24 45%
FY12-18
50
FY12-18e CAGR: 53.7%
20 CAGR: 69.8% Vietnam
17 Air
40 38%
13 2H18e
15 14
30
55 By Capacity Jetstar Others
50
10 9 Pacific 2.2%
20 41 15.0%
6 30 VietJet
5 11 1H18 10 19
44.8%
3
1 10
5 Vietnam
-
- Air
FY12 FY13 FY14 FY15 FY16 FY17 FY18e
FY12 FY13 FY14 FY15 FY16 FY17 FY18 38.0%
Source: Company Information, CAPA; Note: (1) Excludes revenue and cost relating to sale-and-leaseback, (2) Lease adjusted, (3) As of 30 Jun 2018, (4) CAAV data as at H12018, (5) CAAV data for H1 2018 1
Route network map

 As ofSource:
       30/6/2018:           94 routes (38 domestic and 56 international)
              Company Information                                                                                                       2

Source: Company Information. As at August 31st, 2018 Vietjet operates 101 routes out of which 38 domestic and 63 international routes
Investment Highlights

  1     Largest domestic airline in Vietnam, the fastest growing aviation market in Asia Pacific

  2     Young fleet with large growing order book

  3     Best-in-class cost structure with strong operational performance

  4     Excellent financial performance

  5     Significant ancillary revenue upside

  6     Strong brand recognition

  7     Experienced leadership team

Largest domestic airline in Vietnam, the fastest growing aviation market in Asia Pacific
1
        Highest growth in air passenger traffic and inbound tourism

    Air passenger traffic growth                                                                                               Inbound tourism growth(1)
    2012-2017 Historical Passenger Traffic CAGR (%)                                                                            2012-2017 Inbound Tourism CAGR (%)

            Vietnam                                                                               28.9%                                 8.7%             8.6%

               China                                   11.5%

            Thailand                                  11.1%                                                                                                                6.9%
                                                                                                                                                                                           6.5%
       South Korea                                  10.4%

                 India                              10.1%

           Malaysia                            8.1%

      New Zealand                         5.9%
                                                                                                                                                                                                       3.1%

         Philippines                   5.0%
                                                                                                                                                                                                                  2.0%
          Indonesia                  4.2%

          Singapore                  3.9%

            Australia            2.5%
                                                    Asia Pacific Avg.: 8.7%                                                           Vietnam          Thailand        Philippines       Indonesia   Singapore   Malaysia
               Japan            2.2%

    Source: Euromonitor, EIU; Note: (1) Refers to number of non-resident visitors who travel to the country for a period not exceeding 12 months for non-commercial related activities                                      4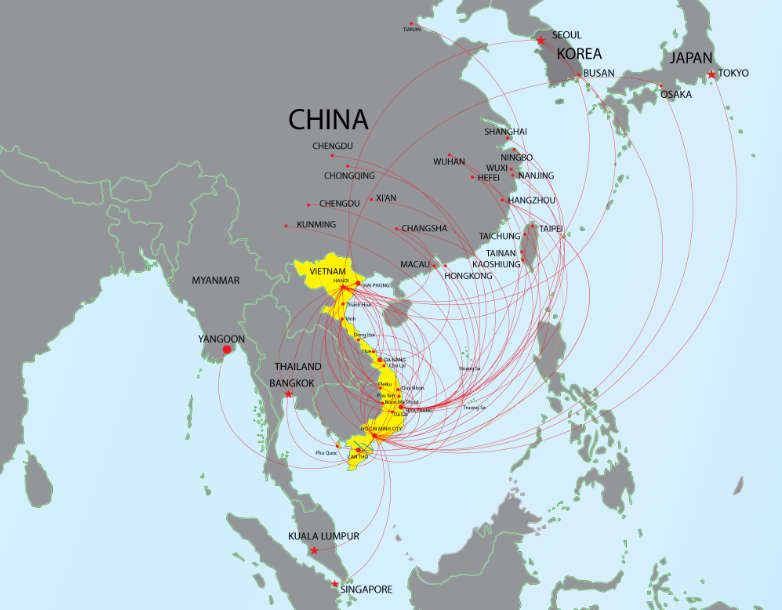
Largest domestic airline in Vietnam, the fastest growing aviation market in Asia Pacific
1
Vietnam is supported by strong fundamentals
Large population estimated One of the fastest growing SEA economies A powerful consumer economy(1)
to reach 96.5 million in 2018
(2016-2018e GDP CAGR) Highest forecasted growth in personal disposable income
+ 8% 8.0%
7% 6.7% 6.7%
Young population with a 7.0%
2012-2018e Disposable Income
sizable 25.9% between 20 5.6%
6% 6.0%
per Capita CAGR (%)
and 34 years of age 5.2%
5% 5.0%
+ 4%
3.9%
3.3% 4.0%
High growth in personal 3%
3.0%
disposable income
2%
2.0%
1%
+ 1.0%
-
Lengthy topography lacking VN PH MY ID TH SG -
effective road / rail 40% 45% 50% 55% 60% 65%
connectivity % of Population in Workforce (%)
+
Demonstrated growth in private consumption Large upside potential with low LCC penetration
Low air travel penetration (2012-2018e private consumption per Capita)
LCC
Seats /
8% 383 4,627 1,901 1,103 2,729 1,746 1,018 379 335
‘000
+ 7%
6.9% people
6% 45
Growing tourism industry 38.8
40
5%
35
28.8
4% # 30
+ 3.0% 2.9% aircraft /
25
25.9
3% million
2.0% people 20 14.9
Emergence of LCC as an 2% 1.6% 15
affordable option 9.5
1% 0.6% 10
4.7
5 1.7 2.6 2.1
- -
VN MY PH TH ID SG VN SG AU US UK MY TH ID PH
Large LCC market with
significant growth
opportunities
Source: EIU, CAPA, Euromonitor; Note: (1) Population size is proportional to size of country flag 5
Largest domestic airline in Vietnam, the fastest growing aviation market in Asia Pacific
1         Allowing air travel to become a more accessible and efficient
          mode of transportation

    Air travel is the most efficient means of transportation in Vietnam

           Travel is substantially faster and more efficient by air compared to bus and rail as a result of                                                                         Hanoi

           Vietnam’s terrain. For example, a flight from HCMC to Hanoi takes c.2 hours compared to
           c.34 – 35 hours for bus and rail                                                                                                                                                          Hai Phong

                                                                                                                                                                    Thanh Hoa
           As income levels rise and air fares decrease, people are expected to continue to switch from
           bus and rail to air travel                                                                                                                                       Vinh

           Low cost air travel has also made flying a viable option for the masses
                                                                                                                                                                                                        Dong Hoi

           With more than 40% of the population in the 25-59 years working class age band and
                                                                                                                                                                                                            Hue
           increasing inter-city travel demand as the national economy develops, air travel is expected                                                                                                            Da Nang

           to gain in popularity and prevalence over other modes of transport
                                                                                                                                                                                                                         Chu Lai

    Air travel is the most cost effective mode of transportation(1)                                                                                                                         Pleiku                              Quy Nhon

                                        HCMC – Hanoi                                              HCMC – Danang                                                                    Buon Ma Thuot
    Travel                                                                                                                                                                                                                   Tuy Hoa

    modes
                       Time (hrs)          Fare (VND)          Fare (USD)         Time (hrs)          Fare (VND)          Fare (USD)                                                         Da Lat                           Nha Trang

       (2)
    Air                    2:05              961,000                44(3)             1:20              615,000                28(4)
                                                                                                                                                         Phu Quoc
                                                                                                                                                                                                     HCMC
    Bus                   35:00              861,385                 39              15:30              405,458                 19

    Rail                  34:00             1,066,278                49              17:00              616,833                 28                                                       Can Tho

                                    stimulates airline travel and captures market share from other modes of transport such as bus and rail
                                                      due to the advantages of air travel vis-à-vis land transport

    Source: SAP Independent Industry Report, IMF; Note: (1) Bus and rail fares shown are based on average fares for travelling on 1 Mar 2016 and 1 Apr 2016, as of 1 Feb 2016; US$1:VND 21,890, (2) Airfare refers to average              6
    VietJet ticket base fares for FY2015, (3) Base airfare excludes other ancillary fee of USD8.3; total gross fare of USD52.3, (4) Base airfare excludes other ancillary fee of USD7.4; total gross fare of USD35.4
Largest domestic airline in Vietnam, the fastest growing aviation market in Asia Pacific
1
Domestic market leader with strong government support
“Viet Nam regards the private sector as a development force”
–Mr. Nguyen Xuan Phuc, Prime Minister
Largest airline in Vietnam by capacity(1) Key government incentives to support VietJet
70%
Air Transport
US$10.5bn commitment to develop airport infrastructure
across the country, increasing the number of operational
60% Masterplan
airports from 22 to 26 by 2020
50% 44.8%
39.6% Changes in regulations to support the airline industry
36.6%
40%
31.4% 31.4%
Reduction in
30% 24.7%
Fuel
Petrolimex Aviation JSC (Petrolimex Aviation) was permitted
17.8% to supply air fuel in August 2009, ending monopoly by
20% Supply
Skypec, a Vietnam Airlines owned company
Monopoly
10% Others
Only CAAV / MOT approval (as opposed to PM’s previously)
- would be required for the first-time transfer of shares to
2012 2013 2014 2015 2016 2017 Aug 18 Decree 92 on foreign shareholders, opening the door for investor
transfer of participation in airlines
Highly concentrated domestic markets, effectively a duopoly shares in
However, investment opportunities in Vietnamese airlines are
airlines to
limited as the remaining 3 airlines are state-owned
Vietnam domestic market share % air passenger volume(2) foreigner
Foreign ownership limit at 30% and largest shareholder must
be Vietnamese
2%
15%
Changes in regulations to support the airline industry
45% Historically Two other domestic airlines in the past went bankrupt
struggled (Mekong Air and Indochina Airlines) and their licenses have
airlines been withdrawn
Although the Government is open for new entrants, no new
38% airlines entered the market since 2011
Potential new
entrants No foreign airline is permitted to operate domestic routes,
Minimal foreign competition as no foreign airlines permitted to operate which allows local airlines like VJC to enjoy the growth of
domestic routes local market
Source: CAPA, SAP independent industry report; CAAV, Ministry of Transportation Republic of Indonesia, Civil Aviation Authority of the Philippines, Department of Civil Aviation (DCA) of Thailand, Axis Research Ltd. report 7
dated July 2015; Note: (1) Market share by capacity as of week commencing 31 Dec 2012, 30 Dec 2013, 29 Dec 2014, 28 Dec 2015, 26 Dec 2016, 25 Dec 2017 and 27 Aug 2018 respectively, (2) CAAV data: Passenger
Market share for H1 2018
Young fleet with large growing order book
2       Young, modern and fuel efficient fleet, driving lower
        maintenance & fuel cost in the long term

    Youngest fleet in APAC
    (average age of aircraft fleet)

                                                                                            Asia(1)                                       Europe / Middle East(1)

                                                                                     Average: 5.78 years                                    Average: 5.46 years

                                                                                                                                                                        7.10
                                                                                                                   6.40                                     6.70
                                                                                     5.73               6.00
                                                           5.01
                                                                                                                                           4.60
                                                                                                                               3.46
              2.75                    2.95

             FY2017                1H2018                  Cebu1
                                                        Airline                 AirAsia2
                                                                               Airline                 Indigo3
                                                                                                      Airline    Thai AA4
                                                                                                                 Airline    Air Arabia5
                                                                                                                            Airline        W!zz 6
                                                                                                                                          Airline         Ryan  Air7
                                                                                                                                                          Airline      easyJet
                                                                                                                                                                       Airline

                                                                                                                                                                                 8
    Source: Company Information; Note: (1) Based on latest reported financial year
Best-in-class cost structure with strong operational performance
3
Amongst the lowest unit costs in the world
CASK ex-fuel(1)
(USD cents / ASK)
Asia(2) Europe / Middle East(2)
Average: 2.62 Average: 3.19
4.81
3.04 2.86
2.73 2.83 2.65
2.43 2.32 2.38 2.45
1.87
FY2016 FY2017 1H2018 AirAsia Cebu Indigo Thai AA Ryan Air W!zz Air Arabia easyJet
Airline 1 Airline 2 Airline 3 Airline 4 Airline 5 Airline 6 Airline 7 Airline 8
There is still headroom for cost structure improvement to further decrease both CASK & CASK ex-fuel
A Advantages from major contracts B Key cost-reduction measures
The scale of VietJet’s contracts with major aircraft and engine manufacturers such as Airbus, Boeing, VietJet plans to operate ground handling services to
CFM and P&W result in greater bargaining power and more advantageous contracts reduce outsourcing and therefore ground handling costs
Advantages from large scale contracts include favorable deposit payments and payment terms and VietJet is in the process of upgrading its in-house
the advantageous contracts give VietJet a structural cost advantage by reducing the overall costs maintenance team which is expected to reduce costs for
associated with the acquisition, maintenance and operation of its aircraft – for instance, VietJet the company
benefits from training, technical and financial support and commitment from both Airbus and Boeing
Implement fuel savings programme by cooperating with
Large aircraft orders will result in lower cost of aircraft ownership and maintenance from 2015, and CFM and P&W
lower fuel costs as new, more fuel efficient aircraft enter fleet
Source: Company Information; Note: (1) CASK based on operating costs (excluding finance costs), (2) Based on latest reported financial year 9Best-in-class cost structure with strong operational performance
3
Highest RPK growth vs peers & consistently high load factor
Comparables
Asia(3) Europe / Middle East(3)
RPK: RPK: RPK: RPK:
9,690m 14,451m 20,585m 13,588m Average: 10.8% Average: 10.3%
82.1%
Growth (%)
RPK(1)
49.1%
42.5% 44.2%
25.5%
20.0%
12.9% 9.8% 10.0% 9.4%
0.4% (0.4%)
FY2015 FY2016 FY2017 1H2018 Indigo Thai AA AirAsia Cebu W!zz easyJet Ryan Air Air Arabia
Airline 1 Airline 2 Airline 3 Airline 4 Airline 5 Airline 6 Airline 7 Airline 8
Average: 86.9% Average: 89.5%
Load Factor(2) (%)
95.0%
92.6%
91.3%
Passenger
89.3% 89.0%
88.1% 88.2% 88.1% 87.4% 87.0%
84.0%
79.0%
AirAsia
Airline 1 Indigo2
Airline Thai AA
Airline 3 Cebu 4
Airline Ryan Air5 Airline
Airline easyJet6 W!zz 7 Airline
Airline Air Arabia
8
FY2015 FY2016 FY2017 1H2018
Source: Company Information; Note: (1) Revenue Passenger Kilometers: number of revenue-paying passengers aboard multiplied by the distance traveled, (2) Passenger load factor calculated based on total passengers 10
carried divided by total available seats, (3) Based on latest reported financial year3 Best-in-class cost structure with strong operational performance
Efficient financial and operational risk management
Fuel cost management and hedging
VietJet adopts a comprehensive fuel cost management program that include:
– Fuel efficient aircraft that can save up to 16% of consumption, plus fuel saving programs with support from Airbus and engine suppliers like CFM and P&W
– Optimal selection and operational control of vendors and refueling locations as well as sales contracts with pricing caps
Fuel hedging strategy has been developed and will be deployed by management anytime:
– Existing policy is to hedge 30% of annual consumption for 3-6 months
Stringent safety and security standards
IATA Operational Well-trained Aircraft
Safety Audit highly professional crew safety features
VietJet is the first airline in Vietnam, that has Cabin crew in-house training programs approved VietJet’s Aircraft are equipped with high tech
passed the IATA Operational Safety Audit by the CAAV and carried out by the VietJet safety equipment such as:
(“IOSA”) Training Center
– Instrument landing system (“ILS”) which
IOSA is a safety certification awarded by IATA Ground-handling employees trained in civil assists pilots in the approach and landing
following a highly comprehensive and stringent aviation regulations & emergency procedures
audit
– Global positioning system (“GPS”) which feeds
VietJet’s engineers trained by Airbus under a navigational information to pilots and to the
VietJet passed the internationally-recognized recurrent training program to ensure the fleet is control tower
audit program in April 2018 always flight worthy
– Traffic alert and collision avoidance system
With support from Airbus, VietJet‘s flight training (“TCAS”) which alerts pilots to potential mid-air
centre is able to host Airbus A320 Full-Flight collisions
Simulator (“FFS”) to conduct flight crew training
for its A320 family fleet
– Enhanced ground proximity warning system
(“EGPWS”) to help avoid collision with the
ground
In addition, VietJet also subscribes to various
third-party services to enhance its aircraft
communication and aircraft technical data
capture capabilities
11Excellent financial performance
4
Sustained growth in revenue and profitability
Total Revenue(1) Airline Revenue(2)
(VND bn)
(VND bn)
2015-2017 1H17-18
2015-2017 growth: 52.9%
CAGR: 46.0% CAGR: 43.4%
1H17-18
growth: 29.2%
Total Net Income(3) Airline Net Income(4)
2,000 1H17-18
2015-2017 1,817 growth: 19.9%
CAGR: 67%
1,800
1,600 1,416
2015-2017
1H17-18
CAGR: 108.2% 1,400
growth: 11.3% 1,186
1,200
989
1,000
800 651
600
400
200
-
FY15 FY16 FY17 1H17 1H18
Source: Company Information; (1) and (3): Consolidated Financial Statement; (2) and (4): Separate Financial Statement 12Excellent financial performance
4 Profitability exceeding that of most peers, with consistent
improvement in net margins
Comparables
Asia(2) Europe / Middle East(2)
VND 3,636bn VND 5,947bn VND 7,380bn VND 5,575bn Average: 28.4% Average: 26.7%
37.4%
32.8% 32.7% 33.7% 33.8%
31.8% 32.3%
Adj. EBITDAR
29.8%
Margin(1)
26.3% 26.8%
25.7%
14.0%
FY2015 FY2016 FY2017 1H2018 Cebu
Airline 1 Indigo
Airline 2 Thai AA
Airline 3 AirAsia4
Airline W!zz 5 Ryan
Airline AirlineAir
6 Air Arabia
Airline easyJet
7 Airline 8
Revenue growth mainly driven by Steady decline of CASK with
Steadily improving RASK minus
increases in passenger volume and economies of scale and stringent
CASK spread
ancillary revenue per passenger cost controls
Source: Company Information; Note: (1) All margins based on financials adjusted for gains/losses from the sales of aircraft and total revenue less proceeds from sales of aircraft (Net Income adjusted to net off share of loss in 13
associates), (2) Based on latest reported financial year4 Excellent financial performance
Robust balance sheet with improving credit metrics
Lease Adjusted Net Debt(1) / Equity Adjusted EBITDAR(2) / (Net Interest + Rent)
9.0x 2.5x
7.8x
8.0x
1.9x 1.9x
7.0x 2.0x
6.1x 1.7x
1.6x
6.0x
1.5x
5.0x
4.0x
1.0x
3.0x 2.5x
1.9x
2.0x 0.5x
1.0x
- -
FY2015 FY2016 FY2017 1H2018 FY2015 FY2016 FY2017 1H2018
Lease Adjusted Net Debt(1) / Adjusted EBITDAR(2) Cash and Cash Equivalents
(USD m)
6.0x
4.9x 350
5.0x 4.6x 306.0
4.1x 300
4.0x 3.5x 238.2
250
3.0x 200
150 123.7 118.2
2.0x
100
1.0x 42.2
50
- -
FY2015 FY2016 FY2017 1H2018 FY2015 FY2016 FY2017 1H2017 1H2018
Source: Company Information; Note: (1) Lease are capitalized using 7x annual lease rentals, (2) Adjusted for gains/losses from the sales of aircraft and total revenue less proceeds from sales of aircraft 14Significant ancillary revenue upside
5 Increase in Ancillary revenue per passenger, with potential
upside supported by digital opportunities
Comparables
Asia(2) Europe / Middle East(2)
Average: USD 10.40 Average: USD 19.43
per Passenger (USD)
Ancillary Revenue
32.01
18.00
14.27 15.16 15.81
12.14 11.41 12.78 11.50 11.89
10.27
7.07
FY2015 FY2016 FY2017 1H2018 Cebu
Airline 1 Thai AA
Airline AirAsia
2 Airline 3 Indigo4
Airline AirlineAir
W!zz 5 Ryan
Airline 6 easyJet7 Air
Airline Arabia
Airline 8
Average: 17.9% Average: 24.9%
Ancillary Revenue as
% of Adj. Revenue(1)
41.9%
28.2%
22.3% 22.3% 24.3% 23.0% 20.8% 20.0% 19.8% 19.5%
11.2% 10.0%
FY2015 FY2016 FY2017 1H2018 Thai AA
Airline AirAsia
1 Airline 2 Cebu3
Airline Indigo 4
Airline W!zz 5 Ryan
Airline Air6 easyJet
Airline Airline 7 Air Arabia
Airline 8
Pre-flight purchases Inflight sales of
such as seat selection, souvenirs, food
priority services, and beverage,
checked baggage, in duty free products
flight services and travel and advertising
insurance packages
Source: Company Information; Note: (1) Adj. Revenue refer to Total Revenue less proceeds from sales of aircraft, (2) Based on latest reported financial year 15Strong brand recognition
6 Prominent Brand recognised as Best Ultra Low-Cost Airline
in 2018
has a 96% brand awareness(1) in Vietnam with superior customer loyalty
A Prominent digital media presence enhancing awareness B Strong Brand Representation across various categories(2)
Strong on-line presence across e-commerce platforms and Inaugural winner of the Airlineratings.com Best Ultra Low-Cost
popular social media outlets Airline (2018)
Powerful omni-channel platform
Named as one of the world’s Top 3 fastest Top 100 Best places to work in Vietnam (2014-2017)
growing airline brands on Facebook by
Socialbakers in August 2015, together with Best Asian low Cost Carrier (TTG Travel Awards in 2015)
Qatar Airways and Turkish Airlines
Top 3 airlines globally in terms of
Top 40 most valuable Vietnamese brands (2018) by Forbe
Facebook’s post engagement rate (the
other 2 being Eva Air and Japan Airlines)
~3.1m users on Facebook (1H2018) Top 10 reputated development company in Vietnam (2018)
2.9m (1H2018) website visitors
7.8m views on YouTube (1H2018)
Top 50 listing company in Vietnam (2018)
C Highly innovative marketing campaigns D Blue-chip partners and co-branding
Strategic partnerships with blue-chip, multinational enterprises
Focus on communicating directly with potential customers and globally
emphasizing its low fares
Co-branding with various brands to enhance awareness,
Enhanced brand awareness through sponsorship of key local boosting ancillary revenue significantly through advertising
campaigns
Strategic partners Co-branding
Sponsor of the 2015
Southeast Asian
Games
Source: Company Information, Axis Research; Note: (1) Based on Axis Research Ltd. report dated July 2015, VietJet had 96% brand awareness in Vietnam based on a survey with 1,136 randomly selected participants from 16
13 cities in Vietnam (2) Sources: Factiva, Nielsen, Vietnam Economic TimesExperienced leadership team
7 Entrepreneurial and visionary management team
with a proven track record
Visionary, reputable and highly experienced leadership with over >20 years in managing diverse businesses, domestically and
internationally, have led VietJet to achieve consistent gain in market share since commencement
Number of years taken to achieve > 35% domestic market share or #1 domestic position
10 years(2) 11 years(1)
7 years(1)
4 years
Indigo Cebu Pacific AirAsia
Mdm. Nguyen Thi Phuong Thao
Mdm. Nguyen Thanh Ha Vice-Chairperson & CEO
Chairperson Appointed Standing Vice-Chairwoman of the Board of Directors in 2007 and is
Appointed Chairwoman of the Board in 2007 Company’s Chief Executive Officer
Extensive aviation industry experience in Vietnam Vice Standing Chairwoman of HDBank
Deputy Head of CAAV prior to joining the Company and was the head of Significant experience in the managing large corporations in various economic
Planning & Investment department at Vietnam Airlines before joining CAAV sectors in Vietnam and abroad, especially in the banking-finance sector
Dr. Nguyen Thanh Hung Mr. Luu Duc Khanh
Vice-Chairperson Managing Director
Appointed Vice Chairman of the Board of Directors in July 2007 Appointed Managing Director in 2011
Co-Founder and Chairman of Sovico Holdings Vice Chairman of HDB and Chairman of Vietnam Securities Investment Fund
Appointed ABAC (APEC Business Advisory Council) member by Prime 30 years of experience in management
Minister in 2006
(1) Number of years taken to achieve #1 domestic position in terms of market share since Indigo / AirAsia began commercial operations;
(2) Number of years taken to achieve 35% domestic market share since Cebu began commercial operations; It took Cebu 11 years to achieve #1 domestic position
17
Source: Company information, public filingsStrategic Plan
Strategy and future plans
Target to position Vietjet as a high profile “consumer airline”

                                           Increase depth and breadth of network, and focus on route profitability
                                                                                                                           Strengthen leadership position as a
                                           Grow high-volume, short- and medium-haul route network in Asia,
                                                                                                                           leading domestic carrier and grow
            Expand domestic and            increasing international network from 56 routes to 100 routes by end of
   1                                                                                                                       international traffic by adding more
            international network          2018(1)
                                                                                                                           short- and medium-haul routes
                                           Build franchise model with local partners and, if appropriate, join interline   within Asia
                                           agreements with other airlines

                                           Focus on ancillary revenue sales, particularly pre-flight and onboard
                                           purchases                                                                       This is a key strategy to make Vietjet
                                                                                                                           become a high profile “consumer
                                           Develop e-commerce solutions including tailored product packages,
            Drive ancillary revenue                                                                                        airline”. Increase proportion of high
   2                                       comprising a combination of banking, airline and retail products, and
            growth                                                                                                         margin ancillary services’ revenue
                                           create synergies to the whole group
                                                                                                                           stream in line with other leading
                                           Leverage insights and data from e-commerce sales to develop unique,             LCCs in the world
                                           tailored products

                                           Build on high brand awareness and establish a reputation for excellent          Continue to grow a loyal customer
            Strengthen the “VietJet”       customer service
   3                                                                                                                       base and strengthen financial
            brand
                                           Build on strong risk and safety management systems and reputation               performance

                                           Finance aircraft through a mix of sources
   4        Diversify sources of capital   Access international capital markets and build relationships with               Diversify funding platform
                                           international banks

Note: (1) Excluding charter services                                                                                                                        19
Strategy and future plans (Cont’d)
Target to position Vietjet as a high profile “consumer airline”
Increase aircraft utilization and actively manage fuel consumption and
hedging strategy
Focus on cost
VietJet is committed to operational safety with an emphasis on high tech Maintain leading position in lowest
management and
safety features and regular maintenance unit-costs and best-in-class
operational efficiency while
5 operational efficiency while retaining
maintaining high standards Strict compliance with local regulations, international standards and commitment to high standards of
of quality, safety and industry best practices quality, safety and security
security
Effectively manage inventory and labor force; fully leverage support from
aircraft and engine OEMs, starting from 2015
Enhance recruitment and training programs, continue to implement good
Build up international and
corporate culture and foster next generation
professional working environment,
6 Focus on human capital Continuously improve quality of training programs of VietJet Training
and encourage creativity and
Center and plans to implement VietJet Aviation Academy project as passion from staff
profit center model
Plans to grow its fleet with new, fuel-efficient aircraft from the Airbus
Expand and maintain a A320 and Boeing 737 families Optimize capacity, reduce cost per
7 young and fuel efficient seat and maintain competitive cost
More than 100 new aircraft to be delivered between 2019 and 2023
fleet advantage
Maintain a young, modern and fuel efficient fleet
Reduce operational costs, improve
Invest in domestic airport Partner with local investors to invest and lease rights to operate
8 route scheduling and enhance
passenger terminals terminals in key domestic hubs
passenger service
20Appendix
Income statement

Vietjet JSC
Incom e Statem ent
FYE 31 Decem ber, VND m unless stated otherw ise    Unit
                                                              VND m          VND m          VND m          VND m
                                                              FY2015         FY2016         FY2017         1H2018
Revenue                                            VND m    19,845,479    27,499,296     42,302,573     21,221,912
Cost of Sales                                      VND m   (17,735,540)   (23,597,459)   (35,753,176)   (18,223,404)
Gross Profit                                       VND m    2,109,939      3,901,837      6,549,397      2,998,509

Other Income                                       VND m     8,379          31,853          5,745         2,475
Selling Expenses                                   VND m   (317,844)      (517,790)      (578,783)      (319,741)
General and Administrative Expenses                VND m   (203,354)      (188,801)      (225,809)      (125,694)
Other Expenses                                     VND m      (140)          (55)          (1,554)         (63)
Operating Profit                                   VND m   1,596,979      3,227,044      5,748,996      2,555,485

Finance Income                                     VND m     153,677        144,656       118,684         137,235
Finance Costs                                      VND m    (561,567)      (653,949)      (520,765)      (493,502)
Net Finance Costs                                  VND m    (407,891)      (509,292)      (402,081)      (356,267)

Share of Losses in Associates                      VND m    (20,606)       (14,605)       (44,277)       (39,878)
Profit Before Tax                                  VND m   1,168,483      2,703,146      5,302,639      2,159,340

Income Tax Benefit/(Expense)                       VND m     2,149        (207,159)      (228,987)      (160,471)
Net Profit                                         VND m   1,170,632      2,495,987      5,073,651      1,998,869
Net Profit                                         USD m      50.2          107.1          217.7           85.8

Net Profit to Ow ners of Com pany                  VND m   1,170,253      2,495,640      5,073,364      1,998,784
Net Profit to Ow ners of Com pany                  USD m      50.2          107.1          217.7           85.8

                                                                                                                 22
Balance sheet
Vietjet JSC
Balance Sheet
FYE 31 Decem ber, VND m unless stated otherw ise Unit
VND m VND m VND m
FY2016 FY2017 1H2018
Cash and Cash Equivalents VND m 2,741,341 6,861,602 4,939,421
ST Investments VND m 1,400 1,400 1,327,400
Accounts Receivable - Short-term VND m 7,128,757 10,223,454 11,647,288
Inventories VND m 137,930 267,182 328,467
Other Current Assets VND m 304,038 315,007 361,002
Current Assets VND m 10,313,467 17,668,644 18,603,578
Accounts Receivable - Long-term VND m 5,104,774 7,152,674 8,062,465
Fixed Assets VND m 1,047,218 1,528,721 1,774,998
Other Long-term Assets VND m 3,597,242 5,308,226 5,794,523
Long-term Assets VND m 9,749,235 13,989,621 15,631,986
Total Assets VND m 20,062,702 31,658,265 34,235,564
Short-term Borrow ings VND m 6,102,387 6,897,227 6,959,882
Accounts Payable VND m 391,117 560,253 482,861
Advances from Customers VND m 306,909 456,356 581,423
Accrued Expenses VND m 492,497 1,366,768 1,642,913
Unearned Revenue VND m 1,306,837 1,964,462 1,963,444
Short-term Provisions VND m 1,243,689 1,467,013 1,180,052
Other Current Liabilities VND m 726,641 1,199,431 1,425,778
Current Liabilities VND m 10,570,077 13,911,511 14,236,354
Long-term Borrow ings VND m 694,840 626,905 601,701
Long-term Provisions VND m 3,963,855 6,364,465 7,434,192
Other Long-term Liabilities VND m 99,908 161,249 208,827
Long-term Liabilities VND m 4,758,603 7,152,620 8,244,719
Total Liabilities VND m 15,328,679 21,064,131 22,481,073
Share Capital VND m 3,000,000 4,513,433 4,513,433
Share Premium VND m - 245,949 245,949
Forex Differences VND m 29,673 23,916 88,090
Retained Earnings VND m 1,702,863 5,809,063 6,905,161
Equity Attributable to Ow ners of the Com pany VND m 4,732,536 10,592,361 11,752,633
Non-controlling Interests VND m 1,486 1,773 1,858
Total Equity VND m 4,734,022 10,594,135 11,754,491
Total Equity and Liabilities VND m 20,062,702 31,658,265 34,235,564
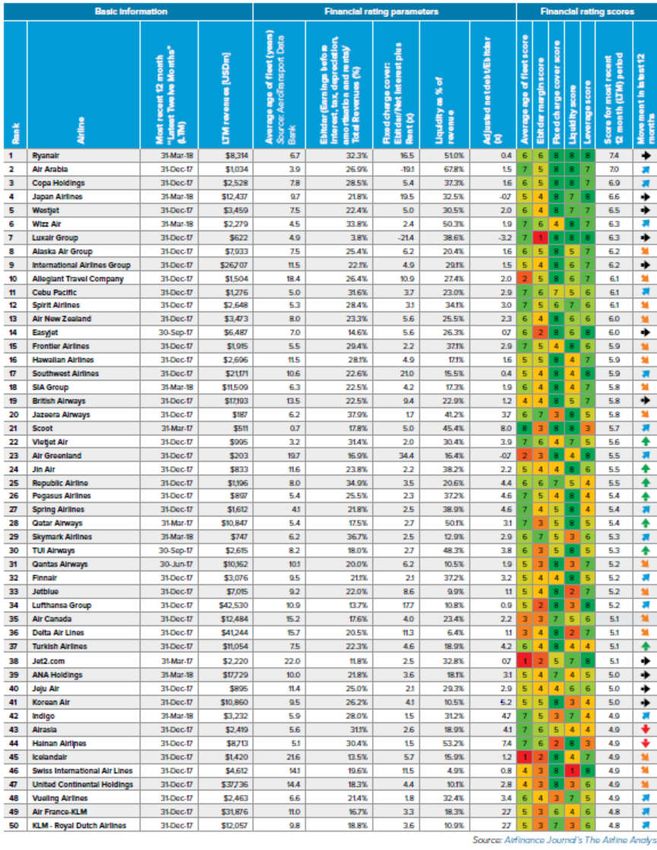
23Ranked #22 in the 2018 Airfinance Journal Airline Top 50
24Disclaimer
THIS PRESENTATION HAS BEEN PREPARED BY VIETJET AVIATION JOINT STOCK COMPANY (THE “COMPANY”) SOLELY FOR YOUR INFORMATION AND FOR USE AT THE PRESENTATION
BY THE COMPANY AND HAS NOT BEEN INDEPENDENTLY VERIFIED. THIS PRESENTATION IS BEING COMMUNICATED ONLY TO PERSONS WHO HAVE PROFESSIONAL EXPERIENCE IN
MATTERS RELATING TO INVESTMENTS AND TO PERSONS TO WHOM IT MAY BE LAWFUL TO COMMUNICATE IT TO (ALL SUCH PERSONS BEING REFERRED TO AS RELEVANT PERSONS).
THE DISTRIBUTION OF THIS PRESENTATION IN CERTAIN JURISDICTIONS MAY BE RESTRICTED BY LAW, AND PERSONS INTO WHOSE POSSESSION THIS PRESENTATION COMES SHOULD
INFORM THEMSELVES ABOUT, AND OBSERVE ANY, SUCH RESTRICTIONS. ANY FAILURE TO COMPLY WITH THESE RESTRICTIONS MAY CONSTITUTE A VIOLATION OF LAWS OF ANY
SUCH JURISDICTION. THIS PRESENTATION MAY NOT BE REPRODUCED, REDISTRIBUTED OR PASSED ON, DIRECTLY OR INDIRECTLY, TO ANY OTHER PERSON OR PUBLISHED, IN WHOLE
OR IN PART, BY ANY MEDIUM OR FOR ANY PURPOSE. “PRESENTATION” MEANS THIS DOCUMENT, ANY ORAL PRESENTATION, THE QUESTION AND ANSWER SESSION AND ANY WRITTEN
OR ORAL MATERIAL DISCUSSED OR DISTRIBUTED AT THE MEETING WHERE THIS PRESENTATION IS MADE. BY ATTENDING SUCH MEETING, OR BY ACCEPTING A COPY OF THIS
PRESENTATION, YOU ACKNOWLEDGE AND AGREE TO BE BOUND BY THE FOLLOWING LIMITATIONS AND (1) WILL HOLD IN CONFIDENCE THE INFORMATION CONTAINED HEREIN; (2) WILL
NOT DISTRIBUTE OR REPRODUCE THIS PRESENTATION, IN WHOLE OR IN PART; (3) ARE (A) OUTSIDE THE UNITED STATES, (B) ACCUSTOMED TO RECEIVING THE TYPE OF INFORMATION
CONTAINED IN THIS PRESENTATION AND (C) A PERSON INTO WHOSE POSSESSION THIS PRESENTATION MAY BE LAWFULLY DELIVERED IN ACCORDANCE WITH THE LAWS OF THE
JURISDICTION IN WHICH IT IS LOCATED.
THIS PRESENTATION DOES NOT CONSTITUTE A PROSPECTUS OR FORM PART OF ANY OFFER OR INVITATION TO SELL OR ISSUE, OR ANY SOLICITATION OF ANY OFFER TO PURCHASE
OR SUBSCRIBE FOR, OR ANY OFFER TO UNDERWRITE OR OTHERWISE ACQUIRE ANY SHARES IN THE COMPANY OR ANY OTHER SECURITIES IN THE UNITED STATES, AUSTRALIA,
CANADA, JAPAN OR ANY OTHER JURISDICTIONS, NOR SHALL THIS PRESENTATION OR ANY PART OF IT NOR THE FACT OF ITS DISTRIBUTION OR COMMUNICATION FORM THE BASIS OF,
OR BE RELIED ON IN CONNECTION WITH, ANY CONTRACT, COMMITMENT OR INVESTMENT DECISION IN RELATION THERETO, NOR DOES IT CONSTITUTE A RECOMMENDATION
REGARDING THE SECURITIES OF THE COMPANY. ANY DECISION TO PURCHASE SECURITIES IN ANY OFFERING OF SECURITIES OF THE COMPANY SHOULD BE MADE SOLELY ON THE
BASIS OF THE INFORMATION CONTAINED IN THE PROSPECTUS DISTRIBUTED IN CONNECTION WITH ANY OFFERING OF SECURITIES OF THE COMPANY.
NO REPRESENTATION OR WARRANTY, EXPRESS OR IMPLIED, IS GIVEN AS TO THE ACCURACY, FAIRNESS OR COMPLETENESS OF THE INFORMATION OR OPINIONS CONTAINED IN THIS
PRESENTATION, AND NO LIABILITY IS ACCEPTED FOR ANY SUCH INFORMATION OR OPINIONS BY THE COMPANY OR ANY OF ITS AFFILIATES, DIRECTORS, MEMBERS, OFFICERS,
EMPLOYEES, AGENTS OR ADVISERS, OR ANY OF THEIR RESPECTIVE DIRECTORS, MEMBERS, OFFICERS, EMPLOYEES, AGENTS OR ADIVSERS. THIS PRESENTATION CONTAINS
INFORMATION ABOUT THE MARKETS IN WHICH THE COMPANY COMPETES, INCLUDING MARKET GROWTH, MARKET SIZE AND MARKET SEGMENT SIZES, MARKET SHARE INFORMATION
AND INFORMATION ON THE COMPANY'S COMPETITIVE POSITION. THIS INFORMATION HAS NOT BEEN VERIFIED BY INDEPENDENT EXPERTS OR ASSEMBLED COLLECTIVELY AND IS
SUBJECT TO CHANGE, AND THERE IS NO GUARANTEE THAT THE INFORMATION CONTAINED IN THIS PRESENTATION IS ACCURATE OR COMPLETE AND NOT MISLEADING NOR THAT THE
COMPANY'S DEFINITION OF ITS MARKETS IS ACCURATE OR COMPLETE AND NOT MISLEADING. THE INFORMATION INCLUDED IN THIS PRESENTATION IS CURRENT AS OF THE DATE
HEREOF AND IS SUBJECT TO UPDATING, COMPLETION, REVISION AND AMENDMENT, AND SUCH INFORMATION MAY CHANGE MATERIALLY. NO PERSON IS UNDER ANY OBLIGATION TO
UPDATE OR KEEP CURRENT THE INFORMATION CONTAINED IN THE PRESENTATION, AND ANY OPINIONS EXPRESSED IN RELATION THERETO ARE SUBJECT TO CHANGE WITHOUT
NOTICE. THIS PRESENTATION SHOULD NOT BE CONSTRUED AS LEGAL, TAX INVESTMENT OR OTHER ADVICE.
THIS PRESENTATION INCLUDES FORWARD-LOOKING STATEMENTS THAT REFLECT THE COMPANY'S INTENTIONS, BELIEFS OR CURRENT EXPECTATIONS. FORWARD-LOOKING
STATEMENTS INVOLVE ALL MATTERS THAT ARE NOT HISTORICAL FACT. FORWARD-LOOKING STATEMENTS CAN BE IDENTIFIED BY THE USE OF WORDS INCLUDING “MAY”, “WILL”,
“WOULD”, “SHOULD”, “EXPECT”, “INTEND”, “ESTIMATE”, “ANTICIPATE”, “PROJECT”, “BELIEVE”, “SEEK”, “PLAN”, “PREDICT”, “CONTINUE” AND SIMILAR EXPRESSIONS OR THEIR NEGATIVES.
SUCH STATEMENTS ARE MADE ON THE BASIS OF ASSUMPTIONS AND EXPECTATIONS WHICH, ALTHOUGH THE COMPANY BELIEVES THEM TO BE REASONABLE AT THIS TIME, MAY
PROVE TO BE ERRONEOUS. FORWARD-LOOKING STATEMENTS ARE SUBJECT TO RISKS, UNCERTAINTIES AND ASSUMPTIONS AND OTHER FACTORS THAT COULD CAUSE THE
COMPANY'S ACTUAL RESULTS OF OPERATIONS, FINANCIAL CONDITION, LIQUIDITY, PERFORMANCE, PROSPECTS OR OPPORTUNITIES, AS WELL AS THOSE OF THE MARKETS IT SERVES
OR INTENDS TO SERVE, TO DIFFER MATERIALLY FROM THOSE EXPRESSED IN, OR SUGGESTED BY, THESE FORWARD-LOOKING STATEMENTS. IMPORTANT FACTORS THAT COULD
CAUSE THOSE DIFFERENCES INCLUDE, BUT ARE NOT LIMITED TO: CHANGING BUSINESS OR OTHER MARKET CONDITIONS, GENERAL ECONOMIC CONDITIONS IN VIETNAM AND
ELSEWHERE, AND THE COMPANY'S ABILITY TO RESPOND TO TRENDS IN ITS INDUSTRY. ADDITIONAL FACTORS COULD CAUSE ACTUAL RESULTS, PERFORMANCE OR ACHIEVEMENTS
TO DIFFER MATERIALLY. THE COMPANY, ITS ADVISORS AND EACH OF THEIR RESPECTIVE DIRECTORS, OFFICERS, EMPLOYEES AND ADVISORS EXPRESSLY DISCLAIM ANY OBLIGATION
OR UNDERTAKING TO RELEASE ANY UPDATE OF OR REVISIONS TO ANY FORWARD-LOOKING STATEMENTS IN THIS PRESENTATION, AND ANY CHANGE IN THE COMPANY’S
EXPECTATIONS OR ANY CHANGE IN EVENTS, CONDITIONS OR CIRCUMSTANCES ON WHICH THESE FORWARD-LOOKING STATEMENTS ARE BASED, EXCEPT AS REQUIRED BY
APPLICABLE LAW OR REGULATION.
THIS PRESENTATION IS HIGHLY CONFIDENTIAL AND CONTAINS PROPRIETARY AND CONFIDENTIAL INFORMATION ABOUT THE COMPANY. THIS PRESENTATION MATERIAL IS BEING
PRESENTED SOLELY FOR YOUR INFORMATION AND MAY NOT BE COPIED, REPRODUCED OR REDISTRIBUTED TO ANY OTHER PERSON IN ANY MANNER.
25You can also read