Methanex Investor Presentation - February 2016 1 - Methanex Corporation
←
→
Page content transcription
If your browser does not render page correctly, please read the page content below
Methanex Investor Presentation
February 2016

                                 1
Forward‐looking Statements & Non‐GAAP Measures

Information contained in these materials or presented orally on the earnings conference call,
either in prepared remarks or in response to questions, contains forward‐looking statements.
Actual results could differ materially from those contemplated by the forward‐looking
statements. For more information, we direct you to our 2014 Annual MD&A and our fourth
quarter 2015 MD&A, as well as slide 30 of this presentation.

This presentation also contains certain non‐GAAP financial measures that do not have any
standardized meaning and therefore are unlikely to be comparable to similar measures
presented by other companies. For more information regarding these non‐GAAP measures,
please see our 2014 Annual MD&A and our fourth quarter 2015 MD&A.

                                                                                                2 2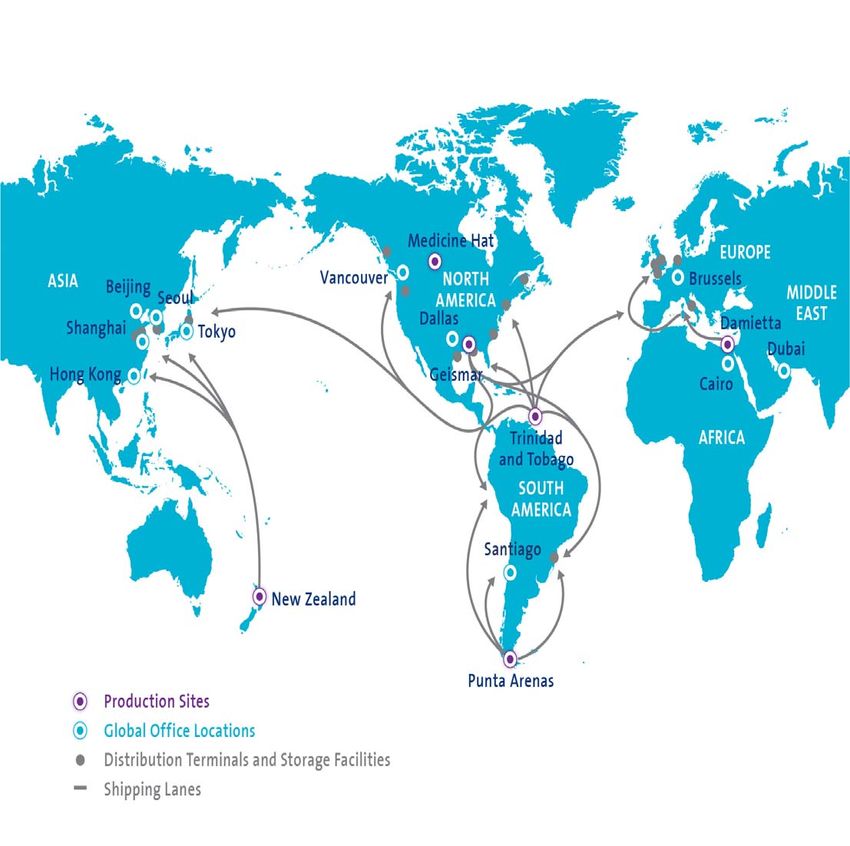
Methanex ‐ Investment Opportunity

  Global Methanol     •   Leading market share
      Leader          •   Competitive assets

                      •   Solid growth in cash generation capability
 Strong Cash Flow     •   5% normal course issuer bid started May 6, 2015
   Generation &       •   ~47% of shares bought back since 2000
   Distributions      •   Dividend raised 11 times since implemented 2002; $1.10/share

 Positive Long‐term   •   Healthy demand growth outlook
  Industry Outlook    •   Limited new supply

      Growth          •   Production: Chile
     Potential        •   Market: Demand growth into energy applications & MTO

       Value          •   Trading at a significant discount to replacement cost

                                                                                         3 3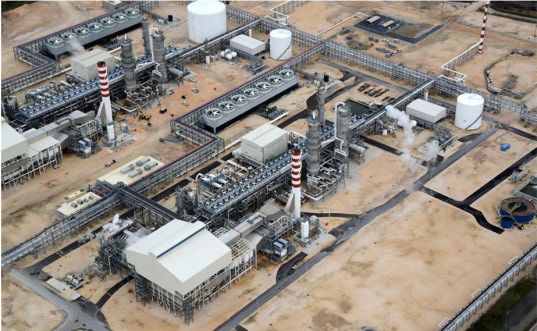
Investment Opportunity:
Leverage to Oil Recovery with Downside Protection

  60% capacity         •   Three million tonnes in capacity additions over last three years
growth in 3 years      •   New capacity growth positioned in OECD countries, reducing risk

                       •   Gas contract structure reduces costs at low methanol prices
 Responsive cost
                       •   Shipping costs benefit from lower fuel prices
    structure
                       •   Flexible global supply chain allows agility in serving customers

 Strong demand         •   Approx. six million tonnes annualized latent demand in Q4, 2015.
upside at higher oil   •   Estimated 7% CAGR over next four years with upside potential at
      prices               higher oil prices

  Methanol cost        •   Current methanol pricing estimated to be below marginal cash
  curve serves as          cost. Expect eventual supply rationalization in a sustained low
       floor               price environment.

                       •   Strong balance sheet
  Solid Liquidity
                       •   Limited near‐term commitments for cash
     Position
                       •   Undrawn $400 million credit facility
                                                                                              4 4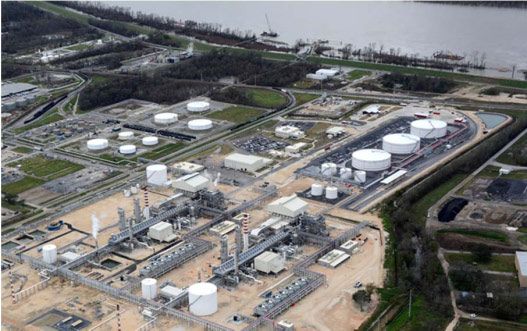
Industry Overview

• ~62 million tonnes
  annual global demand1
• Top producers account
  for ~ half of global sales
• Next largest
  competitors are not
  materially expanding
  their methanol
  investments in the near
  term
• Methanex is the global
  leader
  • ~14% market share2
  • Unique global                                           Source: Methanex
     position with sales in
     all major regions
1   Estimated annualized demand as at Q4, 2015 (excluding integrated methanol to olefins (MTO) demand). Source: Methanex
2   Global market share is Methanex’s share of total methanol sales excluding methanol consumed by integrated MTO producers. Source: Methanex

                                                                                                                                                5 5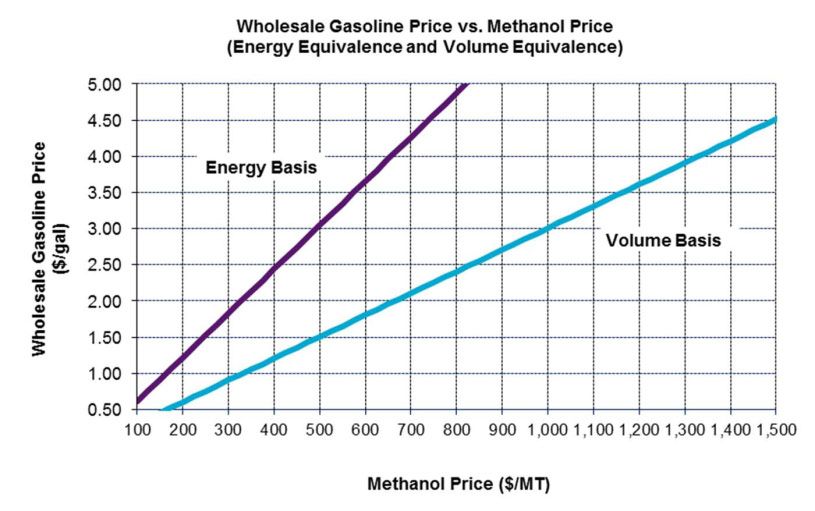
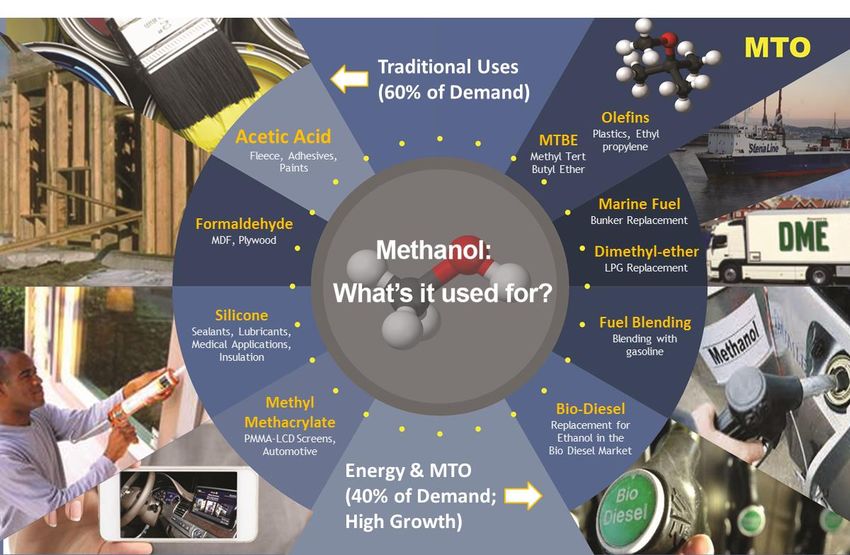
Industry Overview
Methanol End Uses

                    6 6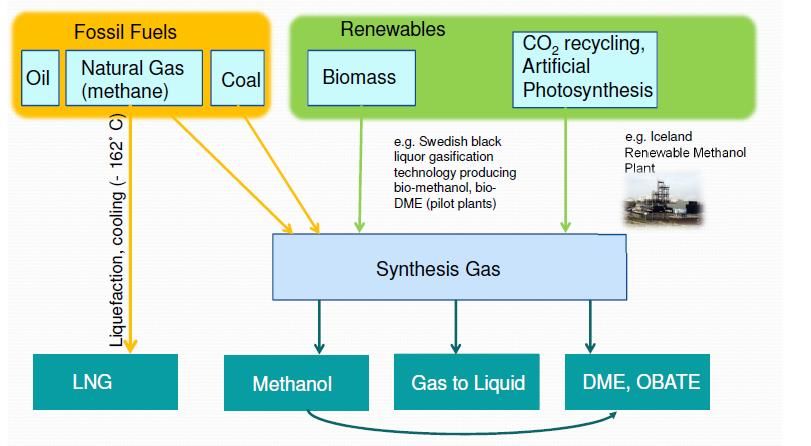
Industry Overview
Strong Demand Growth
• Projected 7% CAGR (20 million tonnes over four years), led by MTO
                                                                                             2016 – 2019 CAGR: 7%

  (000s tonnes)
      100,000                          2006 – 2015 CAGR: 7%
       90,000
       80,000
       70,000
       60,000
       50,000
       40,000
       30,000
       20,000
       10,000
            0
                  2005   2006   2007    2008   2009   2010   2011   2012   2013   2014   2015 2016E 2017E 2018E 2019E

                   Chemical               MTBE/TAME                 Fuel            DME            MTO/MTP (Merchant)

  Source: IHS Chemical, Chemical Supply and Demand Balance 2016. Excludes integrated methanol
          demand for methanol to olefins and propylene.

                                                                                                                        7 7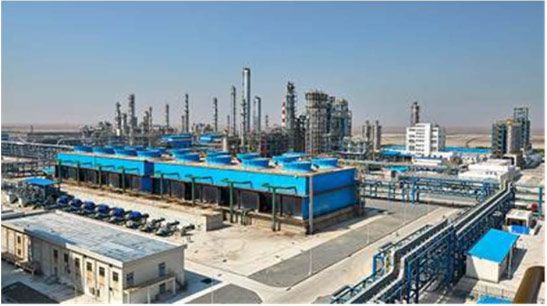
Industry Overview
Demand / Supply Balance

• Demand expected to outpace
  new supply over next several
  years, particularly in 2016‐17
  with new MTO capacity
• Forecast MTO demand growth
  based on plants currently under
  construction. Expect operating
  rates will depend on methanol
  affordability
• Expect supply gap will be filled
  through a combination of
  higher operating rates for
                                     * Celanese 1.3, OCI 1.8; G2X 1.4; Iran 2.5; Russia 0.9; Other 0.2
  existing higher cost China
  plants, or lower demand            Sources:
                                     Demand: IHS Chemical, “Chemical Supply and Demand Balance Update
                                               2016”. Excludes demand from upstream integrated coal‐to‐olefins plants.
                                               See slide 11 for underlying oil price assumptions
                                     Capacity: Methanex. “Other” is net of expected shut‐ins outside China of
                                               approximately 0.8 million tonnes.

                                                                                                                         8 8
Industry Review
Reinvestment Economics
                         Estimated Nominal IRR at Alternative Methanol and Gas Prices

                               Natural gas                        Realized Methanol Price ‐ $/tonne
                                $/mmbtu                         300        350        400         450
                                  5.0                                       2%        7%          11%
                                  4.0                           0%          6%       10%          14%
                                  3.0                           4%          9%       13%          16%
                                  2.0                           8%         12%       15%          18%

    Key Assumptions: Replacement cost of $1,140 based on average published estimates for the OCI 1.75 million MT Natgasoline project ($2.0 billion ), and G2X
                     Lake Charles 1.4 million MT plant ($1.6 billion). Maintenance capital $10 million/yr, freight $80/tonne (US to Asia), 30% tax rate, 2% inflation
                     Source: Methanex

•     New North America industry supply additions challenged today by:
       • Methanol price outlook vs return requirements
       • Capital cost pressure and uncertainty
       • Increased economic risk on key variables (capital, gas)
•     A number of new projects under discussion, but limited committed capital

                                                                                                                                                                        9 9
Methanol Industry Cost Curve

                                                     Coastal China, Russia Exports,
                                                     E. Europe, Netherlands, India,
                                                     Other South America

                                                    Inland China Coal, New Zealand,
                                                    SE Asia, North America, Trinidad,
                                                    Africa, Middle East, Venezuela
                                                      Source: Methanex

• Cost curve remains steep at the high end, but has flattened in the mid‐range in
  the current lower energy price environment
• High‐end set today primarily by China coal based production, some natural gas

                                                                                        1010
Energy Applications
Methanol value proposition
• Methanol is primarily
made from natural gas,
and is a liquid fuel and oil
product substitute
• High priced oil versus
natural gas creates
substitution incentive
• Energy applications
emerged post 2008 when
the ratio of oil $/bbl and
natural gas $/mmbtu
prices exceeded 15:1
Source: Historical annual data and forecast from IHS Chemical, January, 2016
1111Methanol‐to‐Olefins (MTO) / Methanol‐to‐Propylene (MTP)
Natural Gas Coal Ethylene
Petroleum Residues Oxides (EO)
Synthesis High Purity MEG
Gas Ethylene
Production
Acrylic Acid
(AA)
Methanol to
Methanol Olefins
Production
ACN
High Purity
Propylene Propylene
Oxide
Ningbo Skyford’s 1.8 MMT merchant methanol to 0.6 MMT olefins plant
PE
• MTO is a fast growing oil product substitution opportunity
• Two main pathways
• Upstream Integrated (CTO) – olefins produced directly from coal, methanol an intermediate step
• Merchant (MTO/MTP) – methanol purchased from external suppliers
• China merchant MTO capacity is well established and still growing strongly
1212MTO/MTP Demand Leading Growth
Methanol
Estimated Number Demand
Start‐up of Plants Capacity*
(million MT)
Completed 12 12.0
2016 4 6.6
Total 16 18.6
Nanjing Wison’s 0.8 MMT merchant
*Capacity at 100% operating rates methanol to 0.3 MMT olefins plant
• 12 merchant plants today, potential methanol demand approx. 12 million MT
• 4 more plants under construction expected to start up in 2016, incremental
demand potential over 6.5 million MT
• 2015 combined MTO/MTP operating rate approximately 60%, or 70% excl. MTP
Source: Methanex
1313Sustaining Methanol Demand Growth into MTO
• MTO leading methanol demand growth with upside potential based on installed capacity
• Methanol demand from MTO is poised to grow upon olefin price recovery
1414Energy Applications
China Fuel Demand Growth Expected to Continue
Local Methanol Gasoline Implemented
Province
Standards Since
Gansu M15 & M30 2009
Guizhou M15 2010
Hebei M15 & M30 2010
Heilongjiang M15 2005
Jiangsu M45 2009
Liaoning M15 2006
Shaanxi M15 & M25 2004
Shandong M15 2012
Shanghai M100 2013
Shanxi M5, M15, M85 & M100 2008
Sichuan M10 2004
Xinjiang M15 & M30 2007
Zhejiang M15, M30 & M50 2009
Ningxia M15 & M30 2014
1515Emerging Markets
Marine Fuel Industry Transitioning to Cleaner Fuels
• 100,000+ commercial vessels moving around the world every day primarily operating on
Heavy Fuel Oil (HFO)*
• HFO has high sulphur – negative impact on air quality / health. Methanol is sulphur free.
• Sulphur emissions from 5 large container ships > Emissions from all cars in the U.S. (11,000 tpa sulphur)
• N. Europe and N. America reduced
allowable limited sulphur emissions
to 0.1% starting Jan ’15 which
precludes Heavy Fuel Oil. In 2020,
IMO is targeting all marine fuels
globally to be less than 0.5% sulphur.
• 40 MMTPA methanol equivalent
market in Northern Europe Sulphur
Emissions Control Area alone
*Source: Distribution Consulting Services, Inc
1616Methanex
Production Capacity
Annual Chile USA (Geismar)*
Year Production
Built Capacity
(000 tonnes)
Chile I, IV 1988 / 2005 1,720
Louisiana, USA
Geismar 1 2015 1,050
Geismar 2 2015 1,000 New Zealand Trinidad
Egypt (50%) 2011 630
Medicine Hat, Alberta 1981 600
New Zealand
1
Motunui 1 1985 950
1
Motunui 2 1985 950
Canada (Medicine Hat) Egypt
Waitara Valley 1983 530
Trinidad
Titan 2000 875
Atlas (63%) 2004 1,125
TOTAL 9,430
1Potential total capacity for Motunui plants is 1.7 to 1.9 * Photo courtesy of Aerophoto
million tonnes depending on natural gas composition
1717Methanex
Global Supply Chain
1818Methanex
Operating Capacity Growth 2012‐2015
• Methanex added three million tonnes of operating capacity over three years
• New growth concentrated in OECD countries, reducing risk profile of asset portfolio
• Future potential from Chile with additional gas and minimal capital investment
1919Growth
Geismar Project Complete
• Geismar 1 completed on schedule; producing more than 3,000 tonnes /day
• Geismar 2 achieved first methanol December 27, 2015; running at high rates
• Committed gas feedstock & transport
• Capital and schedule savings versus greenfield projects
• Potential to optimize site with third plant using oxygen technology
Completed Geismar 2 plant in operation* Geismar 1 and 2 twin plants and storage terminal*
* Photos courtesy of Aerophoto
2020Growth
Chile – Potential Sources of Upside
• First prize: two‐plant operation in Chile, supported by
• Chile gas:
• Ongoing unconventional gas exploration and development in Chile
• ENAP estimates G7 formation in the western area of the Magallanes to
have close to 3.5 TCF of gas resources
• In July ’15 the Arenal block of the G7 reached production of one million
cubic meters / day, or 2/3 of the winter consumption of gas in the region
• Argentina gas
• Argentina shale gas (EIA estimates over 500 tcf in the country)
• November ’15 election of business friendly Mauricio Macri a strong
supporter of upstream
• Legal disputes related to gas contracts
• Arbitration underway with one supplier for non‐delivery of Argentine gas
• Reached settlement in May 2014 with Total Austral for $42 million to settle all
claims as well as to terminate the gas supply agreement
2121Impressive Financial Results over Cycle
• Average Modified ROCE of 14.5% from 2006‐2015
$7.00 Adjusted EPS 50%
$6.00 Modified ROCE
Modified ROCE
Adjusted EPS
40%
$5.00
$4.00 30%
$3.00 20%
$2.00
10%
$1.00
$0.00 0%
2006 2007 2008 2009 2010 2011 2012 2013 2014 2015
1) Adjusted EPS = Adjusted net income per common share attributable to Methanex shareholders (excludes the after-tax mark-to-market impact of share-based compensation and the impact of certain items associated with specific identified events
2) Modified ROCE = Adjusted net income before after-tax finance costs (after-tax) divided by average productive capital employed. Average productive capital employed is the sum of average total assets (excluding plants under production) less the average of
current non-interest-bearing liabilities).
3) Adjusted Net income, Adjusted EPS and Modified ROCE are non-GAAP measures - for more information regarding this non-GAAP measure, please see our 2014 annual MD&A and our fourth quarter, 2015 MD&A.
2222Valuation Considerations
• Methanex is trading at a significant discount to replacement cost
millions of tonnes 1 Operating
Capacity Some perspective on current enterprise value…
USA (Geismar) 2.0 "What if Geismar and Medicine Hat were valued at least
Canada (Medicine Hat) 0.6 estimated replacement cost 4 of $1,140/tonne?"
New Zealand 2.4 Capacity Enterprise Value
Trinidad 2.0 millions of tonnes $billions $/tonne
Chile 0.4 North America Assets 2.6 $3.0 $1,140
Egypt 0.6 Other Jurisdictions 5.4 $0.4 $80
Total Capacity 8.0 Total Enterprise Value: 8.0 $3.4 $420
Enterprise Value ($billions) 2 3.4 "Implies the market is paying no more than $80 per tonne
Enterprise Value/Tonne 3 420 for the remaining 5.4 million tonnes of operating capacity"
1
Methanex ownership interest
2
Based on share price of US$25 and net debt adjusted for 50% interest in Egypt Project and 63.1% interest in Atlas project
3
Figures do not give any value for: idle Chile capacity, Waterfront Shipping and Marketing/Franchise
4
Replacement cost of $1,140 based on average recently published estimates from the OCI Natgasoline project ($2.0 billion for 1.75 billion plant) and G2X Lake Charles ($1.6 billion for 1.4 million MT plant)
2323Valuation Considerations
• Strong cash generation capability at a range of methanol prices
1 Methanex ownership interest (63.1%
With Egypt & Full Operating Full Potential
Atlas, 50% Egypt)
Trinidad Restrictions2 Capacity3 (Chile 100%)
2 Assumed operating rate 100% except
1
Annual Operating Capacity 7.4 8.0 9.3 Trinidad (85%), Egypt (50%), and Chile
(millions of tonnes)
(40% of one plant). We cannot predict
Avg Realized Price ($/MT) Adjusted EBITDA Capability ($ billions)4 actual gas restrictions at these plants.
$300 0.6 0.7 0.7 3 Includes full nameplate capacity except
$350 0.8 0.9 1.0 Chile (40% of one plant).
4 Adjusted EBITDA reflects Methanex's
$400 1.0 1.1 1.3
proportionate ownership interest and
Free Cash Flow Capability ($ billions)5 assumes plants operate at full
production rates except where
$300 0.3 0.4 0.4 indicated
$350 0.5 0.6 0.7 5 After cash interest, maintenance capital
$400 0.7 0.8 0.9 of approximately $80 million, cash
taxes, debt service and other cash
Free Cash Flow Yield Capability %6 payments
$300 13% 18% 18% 6 Based on 90 million weighted average
$350 21% 26% 29% diluted shares for Q4, 2015 and share
$400 30% 35% 40% price of US$25/share
2424EBITDA and Cash Flow Capability Sensitivities
Assumptions: Capability:
• Price: $350/tonne ARP • EBITDA: $0.9 Billion
• Volume: 8.0 million tonnes • Free Cash Flow: $600 million
2525Liquidity & Capex Outlook
• Strong financial and liquidity position
Debt & Liquidity at Dec 31, 20151
(US$ millions)
Liquidity
Cash 241
Undrawn Operator (Dec '19) 400
641
Estimated 2016 Capital Expenditures 80
Net Liquidity 561
Total Debt 1,360
Total Debt / Capitalization 44%
Net Debt / Capitalization 39%
Net Debt / Enterprise Value2 33%
1
Includes Methanex share of debt and cash for joint ventures
2
Based on stock price of US$25/share
2626Capital Allocation
Balanced Approach
Debt • $85 million annual interest expense
Service • $20 million principal (share of Egypt)
Essential • Next $350 MM bond matures end 2019
• $80 million 2016 total capex
Maintenance
Meaningful, • Dividend $1.10/share annually
Sustainable, • Approx. $100 million per annum
Priority Growing • Yield ~4.4% at US$25 share price
• “Meaningful” range of 1.5%‐2.5%
Dividend
• 4.6 million NCIB 35% complete
Share
• Excess cash expected to be limited at
Buybacks
Discretionary current methanol pricing
• Investment in value accretive projects
Growth Capital with strict return targets
2727Capital Allocation
Returning Cash to Shareholders
• Meaningful, sustainable and growing dividend ‐ $0.275/share per quarter, current yield ~4.4%1
• ~47% of shares bought back since 2000
• Current 4.6 million share normal course issuer bid (5% of public float) expires May 6, 2016
• Approximately $240 million returned to shareholders in 2015
$1.20 180
Regular Dividends per Share
Shares Outstanding (millions)
Regular Annual Dividend (US$)
$1.00 Weighted Avg Shares Outstanding 160
$0.80
140
$0.60
120
$0.40
$0.20 100
$0.00 80
2000 2001 2002 2003 2004 2005 2006 2007 2008 2009 2010 2011 2012 2013 2014 2015
1 Assumes a share price of US$25/share
2828Summary
• Well positioned to navigate current environment
• Strong leverage to increase in methanol pricing
• Global leader with competitive assets
• Solid franchise value that is difficult to replicate
• Global marketing, supply chain and shipping network
• Strong cash generation capability & financial position
• Attractively valued with considerable upside potential
• Track record of delivering value creating growth projects
• Company growth potential
• Distributions / share buybacks
Well‐Positioned for Increased Returns to Shareholders
2929Forward‐looking Statements
FORWARD‐LOOKING INFORMATION WARNING
This Presentation, our Fourth Quarter 2015 Management’s Discussion and Analysis (“MD&A”) and comments made during the Fourth Quarter 2015 investor conference call contain forward‐looking
statements with respect to us and our industry. These statements relate to future events or our future performance. All statements other than statements of historical fact are forward‐looking
statements. Statements that include the words “believes,” “expects,” “may,” “will,” “should,” “potential,” “estimates,” “anticipates,” “aim,” “goal” or other comparable terminology and similar
statements of a future or forward‐looking nature identify forward‐looking statements. More particularly and without limitation, any statements regarding the following are forward‐looking
statements: expected demand for methanol and its derivatives; expected new methanol supply or restart of idled capacity and timing for start‐up of the same; expected shutdowns (either temporary
or permanent) or restarts of existing methanol supply (including our own facilities), including, without limitation, the timing and length of planned maintenance outages; expected methanol and
energy prices; expected levels of methanol purchases from traders or other third parties; expected levels, timing and availability of economically priced natural gas supply to each of our plants; capital
committed by third parties towards future natural gas exploration and development in the vicinity of our plants; our expected capital expenditures, anticipated operating rates of our plants, expected
operating costs, including natural gas feedstock costs and logistics costs; expected tax rates or resolutions to tax disputes; expected cash flows, earnings capability and share price; availability of
committed credit facilities and other financing; our ability to meet covenants or obtain or continue to obtain waivers associated with our long‐term debt obligations, including, without limitation, the
Egypt limited recourse debt facilities that have conditions associated with the payment of cash or other distributions and the finalization of certain land title registrations and related mortgages which
require actions by Egyptian governmental entities; expected impact on our results of operations in Egypt or our financial condition as a consequence of civil unrest or actions taken or inaction by the
Government of Egypt and its agencies; our shareholder distribution strategy and anticipated distributions to shareholders; commercial viability and timing of, or our ability to execute, future projects,
plant restarts, capacity expansions, plant relocations, or other business initiatives or opportunities, including the completion of the Geismar project; our financial strength and ability to meet future
financial commitments; expected global or regional economic activity (including industrial production levels); expected outcomes of litigation or other disputes, claims and assessments; and expected
actions of governments, government agencies, gas suppliers, courts, tribunals or other third parties.
We believe that we have a reasonable basis for making such forward‐looking statements. The forward‐looking statements in this document are based on our experience, our perception of trends,
current conditions and expected future developments as well as other factors. Certain material factors or assumptions were applied in drawing the conclusions or making the forecasts or projections
that are included in these forward‐looking statements, including, without limitation, future expectations and assumptions concerning the following: the supply of, demand for and price of methanol,
methanol derivatives, natural gas, coal, oil and oil derivatives; our ability to procure natural gas feedstock on commercially acceptable terms; operating rates of our facilities; operating costs,
including natural gas feedstock and logistics costs, capital costs, tax rates, cash flows, foreign exchange rates and interest rates; the availability of committed credit facilities and other financing;
timing of completion and cost of our Geismar project; global and regional economic activity (including industrial production levels); receipt or issuance of third‐party consents or approvals, including,
without limitation, governmental registrations of land title and related mortgages in Egypt and governmental approvals related to rights to purchase natural gas; the establishment of new fuel
standards; absence of a material negative impact from major natural disasters; absence of a material negative impact from changes in laws or regulations; absence of a material negative impact from
political instability in the countries in which we operate; and enforcement of contractual arrangements and ability to perform contractual obligations by customers, natural gas and other suppliers
and other third parties.
However, forward‐looking statements, by their nature, involve risks and uncertainties that could cause actual results to differ materially from those contemplated by the forward‐looking statements.
The risks and uncertainties primarily include those attendant with producing and marketing methanol and successfully carrying out major capital expenditure projects in various jurisdictions,
including, without limitation: conditions in the methanol and other industries including fluctuations in the supply, demand and price for methanol and its derivatives, including demand for methanol
for energy uses, the price of natural gas, coal, oil and oil derivatives; our ability to obtain natural gas feedstock on commercially acceptable terms to underpin current operations and future
production growth opportunities; the ability to carry out corporate initiatives and strategies; actions of competitors, suppliers and financial institutions; conditions within the natural gas delivery
systems that may prevent delivery of our natural gas supply requirements; our ability to meet timeline and budget targets for our Geismar project, including cost pressures arising from labour costs;
competing demand for natural gas, especially with respect to domestic needs for gas and electricity in Chile and Egypt; actions of governments and governmental authorities, including, without
limitation, the implementation of policies or other measures that could impact the supply of or demand for methanol or its derivatives; changes in laws or regulations, import or export restrictions,
anti‐dumping measures, increases in duties, taxes and government royalties, and other actions by governments that may adversely affect our operations or existing contractual arrangements; world‐
wide economic conditions; and other risks described in our 2014 Management’s Discussion and Analysis and our Fourth Quarter 2015 Management’s Discussion and Analysis.
Having in mind these and other factors, investors and other readers are cautioned not to place undue reliance on forward‐looking statements. They are not a substitute for the exercise of one’s own
due diligence and judgment. The outcomes implied by forward‐looking statements may not occur and we do not undertake to update forward‐looking statements except as required by applicable
securities laws.
3030Q&A
3131Appendix
3232Industry Review
Methanol is…
• Primarily produced from natural gas
Natural Gas syngas
Reforming
@ ~900oC CO CO2 H2
Steam [& Oxygen]
Compression Cooling
crude chemical grade
Synthesis Distillation
CH3OH
CH3OH
H2O
APPENDIX 3333Industry Review
Methanol Usage…
…By Derivative …By Region
Source: Methanex – last twelve months ended Dec 31, 2016
APPENDIX 3434Industry Review
Methanex Realized Pricing History
• Methanex posts
reference prices
monthly in Asia and
North America and
quarterly in Europe
• Realized pricing is
lower than
reference prices
due to discounts
specified in
contracts
Source: Methanex, December 31, 2015
APPENDIX 3535Industry Review
Methanol Consumers
• Concentrated consumer base
• 30% of global demand from top 20 consumers
• Main consumers are large, global chemical companies:
• Celanese, BP, Momentive, Skyford, Sabic, BASF, etc.
• Methanex supplies primarily traditional chemical derivative
customers who value:
• Security of supply
• Global presence
• Quality product
APPENDIX 3636Energy Applications
Methanol as a Fuel
• Methanol has attractive features as a transportation fuel:
• Liquid fuel – can be blended with gasoline and ethanol in today’s
vehicles at minimal incremental costs.
• High octane fuel which reduces emissions when blended with (or
substituted for) gasoline.
• A safe fuel which biodegrades quickly (compared to petroleum fuels)
in case of a spill. The toxicity is similar to gasoline.
• No material technical hurdles either in terms of vehicle application or
of distribution infrastructure to introduce methanol significantly into
a marketplace.
• Can be produced from renewable
feedstock.
For further information, see June 6, 2011 MIT study “The Future of
Natural Gas” (section on Conversion to Liquid Fuels beginning page 125
of the report) at http://mitei.mit.edu/publications/reports‐studies
APPENDIX 3737Energy Applications
Methanol Value Proposition as a Fuel
• Methanol is an
affordable gasoline
substitute in China,
and can reduce overall
emissions versus
gasoline
• In dedicated methanol
vehicles and at high
blends (M85 and
M100), methanol
burns more efficiently
than gasoline
• Most fuel blending in China (Nanjing) Wholesale Gasoline Price: $2.36/gallon Jan 31, 2016
China is at low USGC Conventional Regular Gasoline Price: $0.97/gallon Jan 31, 2016
percentages and sold * Net of 17% VAT. Sources: Oil and Gas China, US Department of Energy, Methanex
based on volume.
APPENDIX 3838Emerging Markets
Methanol Fuel Blending Growing Outside China
Several countries outside China in the assessment or near‐commercial stage for fuel blending, however minimal
demand is included in current forecasts from these regions
Iceland
U.K.
Russia
Denmark
Azerbaijan
Netherlands
Alaska U.S.
Switzerland China
Trinidad &
Tobago
Iran
Uzbekistan
Israel
Turkmenistan
Australia
Egypt
Commercial / near‐commercial New Zealand
Assessment stage
APPENDIX 3939Emerging Markets
Methanol as a Marine Fuel
Economical:
• Competitive Fuel Cost
• Modest incremental vessel cost
• Small infrastructure cost (liquid fuel)
• Stena Ferry Lines converting its 1,500 passenger ship
‘Stena Germanica’ to run on methanol fuel using
Wartsilla’s 4‐stroke engine. The second engine conversion
Practical: is expected in December, 2015 with the remaining 2
engines targeted to be completed in 2016
• Minor modifications (fuel system)
• Flex‐fuel option (can continue to use
diesel)
• Environmental benefits (lower SOx,
particulates, NOx)
• Methanex’s Waterfront Shipping has ordered 7 flex‐fuel
vessels capable of running on methanol based on MAN
Diesel & Turbo’s 2 stroke engine. The ships are
expected to be delivered in 2016.
APPENDIX 4040Emerging Markets
Methanol as a Marine Fuel
• Methanol (MEOH) achieves low emissions & bridge to lower CO2 in the future
(renewable/bio methanol)
Source: Stena (4‐stroke engine testing)
APPENDIX 4141Methanol as a Marine Fuel
Modest Fuel & Conversion Costs
Source: Effship Project Summary Report, 2013 (* Costs do not include infrastructure development). Fuel cost based on market price
2012. Conversion based on 5 years pay‐back and 6% interest
APPENDIX 4242Emerging Markets:
Di‐Methyl Ether (DME)
• DME can be blended directly with LPG (propane) up
to approximately 20% for cooking and heating
applications.
• Future promising application for DME is as a diesel
replacement:
• Oberon Fuels Produces DME in the U.S.
DME as propane substitute
• ASTM Standard issued, California approval,
qualified under U.S. Renewable Fuel Standard.
• Volvo developing DME trucks.
• Ford and German government are leading
project to test DME in passenger vehicles.
Volvo DME Truck
APPENDIX 4343Emerging Markets
Methanol / DME as a Fuel Outside China
• Europe is blending methanol into fuel today (up to 3%
blending permitted)
• Australia ‐ Coogee demonstration project targeting
limited launch of methanol blends in near term
• Israel ‐ M15 demo program (market potential ~400kta),
target commercial introduction in the next few years
• Other countries studying or demonstrating fuel
blending: Azerbaijan, Denmark, Russia, Uzbekistan, Iran,
Netherlands, Switzerland, Egypt, Turkmenistan, Trinidad
& Tobago, New Zealand and Germany
• North America Methanol / gasoline pump at
Coogee plant site
• Open Fuel Standard Bill recently
re‐introduced in Congress
• Oberon Fuels producing DME
APPENDIX 4444Emerging Markets
Renewable Methanol
• Methanol and DME is produced from fossil fuels and renewables
LNG = Liquefied Natural Gas; DME = Di‐Methyl Ether;
OBATE = On Board Alcohol to Ether (i.e. methanol converted to DME on board ships)
APPENDIX 4545Emerging Markets
Carbon Recycling International
CRI’s GO Plant in Svartsengi, Iceland
• World’s greenest methanol – technology
captures CO2 from industrial emissions and
converts it into Renewable Methanol
• Sales into Europe gasoline blending market
(M3)
• George Olah semi‐commercial plant
commissioned in 2011
• Completed a project to triple the capacity of
the current plant to 4,000 MT, with future
plans to add commercial scale plants
• In July ‘15 Chinese automaker Geely
announced plans to invest $46 million over 3
years in CRI
• Methanex became a CRI
shareholder in 2013
APPENDIX 4646Operating Rates in China
• China has operated at ~50% based on nameplate capacity; however, market is tighter than it
appears and effective operating rate is ~73% (source: MMSA)
• Many plants are not operational due to various factors including: operational
problems/maintenance, inability to access feedstock, high cost, swung to ammonia production,
emission controls, low rates of coking coal operations
Source: Methanol Markets Services Asia (MMSA); capacity and production includes Methanol to Olefins
APPENDIX 4747Methanex Cost Structure
• Natural gas • Fixed Manufacturing and
• Long‐term gas contracts have fixed base price and G&A costs
variable component linked to the price of • Primarily people costs (approx.
methanol. This reduces methanol price exposure 1100 employees)
• Medicine Hat gas sourced from Alberta market.
Gas price for 90% of requirements hedged to end of
2016, and 40% to end of 2019.
• Geismar 2 exposed to US spot market; gas price for
40% of gas requirements hedged to 2025
• Freight
• Fleet of 19 leased and owned time charter vessels
supplemented with shorter term COA vessels and
spot vessel shipments * Assumes average realized methanol price of
approx. US$400/tonne (gas costs vary with
• Integrated supply chain allows benefit of back‐haul methanol pricing).
shipments
• Network of leased and owned terminals worldwide
APPENDIX 4848Leverage – Rating Agency Perspective
• Leverage target = Investment Grade Pro Forma Rating Agency Credit Ratios
• Preserves financial flexibility (US$ billions unless indicated)
• Lowers cost of debt Total Debt 1 Q4'15
• Access to longer‐term bond market, Total Debt 1.4
shipping market, etc. Leases 2 1.1
Adjusted Debt (including leases) 2.5
• Higher credit capacity for financial
instruments to hedge gas exposures, etc.
Equity 1.7
Adjusted Debt/EBITDA
• Moody’s Baa3, S&P BBB‐, Fitch BBB‐
ARP EBITDA3 Debt/EBITDA
• ~3.0x Debt/EBITDA is key threshold 300 0.7 3.6
• Typically ratio is calculated over a cycle 350 0.9 2.6
400 1.1 2.2
1
Includes Methanex proportionate share of debt & cash
• $400 million undrawn credit facility 2
Approx. adjustment for leases based on Moodys and S&P methods
3
• Backstop liquidity "With Trinidad and Egypt Gas Restrictions" EBITDA scenario from
earlier slide, plus $125 million adjustment reflecting lease portion
of COGS
APPENDIX 4949Foreign Exchange Sensitivity
• US dollar based business
• Majority of revenues in US dollars (EU net exposure hedged)
• Natural gas and freight costs in US dollars
• Approximately $150 million in local currency costs (not actively hedged)
• Approximately $100k in non‐US dollar working capital assets
“A strong US dollar benefits Methanex”
5050Management Alignment
• Executive shareholding requirements:
• CEO ‐ 5 times salary in Methanex shares or share units
• Senior executives (5 members) – 3 times salary
• Other senior management (~50 employees) – 1 times salary
• Short‐term incentive linked to ROCE (return on capital employed)
• Long‐term incentive targets:
• Stock options and share appreciation rights
• Performance share units
• Payout ratio linked to total shareholder return
“…..Management does well when shareholders do well!”
APPENDIX 5151Thank You
You can also read