2020 Active-Passive Investor Summit - October 2020

Page created by Bruce Norman
 
CONTINUE READING
2020 Active-Passive Investor Summit - October 2020
2020 Active-Passive Investor Summit
                                                                            October 2020

  Starboard used this deck in a presentation at the Active-Passive Investor Summit on October 8, 2020. Please note that this version of the deck differs from the version used at the conference. This presentation is for informational
purposes only to provide access to analyses prepared by Starboard Value LP. Nothing in this presentation constitutes an offer of securities, nor does it contain any investment advice, and this presentation is not a solicitation or advertisement for
advisory services. Statements made herein contain information relating to certain companies as well as Starboard’s opinions, however no assurance is made as to the reliability, accuracy, or completeness of the information contained herein, and
                                                                         Starboard is under no obligation to update this presentation or correct any inaccurate statements.
2020 Active-Passive Investor Summit - October 2020
Disclaimer
The purpose of this presentation is to provide access to certain analyses prepared by Starboard Value LP ("Starboard"). This presentation represents the opinions of Starboard as to how such companies can improve their operating performance and increase value for all shareholders.
These opinions are current as of the date of this presentation. Starboard reserves the right to change any opinions expressed herein at any time, and there is no obligation to update, modify, or amend this presentation or to otherwise notify a reader in the event that any matter stated
herein, or any opinion, projection, forecast, or estimate set forth herein, changes, or subsequently becomes inaccurate.

Funds and accounts managed by Starboard currently beneficially own, and/or have an economic interest in, shares of certain companies identified herein. These funds and accounts are in the business of trading – buying and selling – securities, and intend to continue trading in the
securities of such issuers. Recipients should assume that such funds or accounts will from time to time sell all or a portion of their holdings of one or more companies mentioned herein in open market transactions or otherwise (including via short sales), buy additional shares (in open
market or privately negotiated transactions or otherwise), or trade in options, puts, calls, swaps or other derivative instruments relating to some or all of such shares, regardless of the views expressed on this presentation.

This website is not intended to be, nor should it be construed as, a marketing or solicitation vehicle for Starboard or any funds that it manages. The information herein does not provide a complete presentation of the investment strategies or portfolio holdings of Starboard or any
funds it manages, and should not be relied upon for purposes of making an investment or divestment decision.

The views expressed in this presentation are based on publicly available information, including information derived or obtained from filings made with the Securities and Exchange Commission and other regulatory authorities and from third parties. Starboard recognizes that there may
be nonpublic or other information in the possession of the companies discussed herein that could lead these companies and others to disagree with Starboard’s conclusions. Starboard has not sought or obtained consent from any third party to use any statements or information
indicated herein as having been obtained or derived from statements made or published by third parties, nor has it paid for any such statements. None of Starboard, its affiliates, its or their representatives, agents or associated companies or any other person makes any express or
implied representation or warranty as to the reliability, accuracy or completeness of the information contained in this presentation, or in any other written or oral communication transmitted or made available to the recipient. Starboard, its affiliates and its and their representatives,
agents and associated companies expressly disclaim any and all liability based, in whole or in part, on such information, errors therein or omissions therefrom.

There is no assurance or guarantee with respect to the prices at which any securities of the company will trade, and such securities may not trade at prices that may be implied herein. The estimates, projections, pro forma information and potential impact of the analyses set forth herein
are based on assumptions that Starboard believes to be reasonable as of the date of this presentation, but there can be no assurance or guarantee that actual results or performance of the Company will not differ, and such differences may be material.

This presentation is for illustration and discussion purposes only, and is not intended to be, nor should it be construed or used as, financial, legal, tax, or investment advice. Prospective investors should seek independent advice. Analyses and opinions contained herein may be based
on assumptions that if altered can change the analyses or opinions expressed.

This presentation does not constitute an offer to sell or a solicitation to buy any securities in any fund or to participate in any trading strategy, and may not be relied upon in connection with any offer or sale of securities. Any investment decision with respect to a fund or account must
be based solely on a fund’s private placement memorandum or similar document (which will be provided only to qualified offerees and which should be carefully reviewed prior to investing), limited partnership agreement, subscription agreement, and other definitive fund governing
documents or an account’s separate account agreement (together, the “Documents”), which shall govern in the event of any conflict with the information contained herein.

This communication is for information purposes only, and only a high-level summary. Accordingly, it does not contain all material terms pertinent to an investment decision, including important disclosures of conflicts and risk factors associated with an investment. This presentation
in and of itself should not form the basis for any investment decision. This presentation should be read in conjunction with, and is qualified in its entirety by, information appearing in prospectuses or relevant governing documents, which should be carefully reviewed prior to
investing. Past performance is not necessarily indicative of or a guarantee of future results, and the investments described herein are highly speculative and involve risk, including the risk of total loss.

None of the information contained herein has been filed with the Securities and Exchange Commission, any securities administrator under any state securities laws or any other governmental or self-regulatory authority. No governmental authority has passed on the merits of the
offering of interests in a fund or the adequacy of the information contained herein. Any representation to the contrary is unlawful.

Any opinions, assumptions, assessments, statements or the like (collectively, “Statements”) regarding future events or which are forward-looking, including regarding portfolio characteristics and limits, constitute only subjective views, beliefs, outlooks, estimations or intentions of
Starboard, should not be relied on, are subject to change due to a variety of factors, including fluctuating market conditions and economic factors, and involve inherent risks and uncertainties, both general and specific, many of which cannot be predicted or quantified and are beyond
Starboard’s or any fund’s control. Actual results could differ materially from those set forth in, contemplated by, or underlying these Statements, which are subject to change without notice. Due to these risks and uncertainties, there can be no assurance and no representation is given
that these Statements are now, or will prove to be accurate, or complete in any way. Starboard undertakes no responsibility or obligation to revise or update such Statements, and the Statements should not be relied upon in making investment decisions.

                                                                                                                                     © Starboard Value 2020
                                                                                                                                       All Rights Reserved

                                                                                                                                                                                                                                                                                                      1
2020 Active-Passive Investor Summit - October 2020
Corteva, Inc.

                2
2020 Active-Passive Investor Summit - October 2020
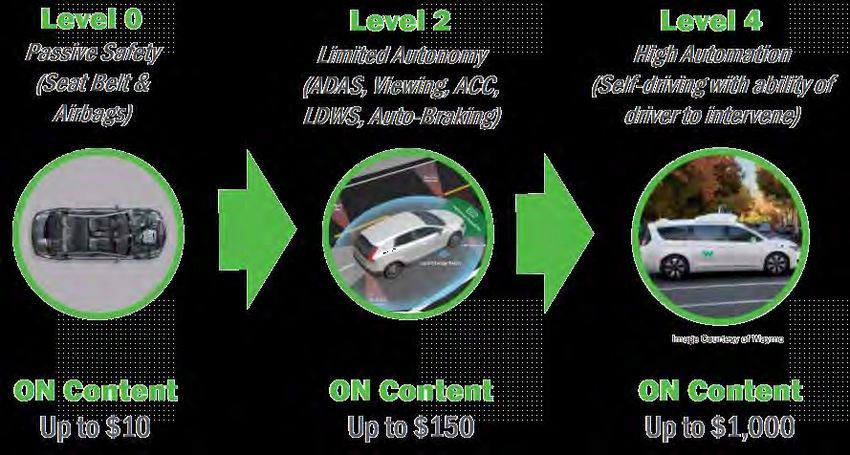
Corteva Was Spun-Out From DowDuPont in 2019
          Corteva, Inc. (“Corteva” or the “Company”) was one of three independent companies created following the merger of Dow and DuPont in
          September 2017.

                                                                           Merger Completed in 2017

                             Materials Science                                 Specialty Products                             Agricultural Science

                        Spun-out in April 2019                                Spun-out in June 2019                           Spun-out in June 2019

                                   Corteva was spun-out as a pure-play agricultural science company following the merger of Dow and DuPont.

Source: Public company filings.                                                                                                                       3
2020 Active-Passive Investor Summit - October 2020
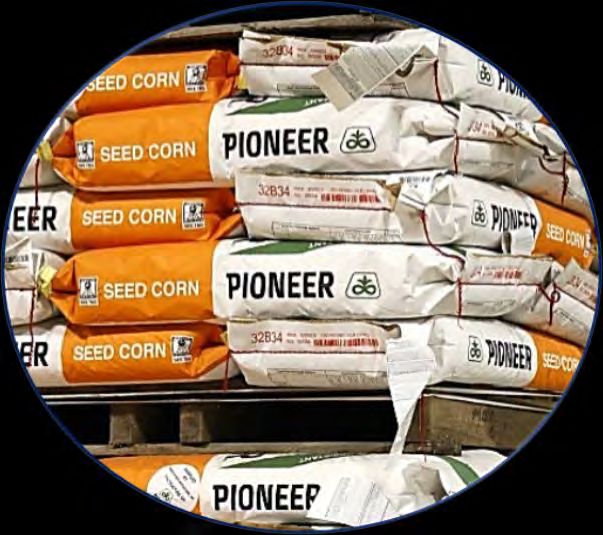
Corteva Is a Leading Agricultural Science Company
          Corteva is one of the largest providers of agricultural seeds and crop protection chemicals to farmers around the world.

               The Company sells seeds and crop protection chemicals to farmers through agents, distributors, and retailers in over 140 countries.

                                                                                                  Corteva’s Key Products

                                        Seeds

                                                                                                                                                     Crop Protection Chemicals

                                                                 Corteva is one of the largest providers of seeds and crop protection chemicals globally.

Source: Public company filings, presentations and transcripts.                                                                                                                   4
2020 Active-Passive Investor Summit - October 2020
Corteva Is One of Three Companies with Global Scale in Both Seeds and
          Crop Protection Chemicals
                                                                            Largest Global Integrated Seeds and Crop Protection Companies by Revenue(1)
                                                                                                                                                                                                                                    ($ in billions)

                               Acquired Monsanto in 2018
                                 and is a subsidiary of
                                Bayer AG – a European                                                                         Only remaining pure-play
                                     conglomerate                                                                                U.S. publicly-traded
                                                                                                                              integrated seeds and crop
                                                    $22.2
                                                                                                                               protection company with                                                       Acquired in 2017 by
                                                                                                                                     global scale                                                          ChemChina, a Chinese
                                                                                                                                                                                                           State Owned Enterprise
                                                                                                                                                  $13.8                                                            $13.6
                                        Seeds                 Crop
                                                            Protection
                                                                                                                                      Seeds                  Crop                                          Seeds       Crop
                                         48%                    52%                                                                                        Protection                                                Protection

                                                                                                                                        55%                    45%                                         23%         77%

                                                                                  (2)

                                                           Corteva is one of three companies globally with leading seed and crop protection products.
Source: Public company filings, Bloomberg. Note: Peer group classifications have been made based on information believed to be reliable, however, such categorizations involve elements of subjectivity.
(1) Revenue shown for FY 2019.
(2) Assumes EUR to USD conversion rate of 1.1213.                                                                                                                                                                                                     5
2020 Active-Passive Investor Summit - October 2020
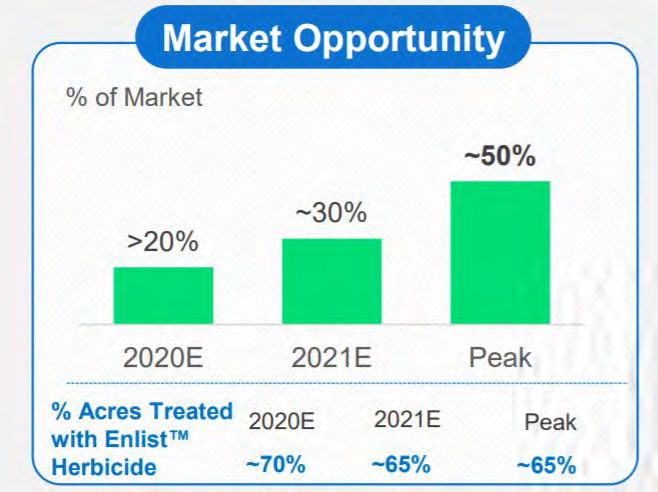
We Believe the Combination Was Highly Strategic
          The combination of Dow and DuPont’s agricultural businesses was highly complementary from both a product portfolio and technology perspective,
          and created a market leader across multiple categories.

                                                                                                                                                                                                                Agriculture
                                                  Pre-Merger Revenue: $5.9 billion(1)                                                                                                      Pre-Merger Revenue: $8.3 billion(2)

                                 Highly productive R&D organization.                                                                                                     Best-in-class seed yields.
                                 Strong relationships with retail and distribution partners.                                                                             Global brand awareness and strong customer loyalty.

                                     Sales Breakdown(3)                                           Key Discoveries                                                           Sales Breakdown(3)                                               Key Brands

                                                           Seed
                                                           20%                                                                                                                  Crop
                                                                                                                                                                              Protection
                                                                                                                                                                                 30%

                                            Crop                                                                                                                                                    Seed
                                          Protection                                                                                                                                                70%
                                             80%

                                                                      Dow AgroSciences and DuPont Agriculture were highly synergistic businesses.
Source: Public company filings and presentations. (1) As of FY 2016. Excludes contributions from the Brazil corn seeds business that was divested to CITIC Agri Fund as part of the anti-trust remedy. (2) As of FY 2016. Excludes contributions from the
portion of DuPont’s crop protection business that was divested to FMC Corporation as part of the anti-trust remedy. (3) Sales breakdown per pg. 8 of Company’s May 2019 Investor Presentation                                                               6
2020 Active-Passive Investor Summit - October 2020
We Also Believe the Combination Has Strong Operational Merits
          Management presentations suggest that Corteva has an opportunity to realize $1.9 billion in cumulative cost savings, representing nearly 100% of the
          Company’s EBITDA at the time of the combination in 2017.

                            Excerpt of Corteva Management Presentation Highlighting Operational Synergy Potential

                                                    There is significant opportunity to streamline operations as a result of the combination.

Source: Public company filings and presentations.                                                                                                                7
2020 Active-Passive Investor Summit - October 2020
Corteva Financial Summary
          Corteva has an enterprise value of $25 billion and sells both seeds and crop protection chemicals in over 140 countries around the world.

                                                          Financial Snapshot                                                                                    2019 Revenue Breakdown
                                                                                                          ($ in millions, except per share data)

                              Stock Price (10/02/20)                                                        $29.37
                              Shares Outstanding                                                             748.6
                              Market Cap                                                                  $21,985                                                                        APAC
                                                                    (1)
                                                                                                                                                                                          9%
                              (+) Long-Term Debt                                                              1,102
                              (-) Cash & Equivalents                                                         (2,869)                                                             EMEA
                                                                                                                                                     Crop                                        North
                              (+) Minority Interest                                                             240                                                               20%
                                                                                                                                                   Protection                                   America
                                                                                       (2)                                                            45%          Seed
                              (+) After-Tax Pension Liability                                                  4,771                                               55%                           50%
                              Enterprise Value                                                            $25,229                                                                   LatAm
                                                                                                                                                                                     21%
                              TEV / Consensus 2021 EBITDA                                                      11.3x
                              Price / Consensus 2021 EPS                                                       17.9x
                              2021 Consensus Dividend Yield                                                    1.9%

                                                                                             Corteva has a significant presence in all regions globally.

Source: CapitalIQ, Wall Street consensus estimates, public company filings. Market data as of October 2, 2020.
(1) Excludes commercial notes and other short-term debt used to finance seasonal working capital. (2) Assumes tax rate of 21%.                                                                            8
2020 Active-Passive Investor Summit - October 2020
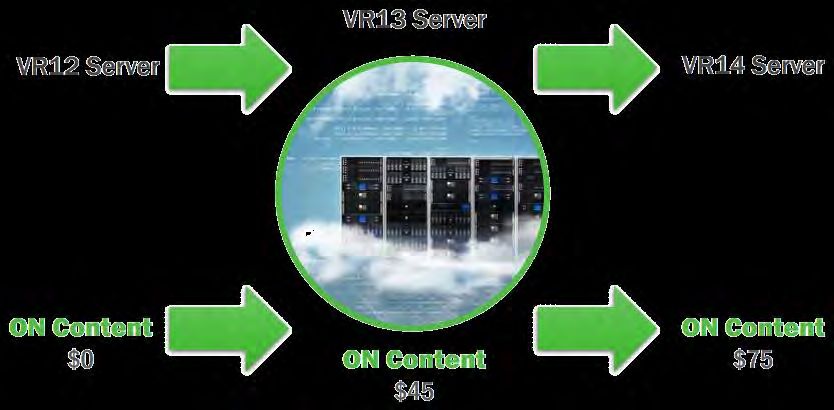
In Seeds, Corteva Distinguishes Its Product Offering Through Best-In-
          Class Yield(1)
          More crops equals more money for farmers, and as a result, yield is typically the most important consideration for farmers when they choose a seed
          provider.

                                                                                                                           Crop Yield Example – Field Corn

                                                                                                                                              Ear of corn

                                                                                                                                                                                                                                                      Kernels
                                                                                                                                                                                                                                                  (~90,000 kernels
                                                                                                                                                                                                                                                     equals one
                                                                                                                                                                                                                                                   bushel of corn)

                        Farmers want to maximize the number of bushels they can sell by buying seeds that yield more ears per plant and more kernels per ear

                                          We believe yield is typically the most important criteria for farmers when they decide what seed to purchase.
Source: Public company filings and presentations.
(1) Yield advantage based on investor presentation from Corteva on August 17, 2020 that listed a 8.2 bushel / acre advantage vs. peers in corn, and a 6.9 bushel / acre overall advantage for all crops. Categorizations of yield as “best-in-class” are statements of
opinion. While such statements are based on information believed to be reliable, however, they may incorporate certain assumptions.                                                                                                                                      9
Corteva’s Seed Yields Have Been Developed Through Decades of
          Intensive Research & Development
          The breeding programs Corteva uses to continuously improve yield potential in its seeds – also referred to as germplasm – are time-intensive, involve
          trial-and-error, and over time, create a nearly insurmountable barrier for new entrants.

                                                                Simplified Example of a Breeding Program – Field Corn

                                                                                  Continuous cycle of
                                                                              breeding different plants to
                                                                                create germplasm with
                                                                                greater yield potential

                                    Select germplasm from high-                                                       Grow crop from selected
                                  yielding plants for cross breeding                                              germplasm and send back to R&D
                                                                                                                          center for study

                         Corteva has spent decades improving the yield potential in its germplasm through highly time-intensive breeding programs.

Source: Public company filings.                                                                                                                                   10
Corteva Helps Farmers Protect Crop Yields Through Its Innovative Crop
          Protection Offerings
          Aside from common crop chemicals, Corteva has also developed the Enlist system, a paired trait and crop protection offering, that provides farmers
          with crops that have been genetically enhanced to be resistant to common broad-spectrum chemicals.

              Corteva believes its Enlist soybean system could eventually be adopted by 50% of the U.S. market.

              There is additional upside if primary competitor Xtend is restricted from the market due to dicamba drift issues.

                                                          Enlist Soybean U.S. Market Opportunity

                                                                                                                                    Combining chemicals and
                                                                                                                                       traits into a single
                                                                                                                                     complementary offering
                                                                                                                                   expected to drive significant
                                                                                                                                        value for Corteva

     We believe Corteva can create more compelling offerings by increasing collaboration between its seeds and crop protection chemical segments.

Source: Public company filings and presentations                                                                                                                   11
We Believe Corteva Has a Tremendous Product Portfolio and Is Well
          Positioned for the Future
          Corteva has best-in-class germplasm, compelling trait technologies, and a pipeline of innovative crop protection chemicals that should help the
          Company cement itself as a market leader.

               We are aligned with the Board and management in our view of Corteva’s asset quality.

           “…a superior          portfolio of solutions and a highly productive innovation engine, will offer growers greater choice and competitive price for
          value…At spin, this company will be a true Ag industry pure-play, offering investors a compelling investment thesis.”

                                                                                                                                                 Edward Breen, Former Corteva Board Member
                                                                                                                                                                             September 2017

                                                     global leader in corn seed technologies. We're already a global leader in Green
           “…we don't have to go out and invent our future. We're already the

          Chemistry solutions. We have a phenomenal insecticide offering with our Spinosyns…So clearly, this is going to be our decade
          in soybean seed technology. And this is also the opening of a new era in terms of our presence in the retail channel. So we don't have to go out and invent that future. It's here, and
          it's right now.”

                                                                                                                                                          James Collins, Chief Executive Officer
                                                                                                                                                                               September 2020

                                                  We agree that the Company has the right portfolio of assets to realize success in the long-term.

Source: Public company filings and transcripts.                                                                                                                                                     12
However, We Believe the Company’s Performance Has Not Yet Lived Up
         to Its Potential
         Adjusted EBITDA since the merger of Dow and DuPont has remained flat despite expectations of achieving $1.0 billion in cumulative cost synergies
         by the end of 2020.

                                                                                       Adjusted EBITDA and Margins Since 2017 DowDuPont Merger
                                                                                                                                                                                                                                                             ($ in billions)
                                                                                                       14.5%                                                             14.4%
                                                                                                                                                                                                                                                        EBITDA and
                                    13.7%                                                                                                                                                                                               13.9%
                                                                                                                                                                                                                                                       margins remain
                                                                                                                                                                                                                                                      nearly unchanged
                                                                                                        $2.1                                                                                                                                              since the
                                      $2.0                                                                                                                                 $2.0                                                                         DowDuPont
                                                                                                                                                                                                                                        $2.0
                                                                                                                                                                                                                                                           merger

                                                                                                                                                                                                                                                (1)
                                      2017                                                              2018                                                              2019                                                          2020E

              Sales                  $14.2                                                             $14.3                                                             $13.8                                                          $14.0
              ($bn)
                                                                                                                      Adj. EBITDA                         % Margin

                                                There seems to be significant opportunity to improve EBITDA given substantial merger synergies.
Source: Public company filings.
(1) 2020E financials based on Corteva management guidance on Q2 2020 earnings press release. Revenue growth assumes midpoint of 1% - 2% net sales growth guidance, and Adj. EBITDA based on midpoint of $1.9 - $2.0 billion guidance.                                          13
A Comparison To Peers Suggests Significant Opportunity for
          Improvement
          With Corteva’s scale and the quality of its product portfolio, we believe the Company has an opportunity to close the margin gap to peers.

                                                                                               FY 2019 Adjusted EBITDA Margin for Corteva and Peers(1)

          Sales             $4.6                                           $8.8                                         $13.6                                          $13.8                                         $14.6                                         $22.2
          ($bn)

                                                                                                                                                                                                                      28.5%
                            26.5%
                                                                           22.3%                                                                                                                                                                                     22.7%
                                                                                                                         18.9%
                              100%                                                                                                                                      14.4%                                       75%         25%
                                                                     19%         81%                                                                                                                                                                             48%      52%
                                                                                                                    23%        77%
                                                                                                                                                                    55%         45%

                                                                                                  (2)                                  (3)                                                                                           (4)
                             FMC                              BASF Ag Solutions                                       Syngenta                                        Corteva                                     Monsanto                              Bayer Crop Science(2)
                                                                                                                                                                                                                  (FY 2017)

                                                                                                     % of Sales - Seeds                                                % of Sales - Crop Protection

                                                                        Corteva has an opportunity to significantly improve its profitability over time.
Source: Public company filings, Wall Street consensus, Starboard estimates. (1) The peer companies identified here reflect Starboard’s assessment of what firms can reasonably be considered CTVA’s peers in the agricultural seeds and crop protection chemicals
industry. However, this analysis contains elements of subjectivity and the comparisons made herein may differ materially if different firms had been included. (2) Corporate costs allocated based on revenue contribution. Revenue converted from EUR to USD at a rate
of 1.1213. (3) Adj. EBITDA defined as operating income before restructuring & impairment plus D&A expense less capitalized development costs. (4) Adj. EBITDA defined as Ongoing Gross Profit less Ongoing Operating Expense plus D&A expense.                                  14
Seed Segment Margins

                       15
In Seeds, Despite Impact of Royalty Expense, We Believe There Remains
          Room For Improvement
          Corteva has a tremendous seed franchise, with best-in-class yields, valuable trait technologies, strong customer loyalty, and global scale – we believe
          there is an opportunity to significantly improve profitability.

                                                                                                              Seed Segment EBITDA Margin Comparison

                                                                                                                                  1290bps Difference
                                                                                                                                                                                                                 33.1%

                                                                                     20.2%
                    Impact of Royalty
                                                                                      7.4%
                      Payments(2)

                      Current Seed
                                                                                     12.8%
                    EBITDA Margin(1)

                                                                                                                                                                                                                                       (3)
                                                                            Corteva - 2019A                                                                                                          Monsanto - 2017A
                                        Sales
                                                                                      $7.6                                                                                                                         $10.9
                                        ($bn)

                                                                        We believe Corteva can significantly improve profitability in its seed business.
Source: Public company filings, Starboard estimates. Note: Peer group classifications have been made based on information believed to be reliable, however such categorizations involve elements of subjectivity. (1) Includes corporate expenses allocated based on relative
revenue contribution. (2) Corteva recognized $800 million in royalty expense in FY 2019, of which we estimate $240 million is amortization of upfront payments and $560 million is a cash expense that is not already added back in the Company’s definition of Adj.
EBITDA. (3) Adj. EBITDA defined as Reported EBIT plus unusual items plus D&A expense plus corporate costs allocated based on relative revenue contribution.                                                                                                                     16
Crop Protection Segment Margins

                                  17
In Crop Protection, We Also Believe There Is Significant Opportunity to
          Improve Profitability
          We believe Corteva has similar scale and product portfolio quality as peers, and should be able to leverage its assets to achieve similar levels of
          profitability.

                                                                               Crop Protection Chemical Segment EBITDA Margin Comparison (FY 2019)

                                                      26.5%
                                                                               Peer Average: 24.0%
                                                                                                                                                                                                                                               23.3%
                                                                                                                                                                                 22.3%

                                                                                                                    16.2%

                                                                                                                                                (1)                                                       (1)(2)
                                                      FMC                                         CTVA - Crop Protection                                            BASF - Ag Solutions                                    Syngenta - Crop Protection
                           Sales
                                                        $4.6                                                          $6.3                                                         $8.8                                                        $10.5
                           ($bn)

                                                  We believe Corteva can significantly improve profitability in its crop protection chemicals business.
Source: Public company filings, Starboard estimates. Note: Peer group classifications have been made based on information believed to be reliable, however such categorizations involve elements of subjectivity. (1) Includes corporate expenses allocated based
on relative revenue contribution.
(1) Includes corporate expenses allocated based on relative revenue contribution. (2) Assumes EUR to USD FX conversion rate of 1.1213.                                                                                                                              18
We Believe Significant Value Can Be Created For All Shareholders
          Through Improved Execution
          We believe Corteva can create substantial value for shareholders through improved operational execution, which will inspire greater confidence from
          shareholders, and lead to an improved valuation multiple.

                                                                                                                       2019A                            2022E(1)

                                                        Revenue                                                        $13.8B                            $14.7B
                                                            2019 – 2022 CAGR                                                                              2.0%

                                                        Adjusted EBITDA                                                 $2.0B                            $3.4B
                                                            Margin (%)                                                  14.4%                            23.0%

                                                                                                                                                       EV/EBITDA
                                                         Current Price                              YE2021 Target At Current Multiple              =     ~$47

                                                                $29.37                              YE2021 Target At High End of Peers’ Multiple   =     ~$55

                                                                                     We believe a substantial value creation opportunity exists at Corteva.
Source: Public company filings, Starboard estimates. Market data as of October 2, 2020.
(1) Assumes enterprise value includes after-tax pension liability of $4.8 billion (21% tax rate).                                                                  19
In Summary, We Believe Corteva Is a Compelling Investment Opportunity
      High Barriers to Entry

      Strong Customer Loyalty

      Compelling Products & Technologies

      Acyclical End Markets

      Significant Margin Improvement
       Opportunity

      Compelling Valuation

                     We believe Corteva represents a compelling investment opportunity.

                                                                                          20
ON Semiconductor Corporation

                               21
Company Overview
          ON Semiconductor Corporation (“ON,” or “the Company”) is a leading provider of semiconductor-based solutions that has grown through organic
          and inorganic initiatives.

                                                          Financial Overview                                                                                Select Acquisitions
                                                                                                          ($ in millions, except per share data)

                   Stock Price (10/07/2020)                                                                        $23.35
                                                                                                                                                    2019                           2016
                    (x) Shares Outstanding                                                                           412.7
                   Market Cap                                                                                      $9,637
                    (+) Debt / NCI                                                                                   4,764
                    (-) Cash & Investments                                                                          (2,060)                        $1.0bn                         $2.5bn
                   Enterprise Value                                                                               $12,340

                   TEV / Consensus FY21E EBITDA                                                                        10.0x                        2014                           2011
                   Price / Consensus FY21E Earnings                                                                    17.8x

                                                                                                                                                   $405mm                         $366mm

                                             ON is a premier semiconductor company that has grown by investing in R&D and acquiring businesses

Source: Capital IQ, Wall Street consensus estimates, public company filings. Market data as of 10/7/20.                                                                                    22
Strong End-Market Exposure
          ON serves attractive end-markets.

                                                     Attractive End Markets1                                                    Long Product Cycles2

                                                    Computing
                                                      11%                                                                                   0-3 Years
                                                                         Auto.                                                                 21%
                                           Consumer
                                             11%                         33%
                                                                                                                         7+ Years
                                                                                                                           47%
                                           Comm.
                                            19%                                                                                              3-7 Years
                                                                                                                                                32%
                                                               Industrial
                                                                 26%

                                                                       ON sells products across diversified, attractive end-markets
Source: Public company filings, public company presentation.
1.   Based on 2019 revenue.
                                                                                                                                                         23
2.   Based on 2018 revenue.
ON Has Had a Few Challenging Years
          Although ON’s revenue has recently been impacted by an industry-wide slowdown, ON’s profits have been disproportionately affected due to its fab
          heavy model.
                     2014A-2020E Non-GAAP Revenue                                                    2014A-2020E Adj. Gross Profit                               2014A-2020E Adj. Operating Profit

                                                                                                                               $2,240
                                                                                                                                                                                       $982
                                                                                                                      $1,990            $1,993
                                                              $5,878
                                                 $5,388                  $5,518                                                                                                 $807
                                                                                  $5,069                                                         $1,642                                       $779

                                                                                                             $1,368
                                    $3,907
                                                                                                    $1,192
                      $3,496                                                               $1,116
         $3,162                                                                                                                                                          $480                        $467
                                                                                                                                                                  $408
                                                                                                                                                          $385

           2014         2015         2016         2017         2018      2019     2020E    2014     2015     2016     2017     2018     2019     2020E    2014    2015   2016   2017   2018   2019   2020E

                                             Industry-wide volatility due to the trade war and COVID have disproportionately impacted ON’s profits
Source: Capital IQ, public company filings. Market data as of 10/7/20.

                                                                                                                                                                                                             24
ON Is Well-Positioned to Grow Going Forward
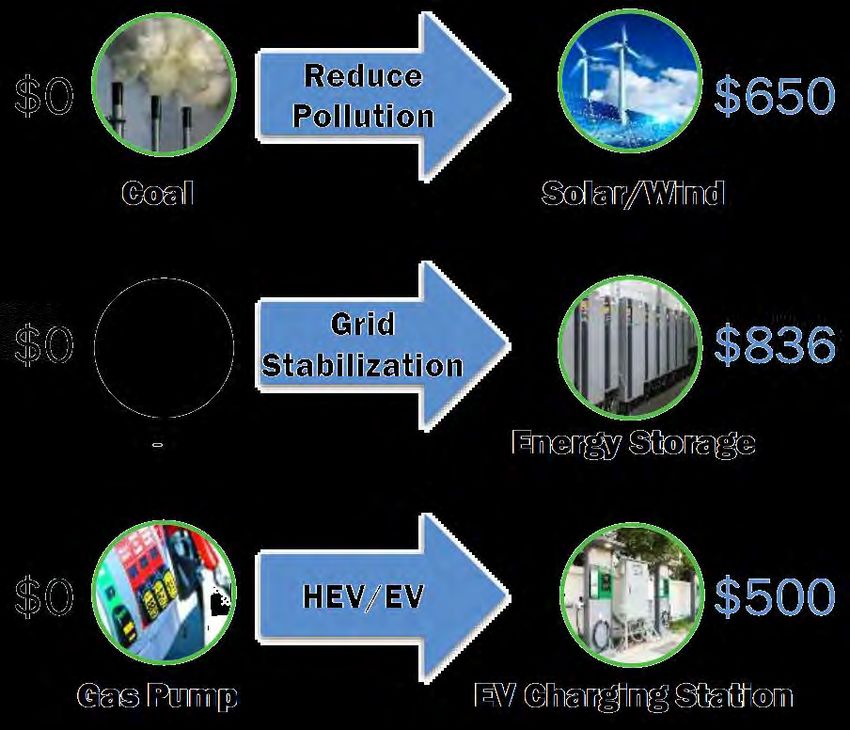
         Approximately 65% of ON’s revenue is exposed to the Automotive, Industrial, and Cloud Power end markets, which we believe have long runway for
         semiconductor content growth.

                Automotive Content Growth Examples              Industrial Content Growth Examples            Cloud Power Content Growth Examples

                                                                                          Farm

                                                                                         System

                                       A significant portion of ON’s business is exposed to attractive, growing end markets

Source: Public company presentation.                                                                                                                      25
ON Is Currently Operating Below Its Targets and Peer Group
          We believe there is a meaningful opportunity to improve operations at ON.

                     ’14A-19A Organic Revenue Growth                                                     2020E Adj. Gross Margins           2020E Adj. Operating Income Margins

                                                                                                                                    61.8%
                                                                                                                                                                         33.7%
                                                  4.8%

                                                                                                                  43.0%
                                                                                                                                                           22.0%
                                                                                  2.9%           32.4%

                   2.1%

                                                                                                                                             9.2%

                    ON                   ON Mgmt. Plan                     Peer Median 1         ON           ON Mgmt. Plan   Peer Median    ON        ON Mgmt. Plan   Peer Median

                                 We believe that ON can at least achieve its targets, which would still leave additional upside to close the gap to peers
Source: Capital IQ, public company filings. Market data as of 10/7/20.
Note: The peer group reflects the fabless / fab-lite peers and the fab-heavy peers on page 28.
1. Does not include Infineon Technologies given lack of public disclosure.                                                                                                           26
Long-Term Shareholder Returns
          ON is currently trading at the widest disparity to peers in years, despite having significant company-specific improvement opportunities.

                                                                                                                               Total Shareholder Returns

        650%

        550%                                                                                                                                                                                                                          542%

        450%

        350%
                                                                                                                                                                                                                                      296% 415% Under-
                                                                                                                                                                                                                                           Performance
        250%

        150%                                                                                                                                                                                                                          127%

          50%

         -50%
            Oct-15                                              Oct-16                                            Oct-17                                           Oct-18                                            Oct-19       Oct-20

                                                                ON                                  PHLX Semiconductor Sector Total Return Index 1                                                                Proxy Peers 2

                                                                              ON has lagged its semiconductor peers over an extended period of time
Source: Capital IQ, public company filings. Market data as of 10/7/20.
Note: Returns adjusted for dividends.
1.    PHLX Semiconductor Sector Index is a capitalization-weighted index composed of 30 semiconductor companies. The index is primarily designed to track performance of the semiconductor industry.
2.    Proxy Peer group from ON’s 2020 proxy statement includes AMD, ADI, AMAT, CREE, FSLR, LRCX, MRVL, MXIM, MCHP, QRVO, SWKS, TXN, and XLNX but does not include Cypress Semiconductor since it was acquired in 2020.
                                                                                                                                                                                                                                                   27
ON Trades at a Deep Discount to Its Peer Group
           We believe ON, which trades below its peers, has an opportunity to improve its multiple with consistent execution, as well as additional upside by
           shifting to a fab-lite model.
                                                                                                                                  Enterprise Value / CY2021E EBITDA

                                                                                                                                     Fabless / Fab-Lite Direct Peers                                                                                               Fab-Heavy Direct Peers

                                                                                                                                         Median: 16.7x                                                                                             19.7x
                                                                                                           18.1x
                                                                                                                                             17.0x                                                  Median: 16.5x
                                                                                                                                                                               16.5x
                                                                                                                                                                                                                 14.3x                                                                           Median: 13.1x
                                                                                                                                                                                                                                                                                     13.1x
                                                                                                                                                                                                                                                                                                            11.5x
                                       10.0x

                                                                          7.3x

                                        ON                             PF ON 1                           MXIM 2                               ADI                            MCHP                               NXPI                               TXN                                IFX                   STM
            FY 2019A
                                        $5.5bn                                                              $2.2bn3                           $6.0bn                           $5.3bn3                            $8.9bn                           $14.4bn                           $9.5bn4                $9.5bn
            Revenue

                                                                                          ON has an opportunity to narrow the valuation gap to its closest peers
Source: Capital IQ, public company filings, public company presentation. Market data as of 10/7/20.
Note: Fabless / fab-lite direct peers and fab-heavy direct peers were selected based on companies with similar end-market mix. The peer companies identified here reflect Starboard’s assessment of what firms can be reasonably considered ON’s peers in the semiconductor industry. However, this
analysis contains elements of subjectivity and the comparisons made herein may differ materially if other firms had been included. 1. Applies long-term operating margin of 22% to 2021E consensus revenue and add $483.4mm of D&A to calculate PF EBITDA. 2. ADI announced the acquisition of
MXIM on July 13, 2020. 3. Based on FY2020. 4. Based on EUR:USD ratio of 1.17855.
                                                                                                                                                                                                                                                                                                                     28
We See Multiple Ways to Win at ON
We believe that by pulling any one or combination of these levers, ON would create meaningful value for its shareholders.

         1           Improve gross margin by rationalizing manufacturing footprint

                     Reduce cyclicality and boost FCF conversion by exploring a
         2
                     fab-lite model

         3           Continued industry consolidation

                                                                                                                            29
1                     Manufacturing Footprint Rationalization
           A comparison of key metrics between ON and its peers with large manufacturing footprints show the margin improvement opportunity.

                                                                                                                                                             Utilization Rates1
                                                                                                                                                               Average: ~80%
                                                                                                                              ~80-85%                                                                             ~80-85%
                                                                                                                                                                                                                                                                                                      ~75-80%

                                             ~65%

                                               ON                                                                                NXPI                                                                                STM                                                                                    TXN
                                                   Sq. Ft Per Manufacturing Facility1                                                                                                                                                        Revenue per Employee2
           (units in thousands)                                                                                                                                                           ($ in thousands)

                                                                                                                           1,000+                                                                                                                                                                           $307

                                                                                                                                                                                                                            $159
                                              413

                                             ON                                                                      Peer Average                                                                                          ON                                                                      Peer Average

                                                                                         We believe there is a significant opportunity to rationalize excess capacity
Source: Starboard estimates, public company filings, Wall Street estimates, company transcripts.
Note: The peer companies identified here reflect Starboard’s assessment of what firms can be reasonably considered ON’s peers in the semiconductor industry. However, this analysis contains elements of subjectivity and the comparisons made herein may differ materially if other firms had been
included. 1. Based on a peer group that we have identified as having a sizeable manufacturing footprint and publicly available data. Based on latest fiscal year. 2. Based on latest fiscal year by company. This peer group reflects the fab-heavy direct peers on page 28. Based on latest fiscal year.          30
1                  Manufacturing Footprint Rationalization (Cont’d)
          ON has begun taking steps to rationalize its footprint and move products from high-cost fabs to low-cost fabs.
      1                               Closure of Rochester Facility                          2                        Sale of Belgium Facility

      3                               Sale of Niigata, Japan Facility                        4                Acquisition of East Fishkill, NY Facility

                                                            ON is beginning to take steps to right size its cost structure

Source: Public company transcripts.                                                                                                                       31
2                    Explore a Fab-Lite Model
           Due to its heavy internal manufacturing footprint, ON suffers more than its fab-lite / fabless peers during downturns.

                 A common metric semiconductor companies use to forecast profitability in downturns is what their gross margin decline is for every “x% decline in revenue.” ON has
                  significantly lagged fab-lite peers on this metric.

                                                                                                      Implied Change in Gross Margins From 10% Decline in Revenue1

                                                                                                                                                                                                                                                                                                      (1.5%)
                                                                                                                                                                                                                                       (2.3%)
                                                                                                     (3.1%)                                                           (3.1%)
                                                                                                                                                                                       Average: (2.5%)

                                   (6.2%)
                                      ON                                                              ADI                                                            MCHP                                                              NXPI                                                           MXIM 2

                                                                                             A shift to a fab-lite model can allow ON to have more stable margins
Source: Public company filings, public company transcripts.
Note: The peer companies identified here reflect Starboard’s assessment of what firms can be reasonably considered ON’s peers in the semiconductor industry. However, this analysis contains elements of subjectivity and the comparisons made herein may differ materially if other firms had been
included. 1. This peer group reflects the fabless / fab-lite direct peers on page 28. Calculated as the difference in gross margins divided by change in revenue between calendar year Q2’20 vs calendar year Q2’19. 2. Based on commentary from CFO of Maxim on Q4’19 earnings call.                          32
2                    Explore a Fab-Lite Model (Cont’d)
           With a fab-lite model, we believe ON can meaningfully improve its cash flow by cutting down on labor and capital expenditures.

                                                Capital Expenditures % of Revenue1                                                                                                                                                        Revenue / Employee1
                                                                                                                                                                                    ($ in thousands)                          $365
                                                                                                                                                                                                                                                                                Average: $321
                    9.7%                                                                                                                                                                                                                                      $325
                                                                                                                                                                                                                                                                                              $302
                                                                                                                                                                                                                                                                                                      $293

                                                                                       Average: 4.5%
                                                    5.9%

                                                                                    4.6%                                                                                                       $159
                                                                                                                    4.3%

                                                                                                                                                    3.1%

                     ON                            NXPI                             ADI                          MCHP 2                           MXIM                                         ON                             ADI                          MXIM                             NXPI      MCHP

                                               We believe that ON will be able to boost its free cash flow generation by shifting to a fab-lite business model
Source: Public company filings.
Note: The peer companies identified here reflect Starboard’s assessment of what firms can be reasonably considered ON’s peers in the semiconductor industry. However, this analysis contains elements of subjectivity and the comparisons made herein may differ materially if other firms had been
included.
1. This peer group reflects the fabless / fab-lite direct peers on page 28. Based on latest fiscal year by company. 2. Uses FY2019 figures.
                                                                                                                                                                                                                                                                                                             33
2                     Industry Example: Maxim
           Maxim did an excellent job of shifting to a fab-lite model by moving its manufacturing to foundries and significantly improving its cost structure.

                                                      Gross Margins (FY 2008-2020)                                                                                                                      Capital Expenditure % of Revenue (FY 2008-2020)

                                                                                                                       66.8%
                                                                                                                                                                                                                  10.5%

                                          61.9%

                                                                                                                                                                                                                                                                                                2.5%
                                           2008                                                                        2020E

                                 Gross margins increased meaningfully even though 2020E
                                       revenue is only ~7% higher than 2008 levels.                                                                                                                                2008                                                                        2020E

            “So I think if you look at gross margin and part of our transformation was -- we really went from a company that when I joined almost 12 years ago, we were about 85%, 90% internal
            fab-sourced, and today, we are about 25%. So we really shifted to a much more variable model. And kind of one of the ways that we've tried to capture this is, 10 years ago, when the
            recession, and we were this kind of 85% internal. For a 10% drop in revenue, we probably would have lost about 5 points of gross margin. Today with the, kind of, the outsourced
            model, for that same 10% drop in revenue, we lose about 1 to 2 points of gross margin from utilization.”
                                                                                                                                                       - Bruce Kiddoo, Chief Financial Officer (July 2019)

                                                    Through strong strategic vision and execution, Maxim was able to successfully shift to a fab-lite model
Source: Capital IQ, public company filings. Market data as of 10/7/2020.
Note: The factors that impact a company’s performance can vary significantly. The conditions faced by ON may not be specifically comparable to those faced by Maxim and therefore the performance of ON could materially differ from these case studies, even if ON moves to a fab lite model. In
addition, other factors besides the move to a fab lite model could have influenced the performance of Maxim.                                                                                                                                                                                           34
2                     Valuation Multiple Discount
           We believe ON, which trades below its peers, has an opportunity to improve its multiple with consistent execution, as well as additional upside by
           shifting to a fab-lite model.
                                                                                                                                  Enterprise Value / CY2021E EBITDA

                                                                                                                                     Fabless / Fab-Lite Direct Peers                                                                                               Fab-Heavy Direct Peers

                                                                                                                                         Median: 16.7x                                                                                             19.7x
                                                                                                           18.1x
                                                                                                                                             17.0x                                                  Median: 16.5x
                                                                                                                                                                               16.5x
                                                                                                                                                                                                                 14.3x                                                                           Median: 13.1x
                                                                                                                                                                                                                                                                                     13.1x
                                                                                                                                                                                                                                                                                                            11.5x
                                       10.0x

                                                                          7.3x

                                        ON                             PF ON 1                           MXIM 2                               ADI                            MCHP                               NXPI                               TXN                                IFX                   STM
            FY 2019A
                                        $5.5bn                                                              $2.2bn3                           $6.0bn                           $5.3bn3                            $8.9bn                           $14.4bn                           $9.5bn4                $9.5bn
            Revenue

                                                                                          ON has an opportunity to narrow the valuation gap to its closest peers
Source: Capital IQ, public company filings, public company presentation. Market data as of 10/7/20.
Note: Fabless / fab-lite direct peers and fab-heavy direct peers were selected based on companies with similar end-market mix. The peer companies identified here reflect Starboard’s assessment of what firms can be reasonably considered ON’s peers in the semiconductor industry. However, this
analysis contains elements of subjectivity and the comparisons made herein may differ materially if other firms had been included. 1. Applies long-term operating margin of 22% to 2021E consensus revenue and add $483.4mm of D&A to calculate PF EBITDA. 2. ADI announced the acquisition of
MXIM on July 13, 2020. 3. Based on FY2020. 4. Based on EUR:USD ratio of 1.17855.
                                                                                                                                                                                                                                                                                                                     35
2                    Compelling FCF Potential
           Pro forma for ON’s long-term plan and a shift to a fab-lite model, ON is trading at a compelling FCF yield of ~13%, more than double its fabless /
           fab-lite direct peers.

                                          CY2021E FCF Conversion from EBITDA1                                                                                                                                                               CY2021E FCF Yield2

                                                                                                                                                                                                                    13.2%
                                                                                                        Average: 74.9%
                                                   86.2%
                                                                                   79.6%
                                                                                                                   76.4%

                                                                                                                                                   57.5%
                                                                                                                                                                                                                                                                                 Average: 5.1%
                   48.3%
                                                                                                                                                                                          6.2%                                                 6.1%
                                                                                                                                                                                                                                                                          5.2%
                                                                                                                                                                                                                                                                                                      4.7%   4.6%

                     ON                           MXIM                              ADI                          MCHP                             NXPI                                     ON                     PF ON                      MCHP                         ADI                         NXPI   MXIM

                                                                                   We believe ON has an opportunity to improve its free cash conversion profile
Source: Capital IQ, Starboard estimates, public company filings. Market data as of 10/7/20.
Note: The peer companies identified here reflect Starboard’s assessment of what firms can be reasonably considered ON’s peers in the semiconductor industry. However, this analysis contains elements of subjectivity and the comparisons made herein may differ materially if other firms had been
included. 1. Calculating free cash flow conversion as (CFFO – Capex) / Adj. EBITDA. This peer group reflects the fabless / fab-lite direct peers on page 28. 2. Calculating free cash flow yield as (CFFO – Capex) / Market Capitalization.                                                                         36
3                     Continued Industry Consolidation
           We believe semi industry consolidation will continue, as it has generally been successful, and that ON is uniquely positioned as a scaled asset
           trading at a discount.
                 There has been significant consolidation in the semiconductor industry over the last several years, and many of these acquisitions were completed at attractive valuations for
                  the target.
                                                                                 EV / NTM EBITDA Transaction Multiples for Semiconductor M&A in Last 5 Years1
                                           35.7x

                                                                     28.9x
                                                                                              28.0x

                                                                                                                        22.1x

                                                                                                                                                 18.3x                     18.1x                                                 Median: 17.2x
                                                                                                                                                                                                    16.3x                     15.9x
                                                                                                                                                                                                                                                       15.2x                     14.4x

                  10.6x                                                                                                                                                                                                                                                                                    11.1x
                                                                                                                                                                                                                                                                                                                   9.9x

                           The semi industry has seen a number of recent deals at highly attractive valuations, especially for analog and power companies
Source: Capital IQ. Market data as of 10/7/20.
Note: The precedent transactions identified here reflect Starboard’s assessment of what firms can be reasonably considered precedent transactions in the semiconductor industry. However, this analysis contains elements of subjectivity and the comparisons made herein may differ materially if other
transactions had been included.
1. Represents semiconductor transactions over $1 billion.
                                                                                                                                                                                                                                                                                                                          37
Leadership Change
          On September 4, 2020, ON announced that Keith Jackson, the Company’s President and Chief Executive Officer, intends to retire in May 2021.

                                   Keith Jackson has been CEO of ON for 19 years, and transformed the company into an industry
                                                         leader through organic and inorganic investments.

                                  The Board has an important decision to make in selecting a CEO to lead the Company in its next chapter

Source: Public company filings.                                                                                                                        38
Leadership Change Can Be a Positive Catalyst
          We believe ON has the opportunity to position itself for the long-term by selecting the right CEO.

                                                         Marvell Technology                                                   Integrated Device Technology
              On June 20, 2016, Marvell announced the appointment of Matthew                              On December 17, 2013, IDTI announced the appointment of Greg
               Murphy as CEO and President.                                                                 Waters as CEO and President.

                           Net Revenue                                     Adj. Operating Margin                    Revenue                        Adj. Operating Margin

                                                                                                                                   $843
                                                         $3,940
                                                                                              32.8%
              $3,404                                                                                        $605                                                      27.6%
                                                                                                                      $484
                                                                                                                                                 19.6%
                                   $2,649
                                                                         14.8%
                                                                                                                                                              9.9%
                                                                                    7.9%

              FY2014               FY2016              FY2023E           FY2014    FY2016    FY2023E       FY2011    FY2013       FY2018         FY2011      FY2013   FY2018

                                ON is at an important point in its lifecycle – a new CEO will have the opportunity to take the Company to the next level

Source: Capital IQ, public company filings. Market data as of 10/7/20.                                                                                                         39
Compelling Investment Opportunity

 Attractive End Markets

 Long Product Lifecycles

 Significant Margin Improvement Opportunity

 Industry Consolidation & Opportunities

 Compelling Valuation

                            We believe ON represents a compelling investment opportunity

                                                                                           40
41
You can also read