Why Fast Trains Work: An Assessment of a Fast Regional Rail System in Perth, Australia
←
→
Page content transcription
If your browser does not render page correctly, please read the page content below
Journal of Transportation Technologies, 2013, 3, 37-47
doi:10.4236/jtts.2013.32A005 Published Online May 2013 (http://www.scirp.org/journal/jtts)

 Why Fast Trains Work: An Assessment of a Fast Regional
             Rail System in Perth, Australia
                                 James McIntosh1, Peter Newman1, Garry Glazebrook2
                           1
                           Curtin University Sustainability Policy (CUSP) Institute, Fremantle, Australia
                                  2
                                    University of Technology, Sydney (UTS), Sydney, Australia
            Email: james.r.mcintosh@postgrad.curtin.edu.au, P.Newman@curtin.edu.au, Garry.Glazebrook@uts.edu.au

                               Received January 29, 2013; revised March 2, 2013; accepted March 9, 2013

Copyright © 2013 James McIntosh et al. This is an open access article distributed under the Creative Commons Attribution License,
which permits unrestricted use, distribution, and reproduction in any medium, provided the original work is properly cited.

ABSTRACT
Perth’s new 72 km long Southern Rail System opened in 2007. With a maximum speed of 137 km/hr and an average
speed of almost 90 km/hr this system acts more like a new high speed rail than a suburban rail system, which in Austra-
lia typically averages around 40 km/hr for an all-stops services. The Southern Rail Line was very controversial when
being planned as the urban areas served are not at all typical of those normally provided with rail but instead were
highly car dependent and scattered low density land uses. Nevertheless it has been remarkably successful, carrying over
70,000 people per day (five times the patronage on the express buses it replaced) and has reached the patronage levels
predicted for 2021 a decade ahead of time. The reasons for this success are analyzed and include well-designed inter-
changes, careful integration of bus services, the use of integrated ticketing and fares without transfer penalties and, cru-
cially the high speed of the system when compared to competing car based trips. The Southern Rail Line in effect ex-
plodes the current paradigm of transfer penalties, exposing this as a myth. The lessons for transport planning in low
density cities are significant, and are explored further in the paper.

Keywords: Integrated Ticketing; Fast Rail; Multimodal Patronage Modelling; Feeder Buses; Perth; Western Australia

1. Introduction                                                      of December 2007, and it runs 72 km from the Perth
                                                                     CBD to Western Australia’s second largest city at Man-
This paper will try to suggest why a fast rail line that
                                                                     durah at speeds up to 137 km/hr. The rail line runs for 70
runs within the urban region of Perth works so well and
                                                                     km of its 72 km length at grade in the median and along
why this may help in the assessment of high speed rail
projects. We will initially provide a background to the              the western edge of the Kwinana Freeway.
Southern Rail infrastructure and the catchment which it                 The line has eleven rail stations along the way at major
serves, followed by a description of the Southern Rail               centers and major road intersections including the under-
patronage model, the rail line’s operational model, and a            ground Perth CBD and Esplanade Stations (see Figure 1),
description of its station configurations. This background           with 18 new bridges and 5500 park and ride bays [1].
information will lead to a more detailed discussion of the              The Perth Southern Suburbs rail line replaced an ex-
time and financial costs, or “generalized cost” compare-             isting separated Rapid Busway-based service with an
sons between private vehicles and public transport within            integrated multimodal bus-rail service. The introduction
the Southern Rail’s catchment.                                       of the rail service cut the journey time from approxi-
   Through this lens the paper demonstrates that the                 mately 68 minutes to 48 minutes for the journey from
Southern Rail line’s success in generating a significant             Mandurah to Perth, and increased the existing busway’s
mode shift to public transport has occurred through                  patronage from approximately 14,000 boarding’s/day [2]
physical, operational and regulatory integration. The pa-            to the rail line’s 48,000 when opened in early 2008 and to
per concludes by examining the possible implications of              70,000 boarding’s/day in 2013.
high speed integrated urban rail systems for making                     The Perth Southern Rail Line catchment density (pre-
travel in dispersed cities more sustainable.                         sented in Figure 2) is mainly between 6 - 15 dwellings
                                                                     per hectare, which is a very low dwelling density for
2. Background to the Perth Southern Rail                             rail-based public transport services to be considered vi-
The Perth Southern Suburbs rail line opened on the 23rd              able. South of Murdoch station, the average density of

Copyright © 2013 SciRes.                                                                                                   JTTs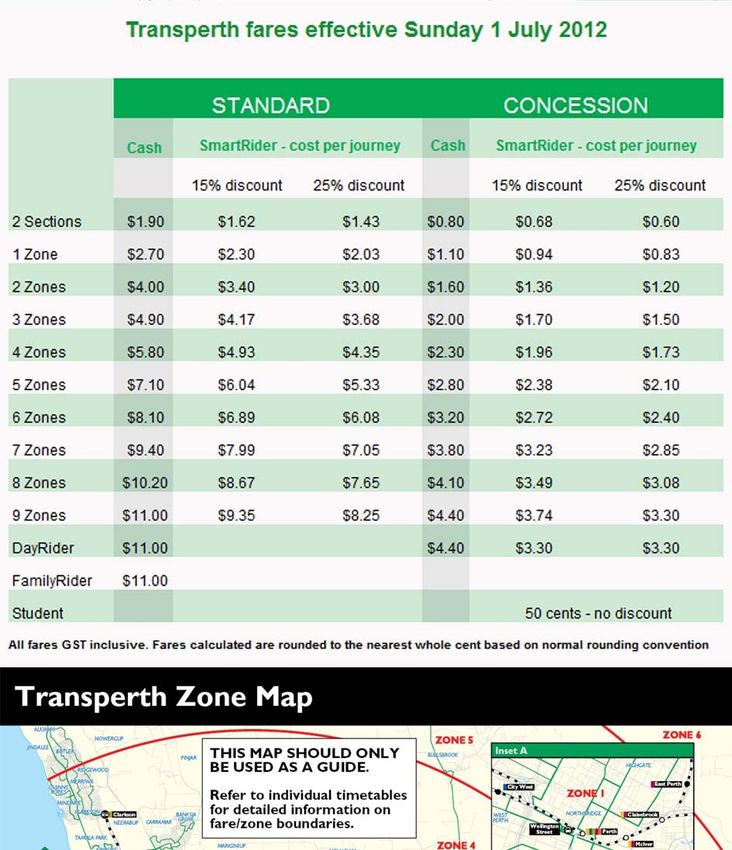
38 J. MCINTOSH ET AL.
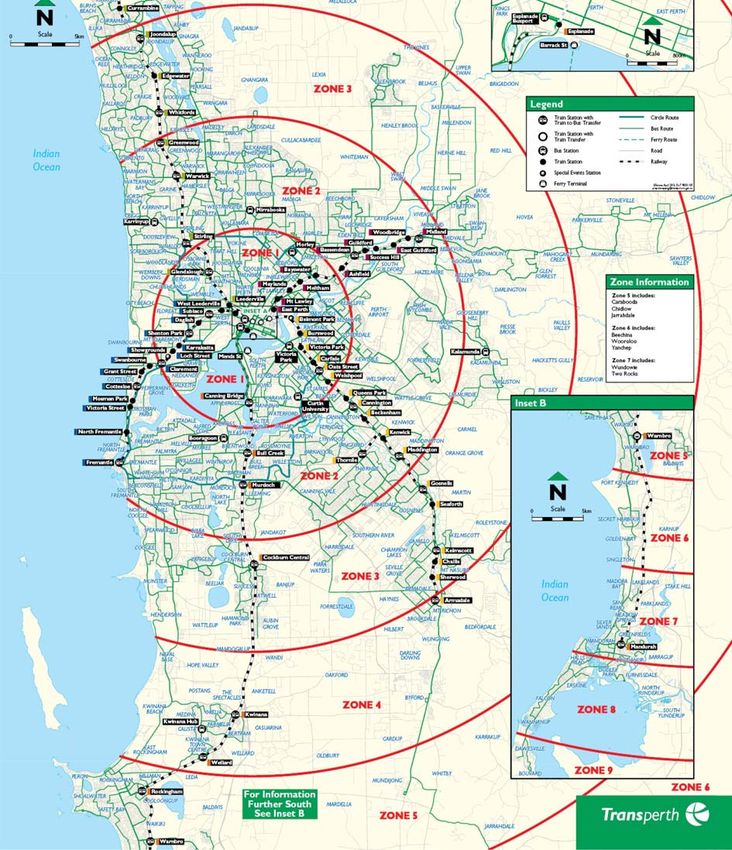
Figure 1. The Perth Southern Rail Line stops and key
feeder roads/bus routes [1]. Figure 2. The Perth Southern Rail Line station catchment
densities [3].
development is even lower, with significant gaps of rural
and the feeder bus services.
land between settlements.
The low pedestrian catchment model for public trans-
port infrastructure is a major shift for the roles of the
3. Perth Southern Rail Patronage Model
different public transport modes, with the park and ride
The Perth Southern Rail Line was the second in Australia facilities and closely integrated bus interchanges de-
to be implemented in the median of an existing freeway signed to extend the rail line’s catchments into the low
(after the section to the north of Perth). As a result, there density surrounding suburbs, using the regional bus net-
is only limited pedestrian catchment along the alignment. work as a feeder service for areas that had previously
The business case patronage model for the Perth South- been car dependent.
ern rail line assumed [1]: As discussed later, actual patronage has been signifi-
9% pedestrian (walk-able) catchment. cantly higher than forecast, particularly from the feeder
91% patronage to come from outside the pedestrian bus system. As a result, 85% of the Southern Rail patrons
catchment, comprising. access the train by a bus service, (or line to line transfer),
28% of total patronage to come from the 5260 park around 8% from the park and ride and the remainder
and ride bays. from pedestrian catchment and kiss and ride [4]. This
63% of the total patronage to come from kiss and ride patronage model appears to be a major part of the suc-
Copyright © 2013 SciRes. JTTs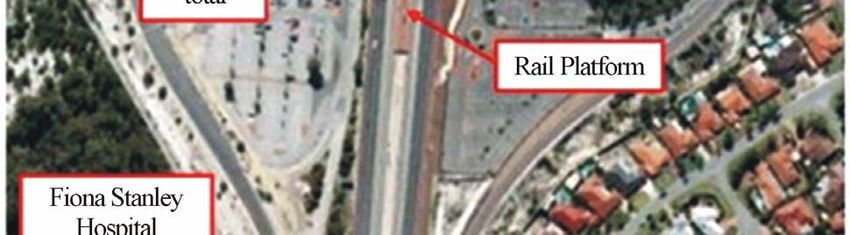
J. MCINTOSH ET AL. 39
cess of the rail system. interchange;
The other major difference to other public transport Additional elements such as the free Central Area
systems in Australia is that the public transport system Transfer buses.
was designed to be competitive with the private motor
vehicle in both time and cost (Generalized cost). This 4.1. Integrated Ticketing and Fares
low generalized cost model is a function of the station
The introduction of integrated multi-modal electronic
configurations and the rail line’s patronage and opera-
ticketing prior to the opening of the Southern Rail Line
tional model in this low residential and commercial den-
enables convenient transferring between modes without
sity environment. The “low generalized interchange cost”
the need to purchase separate tickets. In addition, the fare
station configuration will be described in detail later in
system used means there is no financial penalty for
the paper and show how all the time and financial cost
changing between modes, regardless of modal operator
components of the bus to rail interchange have been
(all of whom are under tactical control of the PTA). The
minimized.
ticketing model for Perth is presented in Figure 5.
4. Perth Southern Rail Operational Model 4.2. Zone Based Fare Structure Facilitating Bus
The transfer based operational model for the Southern Interchange
Rail Line is based on a high level of convenience and a
Perth’s public transport broad zone based structure
low generalized cost to passengers. The Western Austra-
(shown in Figure 5) has enabled most, if not all, of the
lian Public Transport Authority (PTA) achieved this by
bus based feeder services to be “intra-zonal” trips.
providing an integrated multi-modal public transport Whereby the bus based trip to one of the Southern (or
service able to compete with the car for journeys from Northern) Rail line stations for a multi-zonal journey
Perth’s CBD to the key centers and southern suburbs. does not incur an additional financial cost for the journey.
The PTA maintains Strategic, Tactical and Operational The zone based fare structure therefore enables the
(STO) control over Perth’s public transport network, with feeder bus services to travel along the urban highways
bus operator contracts managed by the PTA, with the that cross the Southern Rail Line stations to quickly in-
PTA retaining the service fare box revenue. The STO terchange people at no financial cost to the passenger
framework [5] defines the three levels, or tiers of active- thus removing the financial cost penalty to intermodal
ties of the transport agency (see Figure 3). transfers for the line.
The retention of Strategic and Tactical control over the The feeder buses are integrated into stations by placing
network has enabled the PTA to deliver Perth’s transfer these at the points where highway overpasses occur thus
oriented public transport system for the southern suburbs leading to a direct pedestrian feed-in down an escalator
and through the introduction of specific operational at- from the bus stop to the train. The feeder buses are inte-
tributes primarily: grated into stations by placing these at the points where
Integrated network design and timetabling; highway overpasses occur thus leading to a direct pedes-
Integrated ticketing; trian feed-in down an escalator from the bus stop to the
A zone based fare system that enables seamless bus train.
Figure 3. Conceptual transit operation framework [5].
Copyright © 2013 SciRes. JTTs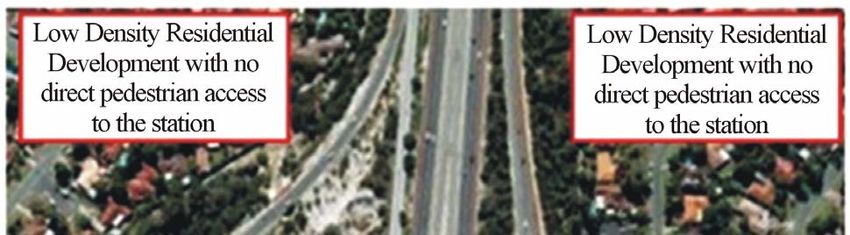
40                                                J. MCINTOSH    ET AL.

4.3. Regional Bus Network Structured to Feed                    based modes, and in particular public transport (it wholly
     the Southern Rail Line                                     funds the capital and operating costs of the Perth CAT
                                                                bus services). This not only acts as a public transport
The Southern Rail Line’s broad feeder bus patronage
catchment is served by a comprehensive bus network that         revenue source (and PT trip cost reduction due to the
has been structured to enter the low density suburbs and        CAT services), but as an additional cost (and disincentive)
quickly bring the bus patrons to the Southern Rail sta-         to private vehicle trips to the CBD.
tions, as well as stations on other lines, to transfer to the
rail network.                                                   4.5. Perth Southern Rail Station Configurations
   These transfers are not “forced” as the buses continue       As previously mentioned the Perth Southern Suburbs
onto other key trip attractors and centres. However the         Rail Line corridor is located in the median of the
system provides bus passengers the opportunity to trans-        Kwinana freeway for the majority of its distance, and as
fer to a fast trip to the CBD (and other centres across the     such the rail stations and their intermodal interchanges
public transport network) at generally no additional fi-        are located in the middle of the freeway as well. This
nancial cost as the majority of these bus trips are con-        constrained location reduces the opportunities for pedes-
tained within a single travel zone (illustrated in Figures 4    trian catchments for the station. However it does have a
and 5).                                                         number of advantages, in that the station does not require
                                                                additional land, while the negative externalities of the rail
4.4. Central Area Transfer Bus Services                         operation are confined to an existing transport corridor.
The Perth “Central Area Transfer” bus (CAT bus) ser-               The integration of a significant bus interchange at the
vices operate free of charge from the rail stations at Fre-     entrance to each of the stations minimizes the transfer
mantle and Joondalup and within the Perth City Council          time cost between modes (as part of the low generalized
municipal boundaries as a “Free Transit Zone”, thus             cost trip model), and given its controlled nature makes a
minimizing the cost of travel at either end of the trip ori-    very safe environment to transfer between modes, and for
gin and destination at these major centers.                     accessing the park and ride facilities both during the day
   To fund the CAT services, the Perth Parking Manage-          and at night. The challenges associated with its location
ment Act, 1999 operates within the Perth CBD, and hy-           are that it limits the amount of ancillary infrastructure
pothecates the revenue generated to alternative non car         that can be co-located within proximity of the station

Figure 4. A sample of the western feeder bus catchments for the Southern Rail Line stations of Canning Bridge, Bull Creek
and Murdoch [6].

Copyright © 2013 SciRes.                                                                                               JTTs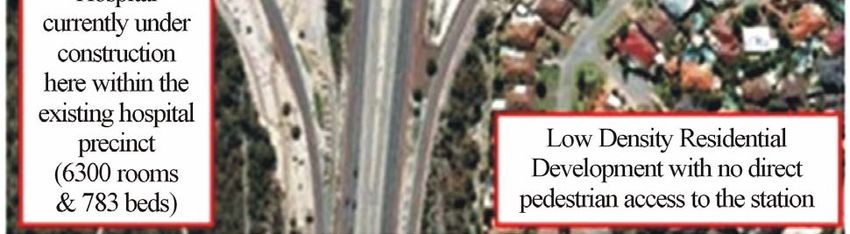
J. MCINTOSH ET AL. 41
tion and operational attributes of one of the Perth South-
ern Suburbs rail line stations, the Murdoch Station at the
South Street intersection has been selected.
4.6. Murdoch Station
Murdoch Station (shown in Figure 6) is now the busiest
station of the entire Perth rail network (outside of Perth
Central). This is an increasing trend as in 2010 Murdoch
Station had 6733 boardings per day, and is now up to
8383 passenger boardings in March, 2012 with 4950
(59%) of these being bus to train transfers, with approxi-
mately 700 park and ride spaces (8.3%) [9].
In the absence of any data for the remaining patronage
that is unaccounted for (2733 daily boardings), it is ex-
pected that these are made up of Kiss and Ride, Cycle
and Ride and pedestrian access modes. The station has
effectively no residential pedestrian catchment given the
walking distance from property to the station is over
800m. This is due to the configuration of the road net-
work adjacent to the station, and the lack of any pedes-
trian walkways (this is illustrated on Figure 7). The sta-
tion is however within walking distance to a new and
existing hospital precinct (approximately 700 m - 800 m)
and is close to Murdoch University (approximately 1500
m), though designs for redevelopment of a TOD over the
car park have been drawn up by the State Government.
The key attribute of the Southern Rail Line stations,
and Murdoch station in particular, is the extensive feeder
bus services that travel at relatively high speeds along the
crossing urban highways (such as South Street at Mur-
doch Station), these attract patronage to the rail line due
to its speed, as it is generally at no additional cost as the
feeder services are “intra zonal” trips.
5. Perth Southern Rail Operational Modal
Choice Model
The generalized cost (GC) to the user of either public or
private transport trip is characterized as a function of a
time component, a monetary component, and opportunity
component, which can be expressed as [11,12];
GC TTC FC OC (1)
Travel Time Cost (TTC) is a function of the mone-
Figure 5. (Top) Transperth public transport fare structure tized value of the time spent (which includes waiting
[7]; (Bottom) transperth public transport zone map with time, access time, travel time and where relevant
the inner radius of 8 km subsequent rings 10 km [7]. transfer time) that has been calculated based on the
trip purpose (journey to work) and the travelers in-
(park and ride facilities, bike parking) and makes diffi- come;
cult any joint development of the stations with the private Financial Cost (FC) is costs of fuel, wear and tear and
sector to implement Transit Oriented Development any parking charge or toll on a car journey, or a pub-
(TOD); several stations are now doing this by building lic transport fare cost;
high rise as a sound wall for other development on the Opportunity Cost (OC) is a function of the addi-
other side. To provide an example of the physical loca- tional journey time the traveler experiences due to ei-
Copyright © 2013 SciRes. JTTs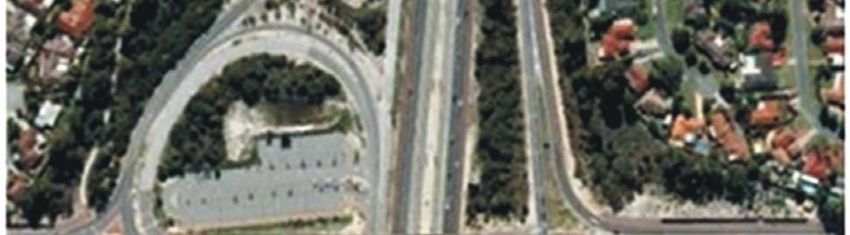
42                                                 J. MCINTOSH    ET AL.

                                                                               Figure 7. Murdoch station [10].

                                                                     ther road based or public transport congestion, that
                                                                     could be spent doing something more productive.
                                                                    The concept of generalized cost of a public or private
                                                                 trip is integral in transport planning for the development
                                                                 a transport link’s modal choice model through the prepa-
                                                                 ration of a modal utility (a quantitative measure of the
                                                                 benefit/dis-benefit of a particular transport mode). The
                                                                 Southern Rail modal choices can be viewed in a Nested
                                                                 Multinomial Logit model (Figure 8).
                                                                    The modal utilities assigned to each mode are used to
                                                                 determine the probabilities of which mode would be used
                                                                 for a trip for the Southern Rail catchment to the CBD.
                                                                 Due to data limitations this paper has provided a quail-
                                                                 tative presentation of the generalized cost input time cost,
                                                                 financial cost and opportunity costs components to un-
                                                                 derstand the generalized cost for private vehicles and the
                                                                 Perth Southern rail line. The actual patronage figures
                                                                 presented later, validate the operational model proposed.
                                                                    Whilst the financial cost of the car trip is increasing
Figure 6. (Top) Murdoch station viewed from the kwinana          significantly due to the increases in cost of fuel and
freeway [8]; (Second top) park & ride facilities in front of     parking costs into the CBD (see Figure 9), it is the com-
the new fiona stanley hospital and cycle way between the off     petitiveness of the Southern Rail Line with the private
ramp and park & ride; (third Top) bus discharge and entry
into the station, with electronic bus timetable information at   vehicle due to congestion on the competing Kwinana
bus bays; (Bottom) lockable bike parking for the cycle com-      Freeway which gives the Southern Rail its real edge.
muter, thus providing a full multimodal interchange.                The effect of road based congestion on Perth’s com-

Copyright © 2013 SciRes.                                                                                                JTTs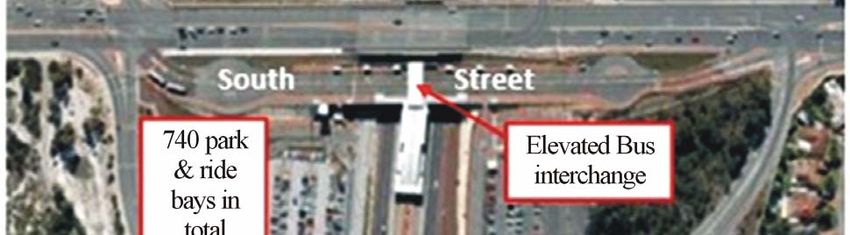
J. MCINTOSH ET AL. 43
Figure 8. The Perth Southern Rail Line catchment multinomial nested logit mode choice model (using [13]).
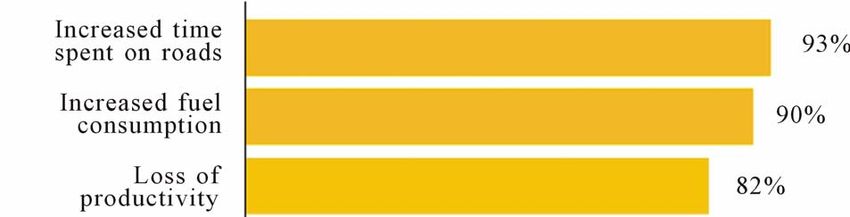
Figure 10. RACWA 2012 survey results on the prompted
impact of traffic congestion [15].
trip to the CBD during the AM peak, and these are used
Figure 9. Perth retail fuel prices 2004-2012 [14]. to frame the mode choice discussion with regard to the
Southern Rail catchment.
muters has been verified by the Royal Automobile Club Table 1 clearly demonstrates that the public transport
of Western Australia (RACWA), which in 2012 con- trip can provide a lower generalized cost for the trips to
ducted their annual survey of 400 Perth businesses on the the CBD, and although this is only qualitative, the impact
effects of road based congestion. This survey showed on passenger’s modal utility and subsequent mode choice
clearly that congestion was having a significant impact is obvious. This is reflected in the growth in the patron-
on the operation of their businesses and staff. This is re- age of the Southern Rail line.
flected in Figure 10, which disturbingly shows that 82%
of business believed congestion was causing lost produc- 6. Perth Southern Suburbs Rail Operational
tivity and 74% believed it was reducing staff punctuality. Performance
This road based congestion on Perth’s road network is The overall Perth rail network has increased patronage
at its peak on the northern Mitchell freeway and southern by 83% from 2007 to 2012, (sees Figure 11). The tran-
Kwinana freeway, both of which are served by the high sport business case for the Perth Southern Suburbs rail
speed rail network, and it is argued that it is this road line was developed for the WA State government, by the
based congestion and high speed nature of the competing consulting firm Sinclair Knight Merz (SKM) initially
rail journeys that is driving the modal shift over the pub- in 1999, and then this model was independently re-
lic transport in the Northern and in particular Southern viewed by Planning and Transport Research Centre in
catchments. WA (PATREC) in 2004 [2].
Table 1 qualitatively presents the generalized costs for Neither SKM nor PATREC were able to model how
a private vehicle and public transport “Journey to Work” successful the Southern Rail Line would be at attracting
Copyright © 2013 SciRes. JTTs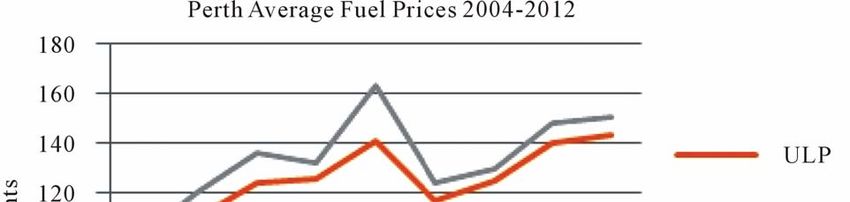
44                                                                     J. MCINTOSH         ET AL.

patronage from the low density southern suburbs of Perth                                  the network (Figure 11).
(as shown in Figure 2), as SKM’s 2031 patronage fore-
cast for the project was exceeded in the Southern Rail’s                                  7. Lessons of Fast Rail for Low Density
first year of operation. The significantly more optimistic                                   Cities
patronage model prepared by PATREC [2] (shown as
PATREC Rail in Figure 11) still underestimates the im-                                    One of the most contentious debates in public transport
pact of the patronage from the Southern Rail line, where                                  planning is the role of transfer costs in deterring patron-
the estimated 2021 total annual boardings for the net-                                    age due to time losses. This has been used to stop many
work were exceeded in 2012.                                                               rail projects [18,19]. The Southern Rail was designed to
   Indeed the 2031 patronage forecast for the line and the                                minimize transfer penalties by well-integrated bus inter-
greater Perth rail network is likely to be exceeded in                                    changes and bus services. As a result these are responsi-
2014/2015 assuming that rail line does not get affected                                   ble for 85% of the patronage, a figure much higher than
by a capacity constraint incurred by insufficient rolling                                 for most rail systems. This seems to be acceptable to the
stock provision which subsequently limits the growth of                                   patrons as the speed of the train means that the overall

                                     Table 1. Qualitative generalised cost inputs for the perth southern rail mode choice model.
                     Time/$Cost         Private     Public
                                                                                                           Discussion
                      Attribute        Transport   Transport
                                                                          Low time cost to access PT due to the options to get the Southern Railway;
                    Access time           nil         low
                                                                                  High frequency feeder services; Park and ride at stations
                                                                       The high frequency of feeder and southern rail services during peak times mean
                    Waiting time          nil         low
                                                                                                   minimal waiting time
                                                                   In peak times private vehicles are not competitive with the Southern Rail as the Kwinana
 Time Cost

                      in vehicle
                                        medium        med         Freeway is relatively congested and is increasing. Combined bus plus rail in-vehicle travel
                     travel time
                                                                              times are therefore competitive with car-only times in peak periods
                                                                 The egress time from private vehicles is relatively high due to the dispersed nature of the city
                    Egress Time          high         low        and the limited parking available, the out of vehicle time is significant, whereas the Southern
                                                                            Rail has two stops in the city and is connected to the Free CAT Service
                                                                   Given the frequency of the feeder buses to the Southern Rail Stations, as well as the CAT
                    Transfer Time         nil         low              services in the Perth CBD (which might be used by private vehicle users to get
                                                                                from the car parking to work) the transfer time cost is minimal
                                                                 Given the distances travelled from the Southern Rail catchment to the CBD, fuel costs can be
                         fuel            high         nil          significant. Fuel is an increasing cost for private vehicles, with a 14% increase since the
                                                                        opening of the Southern Railway, and 47% since 2004 (presented in Figure 8)
                    wear & tear,
                                         high         nil          Ongoing driving of vehicles in congested environments increases vehicle wear and tear.
                     insurance
                                                                 After the introduction of the Perth Parking Management Act in 1999, car parking in the Perth
                                                                 CBD has been both constrained in number, and had a levy charged to it ($633.60/commercial
                    parking costs        high      P&R - Free
                                                                  space) [16] with the revenue hypothecated to the provision of Free Transit Zone within the
 $ Cost

                                                                    City of Perth Municipal Bounds. The Wilson Parking Rates are shown in Table 2 [17]
                        tolls             nil         nil               Currently there are no public road user tolls on any roads in Western Australia

                        fares             nil      low - med             The current fare structure for public transport trips is shown in Figure 10 [7]
                                                                The introduction of the electronic ticketing system enabled zero cost transfer penalty between
                                                                the bus and rail modes, hence removing any transfer cost penalty associated with transferring
                    Transfer Cost         nil         nil        between modes. The zone based fare structure also means that the majority of the feeder bus
                                                                trips to the Southern Rail stations are intra zonal trips and are therefore nil cost to the overall
                                                                                   trip cost. See Figure 11 for the Transperth zone map [7]
                        Road             Very                    The impact of Road Congestion has been significant for road users and is significant in the
                                                      low
                     Congestion          High                                       modal distribution for the Southern Railway catchment
                       Public                                    Public transport crowding on the Southern rail and its feeder services is increasing, and this
 Opportunity Cost

                      Transport           nil         med             issue will continue until more rolling stock is added to the line during peak times.
                      crowding                                                                   (illustrated in Figure 9, [15])
                                                                     The positive utility of rail based public transport travel time is becoming increasingly
                    Ability to use
                                                                 noticeable with the introduction of electronic media and devices. A major change in this area
                     travel time
                                                                was the introduction of WIFI onto the Southern Rail line, thus enabling passengers to work and
                    productively          low         high
                                                                 conduct online leisure activities on their journey to and from work. This is a major change in
                     for work or
                                                                  how public transport travel time is viewed when compared to private vehicle use where this
                       leisure
                                                                          time is dedicated to the purpose of driving on increasingly congested roads

Copyright © 2013 SciRes.                                                                                                                                       JTTs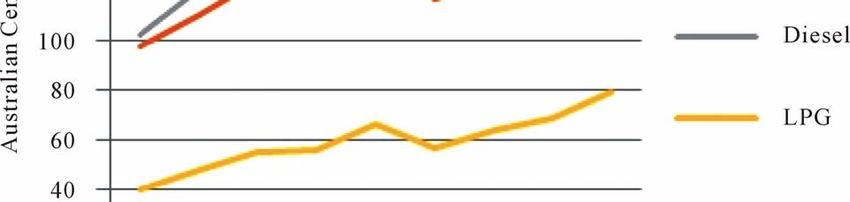
J. MCINTOSH      ET AL.                                                   45

Figure 11. (Top) The Perth rail network lines annual patronage from 2004-2012 [4]; (Middle) Annual Perth rail network
passenger boardings by line 2011-2012 [9]; (Bottom) Perth rail network annual patronage forecasts for the business case for
the Southern Suburbs rail line [2,9], and the actual network patronage since the commencement of operation (purple line)
with a propagation of the existing patronage into the future to be used to predict infrastructure capacity limitations (blue
line). The red dashed cross over the graph illustrates that the rail network system 2031 patronage as specified [2] though this
network patronage will be achieved in 2015 if current patronage growth continues (subject to capacity constraints).

Copyright © 2013 SciRes.                                                                                                 JTTs
46 J. MCINTOSH ET AL.
journey saves time compared to the private vehicle. Australian Department of Transport and Western Austra-
There would appear to be a lesson here for all rail lian Public Transport Authority for their support in pro-
planning but especially high speed rail: it is essential to viding data for this research.
minimize transfer penalties and create speeds that mean
the generalized costs of choosing to travel on fast rail are
REFERENCES
lower than the alternatives (car, bus or plane).
The Perth Southern Rail Line has maintained a strong [1] R. Waldock, P. Martinovich, A. Cartledge and R. Hamil-
focus on the competitiveness of the public transport ton, “New Metro Rail Project—Lessons Learned May
2008,” Public Transport Authority, Perth, 2003.
against the private motor vehicle in a time and financial
http://www.ceiid.wa.gov.au/Docs/KNF_200805/MAY08-
generalized cost model for access from the southern sub- NewMetroRailProject.pdf
urbs to the Perth CBD and the rest of the rail network.
[2] PATREC, Perth’s South West Metropolitan Railway—
This is illustrated by: Balancing Benefits and Costs Report for the Public Trans-
The competitiveness of the train to the car in time due port Authority of Western Australia by the Planning and
to the high speed of the trains (maximum speed 137 Transport Research Centre, 2004.
km/hr) compared to the car (freeway speed limit 100 [3] Western Australian Department of Planning, Directions
km/hr). 2031 and Beyond, Metropolitan Planning and Beyond the
The congested nature of the competing Kwinana Horizon, 2013.
Freeway, which is increasing with peak hour travel http://www.planning.wa.gov.au/dop_pub_pdf/plan_direct
speeds being much lower than the theoretical speed ions2031_part1.pdf
limit. [4] Western Australia Department of Transport, “Transperth
The frequency of the feeder bus services and the ease Train Network,” Train Boardings by Station on an Aver-
age March Weekday, 2011.
and speed of interchange between the bus and rail
modes, minimizing the time penalty for transferring- [5] Vuchic, “Urban Transit—Operations, Planning and Eco-
nomics,” John Wiley & Sons, Inc., Hoboken, 2005, pp.
between modes 456-457.
The introduction of the electronic ticketing system
[6] Google Earth Image, 2013.
that enabled zero cost transfer between the bus and
rail modes, hence removing any transfer cost penalty [7] Transperth, 2011.
http://www.transperth.wa.gov.au/TicketsandFares.aspx
associated with transferring between modes.
The majority of the feeder bus services that transfer to [8] Wikipedia, Murdock Railway Station Photos, 2013.
http://en.wikipedia.org/wiki/Murdoch_railway_station
the rail stations do very quickly and conveniently, and
operate within the single transport ticketing zones, [9] Western Australia Department of Transport, “Daily Rail
Patronage Data from the Perth Rail network,” 2012.
therefore not adding to the trip cost for the overall
journey. [10] Google Earth, Image Downloaded from Google Earth,
2012.
This model for the minimization of public transport
generalized cost when compared to the private vehicle [11] Australian Transport Council, “National Guidelines for
has enabled Perth Southern Suburbs rail line to be very Transport System Management in Australia, Volume 3—
Appraisal of initiatives,” 2006.
competitive with the private vehicle in a region where the http://www.atcouncil.gov.au/documents/files/National_G
Southern Rail Line is located. This area is where the pri- uidelines_Volume_3.pdf
vate vehicle has been historically extremely dominant [12] Y. Crozet, “Time and Passenger Transport’ Round Table
due to low dwelling and population density, and long 127: Time and Transport,” 2005.
travel distances for the journey to work. http://halshs.archives-ouvertes.fr/docs/00/19/45/83/PDF/
The low generalized cost network design minimizes ECMT_CROZET.pdf
the time and financial cost for the multimodal trip and [13] C. Papacostas and P. Prevedouros, “Mode Choice,” Trans-
induces traditionally car based ridership onto the transfer portation Engineering & Planning, pp. 391-399.
designed feeder services to the stations, and this is the [14] Western Australia Department of Commerce and Finance,
key success for the intermodal public transport model “Perth Fuel Prices,” 2012.
that operates for the Southern Rail Line. http://www.commerce.wa.gov.au/Corporate/Media/statem
The application of the Southern Rail model to the de- ents/2012/December/Perth_fuel_prices_highest_in_2012.
sign of high speed intra-city and regional rail for large, html
low density cities as well as very fast intercity train sys- [15] RACWA, “RACWA Business Wise Congestion Survey,”
tems would appear to be clear. 2012.
http://rac.com.au/Motoring/Roadside-Assistance/For-your
-business/~/media/Businesswise/Businesswise_congestio
8. Acknowledgements n_survey2012_V2.ashx
The authors would like to thank members of the Western [16] Western Australia Department of Transport, “Perth Park-
Copyright © 2013 SciRes. JTTsJ. MCINTOSH ET AL. 47
ing Management Act, 1999,” 2013. ment,” Road and Transport Research, Vol. 8, No. 3, 1999,
http://www.transport.wa.gov.au/mediaFiles/DOT_R_Park pp. 3- 21.
Pol.pdf [19] G. Currie, “Research Perspectives on the Merits of Light
[17] Wilson Parking, “Parking Rates for the Queens Complex Rail versus Bus,” Presentation from the BITRE Collo-
in the Perth CBD,” 2013. quium, 18-19 June 2009.
http://www.wilsonparking.com.au/go/wilson-car-parks/w http://www.infrastructureaustralia.gov.au/publications/file
a/queens-complex s/LightRailVSBus.pdf
[18] D. Hensher, “A Bus-Based Transit Way or Light Rail?
Continuing the Saga of Choice versus Blind Commit-
Copyright © 2013 SciRes. JTTsYou can also read