Second Quarter 2020 Earnings Presentation - 27 August 2020 - BW LPG
←
→
Page content transcription
If your browser does not render page correctly, please read the page content below

Second Quarter 2020
Earnings Presentation

          27 August 2020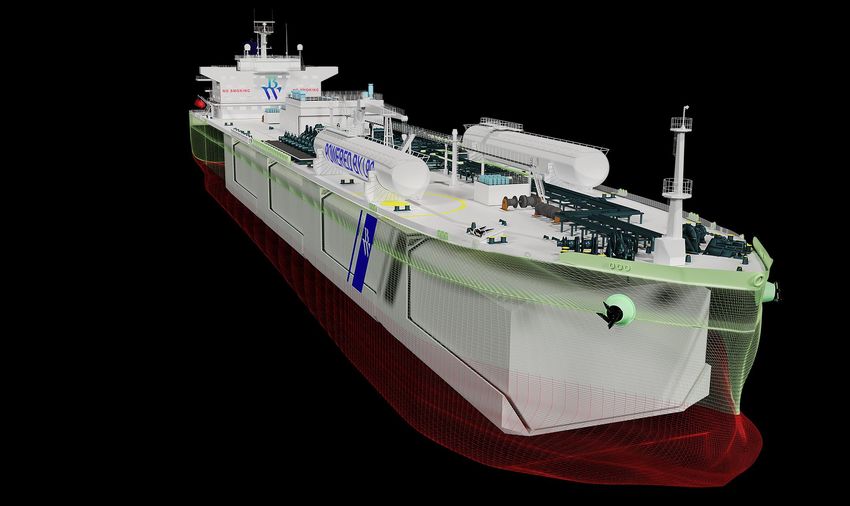
Disclaimer and Forward-looking Statements
This presentation has been produced by BW LPG Limited (“BW LPG”) exclusively for information purposes. This presentation may not be reproduced or redistributed, in whole or in part, to any other person.

Matters discussed in this presentation and any materials distributed in connection with this presentation may constitute or include forward–looking statements. Forward–looking statements are statements that are not historical
facts and may be identified by words such as “anticipates”, “believes”, “continues”, “estimates”, “expects”, “intends”, “may”, “should”, “will” and similar expressions, such as “going forward”. These forward–looking statements
reflect BW LPG’s reasonable beliefs, intentions and current expectations concerning, among other things, BW LPG’s results of operations, financial condition, liquidity, prospects, growth and strategies. Forward–looking
statements include statements regarding: objectives, goals, strategies, outlook and growth prospects; future plans, events or performance and potential for future growth; liquidity, capital resources and capital expenditures;
economic outlook and industry trends; developments of BW LPG’s markets; the impact of regulatory initiatives; and the strength of BW LPG’s competitors. Forward–looking statements involve risks and uncertainties because
they relate to events and depend on circumstances that may or may not occur in the future. The forward–looking statements in this presentation are based upon various assumptions, many of which are based, in turn, upon
further assumptions, including without limitation, management’s examination of historical operating trends, data contained in BW LPG’s records and other data available from Fourth parties. Although BW LPG believes that
these assumptions were reasonable when made, these assumptions are inherently subject to significant known and unknown risks, uncertainties, contingencies and other important factors which are difficult or impossible to
predict and are beyond its control. Forward–looking statements are not guarantees of future performance and such risks, uncertainties, contingencies and other important factors could cause the actual results of operations,
financial condition and liquidity of BW LPG or the industry to differ materially from those results expressed or implied in this presentation by such forward–looking statements. No representation is made that any of these
forward–looking statements or forecasts will come to pass or that any forecast result will be achieved and you are cautioned not to place any undue influence on any forward–looking statement.

No representation, warranty or undertaking, express or implied, is made by BW LPG, its affiliates or representatives as to, and no reliance should be placed on, the fairness, accuracy, completeness or correctness of the
information or the opinions contained herein, for any purpose whatsoever. Neither BW LPG nor any of its affiliates or representatives shall have any responsibility or liability whatsoever (for negligence or otherwise) for any loss
whatsoever and howsoever arising from any use of this presentation or its contents or otherwise arising in connection with this presentation. All information in this presentation is subject to updating, revision, verification,
correction, completion, amendment and may change materially and without notice. In giving this presentation, none of BW LPG, its affiliates or representatives undertakes any obligation to provide the recipient with access to
any additional information or to update this presentation or any information or to correct any inaccuracies in any such information. The information contained in this presentation should be considered in the context of the
circumstances prevailing at the time and has not been, and will not be, updated to reflect material developments which may occur after the date of the presentation.

The contents of this presentation are not to be construed as legal, business, investment or tax advice. Each recipient should consult its own legal, business, investment or tax adviser as to legal, business, investment or tax
advice. By attending this presentation you acknowledge that you will be solely responsible for your own assessment of the market and the market position of BW LPG and that you will conduct your own analysis and be solely
responsible for forming your own view on the potential future performance of the business of BW LPG. This presentation must be read in conjunction with the recent financial information and the disclosures therein.

This presentation and the information contained herein are not an offer of securities for sale in the United States and are not for publication or distribution to persons in the United States (within the meaning of Regulation S
under the U.S. Securities Act of 1933, as amended (the “Securities Act”)). The securities referred to herein have not been and will not be registered under the Securities Act and may not be offered or sold in the United States
except pursuant to an exemption from the registration requirements of the Securities Act. Any failure to comply with this restriction may constitute a violation of United States securities laws. BW LPG has not registered and does
not intend to register its securities in the United States or to conduct a public offering of shares in the United States. Copies of this presentation are not being made and may not be distributed or sent, directly or indirectly, in or
into the United States, Canada, Australia or Japan, or any other jurisdiction in which such distribution would be unlawful or would require registration or other measures.

In any EEA Member State other than Norway that has implemented Directive 2003/71/EC (as amended, together with any applicable implementing measures in any Member State, the “Prospectus Directive”), this presentation
is only addressed to and is only directed at qualified investors in that Member State within the meaning of the Prospectus Directive.

For the UK based investors–This presentation is only being distributed to and is only directed at persons in the United Kingdom that are (i) investment professionals falling within Article 19(5) of the Financial Services and
Markets Act 2000 (Financial Promotion) Order 2005, as amended (the “Order”) or (ii) high net worth entities, and other persons to whom this presentation may lawfully be communicated, falling within Article 49(2)(a) to (d) of the
Order (all such persons together being referred to as “relevant persons”). This presentation must not be acted on or relied on by persons who are not relevant persons. Any investment or investment activity to which this
presentation relates is available only to relevant persons and will be engaged in only with relevant persons.

                                                                                                                                                                                                                                        2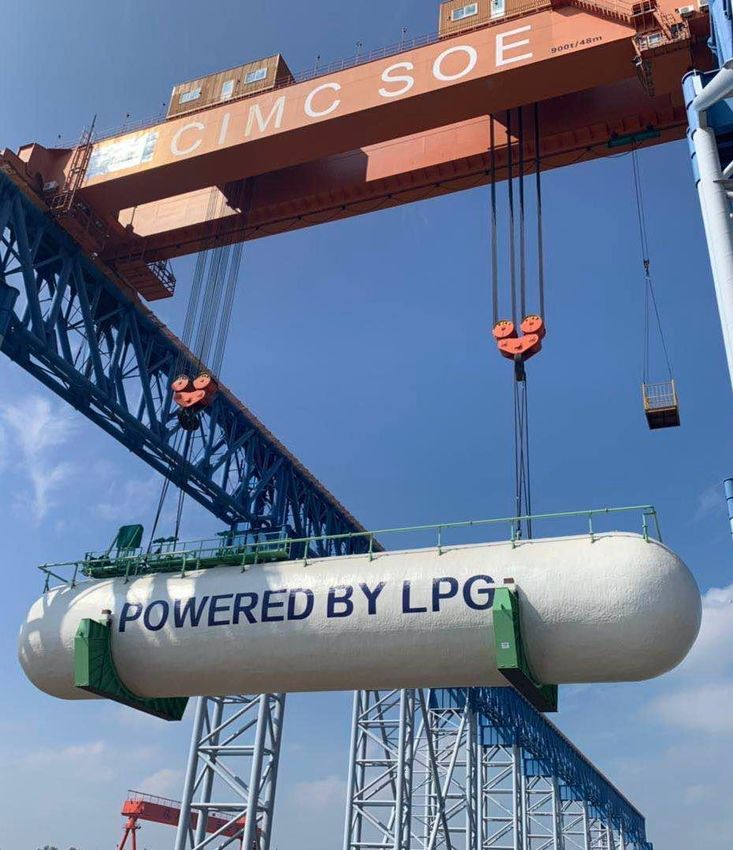
1. Highlights
AGENDA
         2. Market Review

         3. Commercial Update

         4. Technical Update

         5. Financial Update

         6. Summary & Outlook

         7. Q & A
Highlights
▪ Achieved Q2 2020 VLGC freight rates of USD 39,100 per day with a high fleet
  utilisation of 97%

▪ Generated Q2 2020 net profit after tax of USD 62 million or an earnings per share of
  USD 45 cents. For H1 2020, the net profit after tax was USD 143 million with an
  earnings per share of USD 1.03

▪ H1 2020 annualised return on equity of 24% with USD 300 million of free cash flow

▪ Declared Q2 2020 cash dividend of 15 cents per share amounting to USD 21 million,
  giving a YTD payout ratio of 34% of NPAT

▪ Retrofitting world’s first LPG dual-fuel engine on BW Gemini and BW Leo, taking the
  lead and advancing technology towards zero-carbon fuel propulsion

▪ Fully committed to 12 conversions, given the substantial environmental benefits of
  retrofits compared to newbuildings, as confirmed by DNV

▪ Collaboration with Hafnia on bunker procurement. Hafnia supports bunkering of over
  450 ships, bringing economies of scale and best in class logistics to BW LPG

                                                                                         4
Key Financials
Focus on fleet utilisation led to strong returns for shareholders
                                                              Q2 2020             Q2 2019              H1 2020              H1 2019              ▪ Fleet-wide VLGC freight rates averaged
                                                                                                                                                   USD 39,100 per day
VLGC Daily TCE1                                               $39,100              $27,500              $40,700             $21,300
VLGC Daily OPEX2                                                 $7,100              $7,300               $7,400              $7,300                 ▪   Spot earnings of USD 41,100 per day
                                                                                                                                                     ▪   Time charter earnings of USD 34,300
TCE income (in USD million)                                           149                  111                 311                  171                  per day
EBITDA (in USD million)                                               113                    75                239                    95         ▪ Profit for Q2 was USD 62 million, with a
Profit after tax (in USD million)                                       62                   26                143                      3          21% annualised return on equity
EPS3                                                                 0.45                0.19                 1.03                0.02           ▪ Earnings per share of USD 45 cents,
                                                                                                                                                   with a 58% annualised earnings yield
Earnings Yield4 (Annualised)                                      57.5%               15.3%                66.0%                 0.8%
ROE5 (Annualised)                                                 21.2%               11.1%                24.1%                 0.6%            ▪ Net leverage ratio decreased from
                                                                                                                                                   50.2% at the end of 2019 to 46.2% at
ROCE5(Annualised)                                                 11.9%                 7.3%               13.8%                 2.9%              the end of Q2 2020
EBITDA Margin6                                                    75.7%               67.3%                76.9%               55.8%
Net leverage ratio7                                               46.2%               57.8%                46.2%               57.8%

[1] TCE rates per day presented above are inclusive of both commercial waiting and technical offhire days (i.e. 100% of calendar days)
[2] Prior period includes LGC in the fleet
[3] EPS (earnings per share) is computed based on the weighted average number of shares outstanding less treasury shares during the period
[4] Earnings yield is computed as EPS divided by the share price at the end of the period in USD terms
[5] ROE (return on equity) and ROCE (return on capital employed) is computed based on the average equity and capital employed at the end and beginning of the period
[6] EBITDA Margin is computed as EBITDA over TCE Income
[7] Net leverage ratio is computed as total debt less cash over total debt less cash plus equity.                                                                                              5
MARKET REVIEW
VLGC Market Outlook
Medium term market outlook sensitive to oil price expectations
                             LPG Supply                          LPG Demand                      Fleet Capacity                         Freight Rates
                          Exports are supported by:            Imports are supported by:        Global VLGC fleet capacity:       Near term rates are supported by:

                      ▪ US: High LPG production             ▪ Recovering petrochemical       ▪ 17 vessels have been               ▪ Slow steaming
 Short term

                        (despite falling oil production),     demand in Asia and Europe        delivered as of 30 July; global
 (Q3 2020)

                                                                                                                                  ▪ Longer voyage routes from the
                        high LPG inventory, and               from steam cracking              VLGC fleet stands at 299
                                                                                                                                    US to Asia via Cape of Good
                        reduced domestic consumption
                                                            ▪ Recovering retail demand in    ▪ Four VLGCs expected to be            Hope
                      ▪ Middle East: Recovery in              India and Southeast Asia         delivered in 2020; no vessels
                                                                                                                                  ▪ Heavy dry dock schedules
                        exports as OPEC+ adjusting                                             are expected to be recycled
                                                            ▪ Incremental demand in China
                        production cuts from 9.7mbpd                                                                              ▪ Recovering demand from
                                                              from newly commissioned        ▪ Over 9% of global fleet
                        to 7.7mbpd for rest of 2020                                                                                 Europe and Asia
                                                              PDH and steam cracking           scheduled for special survey
                                                              plants

                          Exports are impacted by:              Imports are impacted by:     ▪ Newbuild orderbook until end       ▪ A weaker outlook for US LPG
                                                                                               2022 currently stands at 11%         supply is expected to put
                      ▪ US: LPG production is highly        ▪ Demand from steam cracking       of total VLGC fleet                  downward pressure on vessel
 (Q4 2020 and 2021)

                        sensitive to oil price. Lower         which remains a swing factor                                          utilisation
                                                                                             ▪ Over 32% of global fleet
   Medium term

                        shale oil and gas production is       in LPG import demand
                                                                                               scheduled for special survey in    ▪ However, this is partly offset by
                        anticipated in the US due to
                                                                                               Q4 2020 and 2021                     heavy dry dock schedules and
                        current oil prices                     Imports are supported by:
                                                                                                                                    recovery in Middle East
                                                                                             ▪ >10% of total fleet will be over
                      ▪ Middle East: Fast recovery                                                                                  exports
                                                            ▪ Continued strong end user        27 years old by end 2022
                        expected in Middle East
                                                              demand driven by the green                                          ▪ Recovery to a higher oil price
                        exports as OPEC+ gradually                                           ▪ Some of these vessels will
                                                              trend towards cleaner energy                                          environment could also
                        increase oil production                                                likely be recycled in a lower
                                                                                                                                    support outlook
                                                            ▪ Incremental demand growth        rate environment
                                                              driven by PDH developments
                                                              in China
                                                                                                                                                                        7
Q2 2020 Seaborne LPG Trade Overview
Total seaborne LPG trade decreased 9% YoY, mainly driven by decreased exports from the Middle East
Quarterly seaborne LPG imports by country/region Comments
Q2 2019 Q2 2020 Imports
6 5.4
5.1 ▪ China LPG imports fell by 6% to 5.1 million tons (MT) in
Million tons (MT)
5 Q2. Retail demand from China has shown recovery, but
4 3.7 3.5
3.2
2.9 offset by lower demand from steam cracking
3 2.4 2.5 2.5
2.1 2.1 2.1
2 ▪ India retail demand surged in early Q2 due to COVID-19
1 lockdown. LPG imports increased by 16% to 3.7 MT
0
China India Japan Southeast South Korea Europe ▪ Europe LPG imports fell significantly by 41% to 2.1 MT,
Asia mostly driven by lower demand from steam cracking and
autogas
Quarterly seaborne LPG exports by country/region ▪ Japan LPG imports increased by 19% to 2.9 MT. South
Korea imports declined marginally by 1% to 2.1 MT
Q2 2019 Q2 2020
12 Exports
10.0 10.4 10.9
10 ▪ In Q2, total North American LPG exports reached 10.9
Million tons (MT)
8.8
8 MT, up 4% year over year. North American LPG exports by
6 VLGCs reached 9.6 MT, up 7% from a year ago
4 2.7
1.9 1.7 1.6
▪ Middle Eastern exports decreased by 12% YoY to 8.8 MT
2 0.9 0.9
due to OPEC+ production cuts at 9.7 million barrels per
0
Middle East North America Europe Mediterranean West Africa
day in May and June
Source: IHS Waterborne LPG, BW LPG analysis. Data includes seaborne LPG trade by all vessel sizes. 8US LPG Net Exports
EIA revised 2020 US LPG net exports to continue growing from 2019
US LPG snapshot
100 US Production US Domestic Consumption Net Exports + Net Exports YoY growth
80
Million tons (MT)
(+7) (+4) (-4)
(+3) 37 41 37
30
60 (+6) (+6) (+3)
18 24 27
12
87 87 84
40 78
66 68 71
60
44 46 45 43 47 47 44 46
20
0
2014 Actuals 2015 Actuals 2016 Actuals 2017 Actuals 2018 Actuals 2019 Actuals 2020 Forecast 2021 Forecast
Item / Year 2019 2020E 2021E
US LPG Production Growth 10.6% -0.1% -2.8%
US LPG Domestic Demand 0.7% -7.1% 4.7%
US LPG Net Export Growth 21.1% 12.7% -9.7%
Source: EIA Short-term Energy Outlook August Release
[1] Net exports includes land and waterborne. Land means LPG transported via pipeline, train, rail, trucks etc., waterborne refers to LPG transported by all vessel types on sea. 9Global LPG Demand – Long Term Trends
Global LPG demand is about 3 times larger than seaborne volumes
Global LPG demand grew to over 310 MT in 2018 Retail & chemicals contribute >70% of global demand
Retail Chemicals Industry 2018 Global LPG Demand by Sector
Transport Agriculture Refinery
350
8%
Retail
300
Million tons (MT)
8%
250 Agriculture
44% Industry
200
150 28% Chemicals
100 Transport
50 Refinery
11%
-
2010 2011 2012 2013 2014 2015 2016 2017 2018
Demand from all sectors grew except in agriculture China, India & Indonesia driving retail demand growth
2010 2018 CAGR 2010 - 2018 Retail demand change 2010 - 2018
160 15% 12
10.6%
CAGR 2010 – 2018 %
11% 10
Million tons (MT)
Million tons (MT)
120
8
3.3% 7%
80 2.1% 2.5% 1.7% 6
-0.7% 3%
4
40 -1% 2
0 -5% 0
Source: WLPGA, Argus, BW Analysis 10China LPG Demand – Long Term Trends
In Q2 2020, US LPG exports into China appears to have normalised
Chinese LPG demand has grown to over 50 MT in 2018 Retail and chemicals contribute >70% of demand
Retail Agriculture Industry Chemicals Transport Refinery 2018 Chinese LPG Demand by Sector
60
1% 15% Retail
50
Agriculture
Million tons (MT)
40
Industry
30 18%
54% Chemicals
20
Transport
10 12%
Refinery
-
2010 2011 2012 2013 2014 2015 2016 2017 2018
Demand growth driven by retail, chemicals and refinery Key demand drivers
Chinese demand change 2010 -2018 Retail
12
Largest consuming segment in China. Demand is expected to continue to increase
10 10
10 with growing population and economy
8
8
Million tons (MT)
Chemicals
6 Steam cracking and PDH demand lead the growth for Chinese LPG demand with
waves of crackers and PDH plant developments
4
2 Refinery
2
0 0 A major growth area for butane demand in China with significant investments over
0 the past years in refinery applications
Retail Agriculture Industry Chemicals Transport Refinery
Source: WLPGA, Argus, BW Analysis 11VLGC Fleet Profile
299 ships on the water with 6 vessels delivered in Q2 2020. Orderbook at 34 ships or 11% of global fleet
Global VLGC fleet profile — average age of 9.9 years BW LPG VLGC market share3 of 15%
Delivered VLGCs Recycled VLGCs VLGCs on orderbook Other VLGC NB
Recycling candidates VLGC count at year end 34
50 400
318 326
303
265 282 BW LPG
241 260 300
40 VLGC Fleet
199 46
156 164 200
141 143
Number of VLGC
30
100
44
20 4
35 0
10 21 19 Third party VLGC
17 17 -100 253
13 10 11 fleet on water
8
0 3 2
-200
-10 -300
2011 2012 2013 2014 2015 2016 2017 2018 2019 2020 2021 2022
37 Owned VLGCs 1
9 Time chartered VLGCs 46 vessels
Source: BW LPG analysis, Clarksons
[1] Owned VLGCs includes 1 bareboat vessel and 2 vessels 50% owned by a Joint Venture
[2] Data as of 3 August 2020 12
[3] Market share based on ships on waterCOMMERCIAL UPDATE
Responding to Market Volatility and Disruptions
        Demonstrated resilience and agility

           Q2 Market Volatility                                                    Our Response                                                                Q3 Commercial Coverage

     OPEC+ started historic
                                                                         Positioned our vessels away
     production cuts in May. Exports                                                                                                                 We have fixed approximately 80% of our Q3
                                                                         from the Middle East and
     from Middle East declined by                                                                                                                    fleet wide available days at an average rate
                                                                         directed our vessels to the US
     12% yoy in Q2                                                                                                                                   above USD 27,000 per day, on a discharge to
                                                                                                                                                     discharge basis1

     WTI oil price even went                                             Focused on high commercial
     negative, dampening the global                                      utilisation with Product Services
                                                                                                                                                           V-shape Recovery in Freight Rates
     trading activities                                                  lifting cargoes
                                                                                                                                                                                    TCE $/day
                                                                         Reduced fleet capacity by slow                                           70,000

     European import demand came                                         steaming and sailing a longer                                            60,000
     to a halt due to the lock-down                                      route through the Cape of Good                                           50,000
     measures                                                            Hope instead of via the

                                                                                                                                          $/day
                                                                                                                                                  40,000
                                                                         Panama Canal                                                             30,000
                                                                                                                                                  20,000
     Surge in retail demand in
                                                                         Increased our time charter                                               10,000
     countries such as India and
                                                                         coverage from 5% to 14% for                                                  0
     Brazil caused inefficiencies                                                                                                                     Jan-20   Feb-20   Mar-20   Apr-20   May-20   Jun-20   Jul-20   Aug-20
                                                                         2021
     due to delays in discharge ports

[1] For financial reporting purposes, voyages are accounted for on a load to discharge basis in accordance with International Financial Reporting Standards                                                                   14
Commercial Performance
Achieved 97.2% commercial utilisation in Q2; generated TCE revenue of USD 39,100 per calendar day
Calendar Days Available Days
Availability
99.3%
71.6%
Spot
$42,7003
(excl. waiting time)
$41,1002
(incl. waiting time)
$39,100 $39,400
per day1 per day2
25.6% Time Charter
$34,300
Offhire
0.7%
Waiting
2.8%
Commercial Utilisation4
[1] TCE rates per day are inclusive of both commercial waiting and technical offhire days (i.e. 100% of calendar days)
[2] TCE rates per day are inclusive of commercial waiting days and exclusive of technical offhire days (i.e. 100% of available days) 97.2%
[3] TCE rates per day are exclusive of both commercial waiting and technical offhire days
[4] Commercial Utilisation is calculated with available days. Using calendar days (i.e. including technical offhire days), utilisation was 97%
[5] All calculations and ratios exclude finance lease vessels 15Time Charter Portfolio Overview FREIGHT RATES
Time charter-out coverage for 2020 at 25% at an average rate of USD 33,300 per day
1 Time charter out 2 Time charter in
Quarterly Yearly Quarterly Yearly
30%
28%
26% 25%
19%
15% 15% 14% 15% 15% 15% 15% 15%
13% 13% 14% 14% 14%
13%
10%
19 33 34 33 21 14 12 10 120 57 13 14 15 14 14 14 14 12 57 55
Q1 20 Q2 20 Q3 20 Q4 20 Q1 21 Q2 21 Q3 21 Q4 21 2020 2021 Q1 20 Q2 20 Q3 20 Q4 20 Q1 21 Q2 21 Q3 21 Q4 21 2020 2021
Revenue in USD millions % of total available days of the whole fleet Cost in USD millions % of total calendar days of the whole fleet
3 Time charter rates (USD thousands/day) 4 Net time charter position
Quarterly Yearly 2020 2021
% of total Revenue/ % of total Revenue/
fleet2 (Cost) fleet2 (Cost)
34.6 34.3 33.3
31.9 33.0
31.0
28.5 TC out 25% $120m 14% $57m
27.3 27.0 27.5
26.5 26.5 27.0 26.4 26.3
TC in 14% ($57m) 14% ($55m)
26.4 26.1 26.1 26.1 26.1
Net position $63m $2m
Q1 20 Q2 20 Q3 20 Q4 20 Q1 21 Q2 21 Q3 21 Q4 21 2020 2021
Avg. TC out rate Avg. TC in rate
[1] Data as of 30 June 2020 [2] % of fleet ratio is basis: TC out is based on total available days and TC in is based on total calendar days 16TECHNICAL UPDATE
Technical Highlights
Planned drydocks and retrofittings remain largely on track, crew contract overruns trending down

                       LPG dual-fuel retrofitting                                                    Scrubber installations                                                       Crew changes

 ▪ Retrofitting of BW Gemini has                                               ▪ Five vessels fitted with scrubbers                                             ▪ Crew changes remain challenging;
   commenced with BW Leo shortly after                                         ▪ Final scrubber installation in October                                           highly dependent on local regulations
 ▪ Two more VLGC conversions in 2020                                             2020; local quarantine requirements                                            ▪ Contract overrun trend on the decline
   and eight in 2021. 12 in total.                                               planned into schedule                                                          ▪ Crew mental health a top priority;
 ▪ LPG dual-fuel technology is a first                                         ▪ Operation of scrubbers on vessels                                                crew given additional bonuses and
   step towards Ammonia propulsion and                                           without commercial disruption                                                    support
   zero carbon emission
                  Projected fleet capital expenditures (capex)1                                                                                Fuel price differentials between LPG and other fuels
                                                                                                                                                          Heavy fuel - Propane            Compliant fuel - Propane
                                                               2020                  2021                  Total
                                                                                                                                                   500
 Maintenance capex                                            $20m                  $33m                  $53m                                     400

                                                                                                                              USD per Metric ton
                                                                                                                                                   300
 Upgrade capex2                                               $41m                  $72m                 $113m
                                                                                                                                                   200                                                                        147
                                                                                                                                                                                                                        111
 Total capex                                                  $61m                 $105m                 $166m                                     100
                                                                                                                                                     0
 Capex paid as at 30 June 2020                               ($31m)                ($20m)                ($51m)
                                                                                                                                                   -100
 Remaining capex to be paid                                   $30m                  $85m                 $115m

[1] As at 30 June 2020
[2] Upgrade capex includes the retrofitting of dual-fuel LPG propulsion engines, scrubbers, and other upgrades
[3] Fuel price differentials: Source: Platts, Bloomberg. US Mont Belvieu spot price for LPG + fixed terminal fee of USD 26/ton, Historical fuel prices is Panama historical prices + USD 15/ton delivery cost. Future          18
fuel oil prices are Bloomberg fair value price for US Gulf Coast + USD 15/ton delivery fee + USD 30 price premium as an estimate of Panama delivered cost.
FINANCIAL UPDATE
Income Statement
  Income statement (Figures in USD thousands)                                                                             Q2 2020                    Q2 2019                    H1 2020                    H1 2019

  Net income from spot voyages                                                                                                 116,243                     92,486                    256,497                       132,980
  Net income from time charter voyages                                                                                          33,217                     18,359                     54,920                        38,071
  TCE income                                                                                                                   149,460                    110,845                    311,417                       171,051

  Net (loss)/gain from commodity contracts                                                                                        (997)                       500                      (469)                        500
  Vessel operating expenses1                                                                                                   (25,692)                  (26,797)                   (55,328)                   (55,059)
  General and administrative expenses                                                                                           (4,549)                   (6,095)                   (10,721)                   (13,029)
  Charter hire expenses                                                                                                         (4,384)                   (3,920)                    (6,291)                    (8,270)
  Finance lease income                                                                                                              503                         -                      1,060                          -
  Other operating (expenses)/income – net                                                                                       (1,247)                       106                      (247)                        154
  Operating profit before depreciation, amortisation and impairment (EBITDA)                                                   113,094                     74,639                   239,421                      95,347

  Depreciation charge                                                                                                          (38,112)                  (32,036)                   (76,251)                   (63,865)
  Amortisation charge                                                                                                               (52)                        -                        (65)                         -
  Gain on disposal of assets held-for-sale                                                                                             -                        -                      5,273                      1,783
  Impairment charge on right-of-use assets (vessels)                                                                            (4,200)                         -                    (4,200)                          -
  Operating profit (EBIT)                                                                                                        70,730                    42,603                   164,178                      33,265

  Finance expense – net                                                                                                         (9,687)                  (15,881)                   (23,422)                   (29,939)
  Share of profit of a joint venture                                                                                              1,279                         -                      2,492                          -
  Profit before tax for the financial period                                                                                    62,322                     26,722                   143,248                       3,326

  Income tax expense                                                                                                             (252)                      (246)                      (573)                         (394)
  Profit after tax for the financial period (NPAT)                                                                              62,070                     26,476                    142,675                         2,932

  Fair value changes on interest rate hedges                                                                                    (2,281)                  (12,236)                   (30,126)                   (20,895)
  Fair value changes on forward freight agreements and bunker hedges                                                              3,581                   (1,126)                   (11,537)                    (1,825)
  Currency translation reserve                                                                                                      (17)                        -                      (228)                          -
  Total comprehensive income/(loss) for the financial period                                                                    63,353                     13,114                   100,784                    (19,788)
[1] Vessel operating expenses include maintenance, crew, insurance, and vessel management costs, as well as time charter-in non-lease components in line with IFRS 16. The costs incurred are for 36.4 owned and
bareboat vessels and 4.8 time charter in vessels                                                                                                                                                                         20   20
Balance Sheet and Cash Flows
Balance sheet (Figures in USD thousands)                                                      30 June 2020      31 December 2019
Vessels and dry docking                                                                            1,847,502             1,903,622
Other non–current assets                                                                             238,953               257,754
Total current assets                                                                                 387,342               387,980
Total assets                                                                                       2,473,797             2,549,356

Total shareholders’ equity                                                                         1,190,393             1,177,313
Total non–current liabilities                                                                        975,794             1,102,044
Total current liabilities                                                                            307,610               269,999
Total liabilities                                                                                  1,283,404             1,372,043
Total equity and liabilities                                                                       2,473,797             2,549,356

Cash flows (Figures in USD thousands)                                Q2 2020      Q2 2019         H1 2020                H1 2019
Cash flows from operating activities
Profit before tax for financial period                                  62,322      26,722           143,248                 3,326
Adjustments and changes in working capital                              50,969      10,429           111,659                69,267

        Net cash provided by operating activities                      113,291      37,151           254,907                72,593

        Net cash provided by/(used in) investing activities              9,566      (4,479)           45,175                 3,061

        Net cash used in financing activities                         (218,412)    (18,888)         (310,466)              (73,807)

        Net (decrease)/increase in cash and cash equivalents           (95,555)     13,784           (10,384)                1,847
        Cash and cash equivalents at beginning of financial period     178,696      38,138            93,525                50,075
        Cash and cash equivalents at end of financial period            83,141      51,922            83,141                51,922

                                                                                                                                  21
Financial Highlights
Net profit on the rebound Positive EBITDA through cycle lows
400
326 500
300 274
256
400
USD millions
USD millions
200
126 143
300
100
200 430 399
24
(45) (72) 340
0 239
100 210
136 126 104
(100)
0
2013 2014 2015 2016 2017 2018 2019 YTD
2020 2013 2014 2015 2016 2017 2018 2019 YTD 2020
Available liquidity and net leverage ratio FY2020 operating cash breakeven1
Cash Undrawn Facility Net Leverage Ratio
USD/day
400 100%
300
Owned fleet – operating cash breakeven1 20,500
Net Leverage Ratio
80%
300 245 150
USD millions
200
150 210 55% 60% Total fleet – operating cash breakeven1 21,600
200 143
54% 54% 165
125 50% 49% 40%
40%
46%
All in cash breakeven2 23,700
100 34%
30% 179 20%
111 94 94
70 81 83
57 50 [1] Cash breakeven = Total cash costs (excluding capex) / Available days owned fleet or total fleet
0 0% [2] All in cash breakeven includes all cash costs including maintenance capex and the equity portion of fleet
2013 2014 2015 2016 2017 2018 2019 Q1-20 Q2-20 upgrade capex
22Financing Structure and Repayment Profile
No major balloon payments in the next five years
Financing Structure2,3 Repayment profile2
Utilised Trade Finance
Facilities 500 Trade Finance Facilities - o/s $13m
Lease Liabilities - o/s $215m
$290m ECA 2028 - o/s $231m
400 $150m Term loan 2023 - o/s $79m
$180m 351
$300m Revolving credit facility (RCF) - o/s $0m
Trade
USD millions
Finance $400m ECA 300 $158m Term loan 2026 - o/s $119m
Facilities $221m ECA 2029 - o/s $168m
$400m ECA 2028 - o/s $291m
200
150 147 155
$300m RCF
92 82
$221m ECA 100 75
64
0
$158m 2020 2021 2022 2023 2024 2025 2026 2027
Term Loan $290m ECA onwards
$150m Net Debt and Total Available Liquidity (USD million)
Term Loan
Net Debt 1,023
Undrawn amount under revolving credit facility 300
[1] As at 30 June 2020 Cash 83
[2] Excludes capitalised fees and interest payable
[3] Excludes lease liabilities Total available liquidity 383 23SUMMARY & OUTLOOK
Summary & Outlook
Summary
▪ Q2 2020 Net Profit after Tax of USD 62 million, resulting in an Earnings per Share of USD 45 cents
▪ Declared Q2 2020 cash dividend of 15 cents per share amounting to USD 21 million, giving a YTD payout ratio of 34% of NPAT

Events occurring after 30 June 2020
▪ Concluded the sale and delivery of Berge Summit – generating USD 9 million in liquidity and a net gain of USD 4 million
▪ BW Gemini has begun her LPG dual-fuel engine retrofitting and BW Leo will start shortly after – they will be the first vessels on water
  with this pioneering technology. Through retrofitting, BW LPG is taking the lead and advancing technology towards zero-carbon
  propulsion in a manner that provides substantial environmental benefits compared to new buildings, and boosting an already efficient
  and clean fleet without adding capacity

Outlook
▪ Although VLGC freight rate collapsed at end-May, the market has shown a strong recovery towards end-July. The rate has increased to
  over USD 50,000 per day, a level last seen in early May
▪ Freight rate recovery is supported by recovering LPG exports, firming import demand from Europe and Asia, and significant reductions
  in fleet supply due to slow steaming of vessels and longer voyage routes from the US to Asia via Cape of Good Hope
▪ In the medium term, there is downward pressure on US LPG supply following lower oil prices. This is partly offset by heavy dry docking
  schedules with over 40% of global fleet going to yards by end-2021, and a recovery in Middle East LPG production as OPEC oil
  production returns to pre-cut levels

                                                                                                                                  25
Q&A
Investor Relations
investor.relations@bwlpg.com

Telephone
+65 6705 5588

Ticker
BWLPG

Linkedin
https://sg.linkedin.com/company/bwlpg

Address
10 Pasir Panjang Road
Mapletree Business City #17-02
Singapore 117438
APPENDIX
Fleet Safety Statistics
Safety and Zero Harm onboard remain our key focus, especially during challenging times

1.60

1.40                                                        1.34
                                   1.20        1.17
1.20
                      1.05                                              1.07         1.07                                              1.06         1.06

1.00      0.94                                                                                   0.93        0.93         0.92

0.80                                                                                                                 TRCF 12 Month Rolling Average (MRA)

0.60
          0.40        0.39         0.40        0.39        0.40
0.40
                                                                        0.27        0.27         0.26        0.26         0.26        0.27          0.27
0.20                                                                                                                  LTIF 12 Month Rolling Average (MRA)

0.00
         Jul-19      Aug-19      Sep-19       Oct-19      Nov-19       Dec-19      Jan-20       Feb-20      Mar-20       Apr-20      May-20        Jun-20

Total Recordable Case Frequency (TRCF): number of fatalities and injuries that are work-related, per one million hours worked
Lost Time Injury Frequency (LTIF): number of fatalities and injuries in the workplace that leads to lost work time, per one million hours worked            29
Fleet Environmental Data1
Annual Efficiency Ratio (AER)2 Energy Efficiency Operational Indicator (EEOI)3
9.0 19.0 18.5
g CO2 / (deadweight ton ⋅
8.6 8.6 8.6 8.6
8.3 8.3 18.5 18.1 18.0
8.5 17.9
g CO₂ / (cargo ton ⋅
18.0
nautical miles)
7.8 7.8
nautical miles)
8.0 7.7 17.5
7.5 7.4 16.8
7.3 17.0
7.5
16.5
7.0 16.0 15.6
15.5
6.5
Q1 2019 Q2 2019 Q3 2019 Q4 2019 Q1 2020 Q2 2020 15.0
14.5
Carbon Efficiency Ratio basis AER 14.0
Q1 2019 Q2 2019 Q3 2019 Q4 2019 Q1 2020 Q2 2020
Poseidon Principles' expectations - AER Trajectory
Generated Emissions4 Cargo Ton-mile
450 425.0 12 26.0
391.5 380.1 23.8
400 363.3 370.5 23.6
10 24.0
Cargo million tons
350 10.5 21.7 21.9
Nautical miles ⋅
9.5 9.3 22.0 20.5
300 271.2 8
1,000 tons
8.7 8.9
250 20.0
6
200 6.3 6.5 18.0
6.0 5.8
150 4 16.0 15.0
4.5
100 14.0
2
50 12.0
1.5 1.2
0 0
Q1 2019 Q2 2019 Q3 2019 Q4 2019 Q1 2020 Q2 2020 10.0
Q1 2019 Q2 2019 Q3 2019 Q4 2019 Q1 2020 Q2 2020
CO2 NOx (right axis) SOx (right axis)
[1] Excludes vessels not operated by BW LPG
[2] Annual Efficiency Ratio (AER) measures the ratio of CO2 emitted per vessel capacity distance. The main factors that affect the value of the AER will relate to the fuel efficiency of the vessel, and the speed maintained
enroute.
[3] Energy Efficiency Operational Indicator (EEOI) measures the ratio of CO2 emitted per cargo distance. The main factors that affect the value of the EEOI will relate to the fuel efficiency of the vessel, amount of cargo
carried, and the speed maintained enroute
[4] Emission calculations are based on the methodology described in 'Guidelines for voluntary use of the ship Energy Efficiency Operational Indicator (EEOI)' (2009), IMO, and 'EMEP/EEA air pollutant emission inventory 30
guidebook 2016', European Environment Agency, from which the methodology of Tier III has been used. NOx factors have been adjusted by actual engine loadsVLGC Charter Portfolio 2020 – 2021
Our contract coverage stands at 25% for 2020 (as of 30 June 2020)
Q1 2020 Q2 2020 Q3 2020E Q4 2020E 2020E 2021E
Owned and bareboat days 3,276 3,276 3,227 3,220 12,999 12,775
Time charter in days 502 546 552 552 2,152 2,097
Total calendar days 3,778 3,822 3,779 3,772 15,151 14,872
Offhire1 (100) (26) (155) (244) (525) (723)
Total available days (Net of offhire) 3,678 3,796 3,624 3,528 14,626 14,149
Spot days (Net of offhire) 3,122 2,824 2,547 2,528 11,021 12,150
Time charter out days (Net of offhire) 556 972 1,077 1,000 3,605 1,999
% Spot days 85% 74% 70% 72% 75% 86%
% TC days 15% 26% 30% 28% 25% 14%
TCE rates Q1 2020 Q2 2020 Q3 2020E Q4 2020E 2020E 2021E
Spot $45,100 $41,100 - - - -
Time charter out $34,600 $34,300 $31,900 $33,000 $33,300 $28,500
VLGC TCE rate (Net of offhire) $43,500 $39,400 - - - -
Time charter in $26,400 $26,500 $26,500 $26,100 $26,400 $26,300
[1] Offhire is assumed to be 3 days per year per vessel, distributed equally per quarter, during the years the vessel does not have planned dry dockings... 31BW LPG Fleet Development (Detailed)
Timeline based on current contracts
1
1
1 1
1 1
4
38 36 34
34 34 34
9 10
8
6 6 6
Dec 2018 Q1 Q2 Q3 Q4 Dec 2019 Q1 Q2 Q3 Q4 Dec 2020 2021 Dec 2021 2022 Dec 2022 2023 Dec 2023
2019 2019 2019 2019 2020 2020 2020 2020
Chartered-in / Bareboat fleet Owned fleet Charter expiry Divested vessels
Note: The fleet timeline assumes that vessels on time charter-in will be redelivered at charter expiry 32Fleet List
Modern fleet of 47 vessels built at leading shipyards (as of 30 June 2020)
Owned VLGCs (100% Ownership) Chartered / Bareboat VLGCs
Name Year Shipyard Name Year Shipyard Name Year Shipyard Charter type
BW Mindoro 2017 DSME BW Sakura 2010 Mitsubishi H.I. BW Yushi 2020 Mitsubishi H.I. Time charter
BW Malacca 2016 DSME BW Odin 2009 Hyundai H.I. BW Kizoku 2019 Mitsubishi H.I. Time charter
BW Magellan 2016 DSME BW Austria 2009 DSME Oriental King 2017 Hyundai H.I. Time charter
1
BW Frigg 2016 Hyundai H.I. BW Lord 2008 DSME BW Messina 2017 DSME Time charter
BW Freyja1 2016 Hyundai H.I. BW Thor 2008 Hyundai H.I. BW Kyoto 2010 Mitsubishi H.I. Time charter
1
BW Volans 2016 Hyundai H.I. BW Princess 2008 Hyundai H.I. Yuricosmos 2010 Mitsubishi H.I. Time charter
1
BW Brage 2016 Hyundai H.I. BW Tyr 2008 Hyundai H.I. BW Tokyo 2009 Mitsubishi H.I. Time charter
BW Tucana 1 2016 Hyundai H.I. BW Loyalty 2008 DSME Berge Nantong 2006 Hyundai H.I. Time charter
1
BW Var 2016 Hyundai H.I. BW Oak 2008 Hyundai H.I. Berge Ningbo 2006 Hyundai H.I. Time charter
1
BW Njord 2016 Hyundai H.I. BW Liberty 2007 DSME BW Empress 2005 Mitsubishi H.I. Bareboat
1 2016 Hyundai H.I. BW Prince 2007 Hyundai H.I. Total 10 vessels (0.8 million CBM and Average Age - 8 years)
BW Balder
BW Orion1 2015 Hyundai H.I BW Elm 2007 Hyundai H.I.
1 2015 Hyundai H.I BW Birch 2007 Hyundai H.I.
BW Libra
1 2015 Hyundai H.I BW Cedar 2007 Hyundai H.I.
BW Leo
BW Gemini 1 2015 Hyundai H.I. BW Confidence 2006 Mitsubishi H.I. VLGCs in BW Global United LPG India Private Limited
BW Carina 2015 Hyundai H.I. BW Trader 2006 DSME Name Year Shipyard Ownership (%)
BW Aries 2014 Hyundai H.I. Berge Summit 2 1990 Mitsubishi H.I. BW Energy 2002 Kawasaki H.I. 50%
BW Pine 2011 Kawasaki S.C. BW Boss 2001 Kawasaki H.I. 50%
Total 35 vessels (2.9 million CBM and Average Age - 9 years) Total 2 vessels (0.2 million CBM and Average Age - 18 years)
12 x
[1] Retrofitting of dual-fuel LPG propulsion engines planned for 2020-2021
[2] Berge Summit was delivered to her new owners in July 2020 33Glossary of Terms
Terms Explanation
Time Charter Charter hires with a fixed hire rate for a fixed duration
Spot Charter hires negotiated on spot/market rates
Available Days Calendar days less planned and unplanned technical offhire days
Commercial Utilisation Rate Available days less commercial waiting days, divided by available days
Fleet Utilisation Rate Available days less commercial waiting days, divided by calendar days
34You can also read