Fixed Income Investor Presentation February 2021 - Presentation also available
←
→
Page content transcription
If your browser does not render page correctly, please read the page content below

Fixed Income Investor Presentation
          February 2021

                  Presentation also available at
        https://www.livewest.co.uk/about-us/for-investors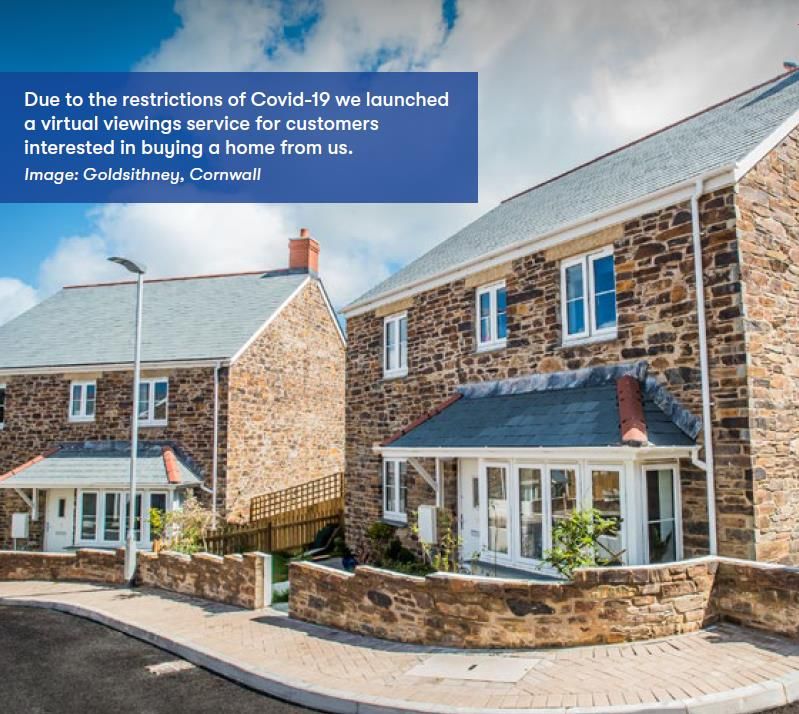
Disclaimer
The information contained in this investor presentation ((including the presentation slides and any related speeches made or to be made by the management of LiveWest Homes Limited ("LiveWest") any questions and any answers thereto or any related verbal or written
communications in respect thereof, the “Presentation”) has been prepared to assist interested parties in making their own evaluation of LiveWest Treasury plc (the "Issuer"), and LiveWest (together, the "Relevant LiveWest Entities"). This presentation and a proposed issue by the
Issuer of Guaranteed Secured Notes (the "Notes") under a Guaranteed Secured Note Programme (the “Programme”) is believed to be in all material respects accurate, although it has not been independently verified by the Relevant LiveWest Entities and does not purport to be all-
inclusive. This Presentation and its contents are strictly confidential, are intended for use by the recipient for information purposes only and may not be reproduced in any form or further distributed to any other person or published, in whole or in part, for any purpose. Failure to
comply with this restriction may constitute a violation of applicable securities laws. By reading this Presentation, you agree to be bound by the following limitations. Neither the Relevant LiveWest Entities nor any of their representative directors, board members, officers,
managers, agents, employees or advisers, nor any bank involved in the offering of any Notes thereunder or their respective affiliates, advisers or representatives, makes any representations or warranty (express or implied) or accepts any responsibility as to or in relation to the
accuracy or completeness of the information in this Presentation (and no one is authorised to do so on behalf of any of them) and (save in the case of fraud) any liability in respect of such information or any inaccuracy therein or omission therefrom is hereby expressly disclaimed,
in particular, if for reasons of commercial confidentiality information on certain matters that might be of relevance to a prospective purchaser has not been included in this Presentation.
No representation or warranty is given as to the achievement or reasonableness of any projections, estimates, prospects or returns contained in this Presentation or any other information. None of the Relevant LiveWestEntities, nor any other person connected to them shall be
liable (whether in negligence or otherwise) for any direct, indirect or consequential loss or damage suffered by any person as a result of relying on any statement in or omission from this Presentation or any other information and any such liability is expressly disclaimed. This
Presentation includes certain statements, estimates and projections prepared and provided by the management of LiveWest or the other Issuer with respect to the anticipated future performance of either LiveWest or the Issuer. Such statements, estimates and projections reflect
various assumptions by LiveWest‘s management concerning anticipated results and have been included solely for illustrative purposes. No representations are made as to the accuracy of such statements, estimates or projections or with respect to any other materials herein.
Actual results may vary from the projected results contained herein.
Neither the Notes nor the guarantee of the Notes by LiveWest have been or will be registered under the U.S. Securities Act of 1933, as amended (the "Securities Act"), or with any securities regulatory authority of any state or other jurisdiction of the United States, and the Notes
may not be offered, sold or delivered within the United States, or for the account or benefit of, U.S. Persons (as such terms are defined in Regulation S under the Securities Act), absent registration or an exemption from, or in a transaction not subject to, the registration
requirements of the Securities Act and applicable state laws. This Presentation is made to and is directed only at persons who are (a) "investment professionals" as defined under Article 19 of the Financial Services and Markets Act 2000 (Financial Promotion) Order 2005, as
amended (the "Order") or (b) high net worth entities falling within article 49(2)(a) to (d) of the Order (all such persons together being referred to as "relevant persons"). Any person who is not a relevant person should not act or rely on this Presentation or any of its contents. Any
investment or investment activity to which this Presentation relates is available only to and will only be engaged in with such relevant persons.
The Notes are not intended to be offered, sold or otherwise made available to and should not be offered, sold or otherwise made available to any retail investor in the European Economic Area (the “EEA”). For these purposes, a retail investor means a person who is one (or more)
of (a) a retail client as defined in point (11) of Article 4(1) of Directive 2014/65/EU (as amended, "MiFID II") or (b) a customer within the meaning of Directive (EU) 2016/97, where that customer would not qualify as a professional client as defined in point (10) of Article 4.1 of MiFID
II. Consequently no key information document required by Regulation (EU) No 1286/2014 (as amended or superseded, the "PRIIPs Regulation") for offering or selling the Notes or otherwise making them available to retail investors in the EEA has been prepared and therefore
offering or selling the Notes or otherwise making them available to any retail investor in the EEA may be unlawful under the PRIIPs Regulation.
The Notes are not intended to be offered, sold or otherwise made available to and should not be offered, sold or otherwise made available to any retail investor in the United Kingdom (the "UK"). For these purposes, a retail investor means a person who is one (or more) of (a) a
retail client as defined in point (8) of Article 2 of Regulation (EU) No 2017/565 as it forms part of domestic law by virtue of the European Union (Withdrawal) Act 2018 (the "EUWA") or (b) a customer within the meaning of the provisions of the FSMA and any rules or regulations
made under the FSMA to implement Directive (EU) 2016/97, where that customer would not qualify as a professional client, as defined in point (8) of Article 2(1) of Regulation 600/2014 as it forms part of domestic law by virtue of the EUWA. Consequently no key information
document required by Regulation (EU) No 1286/2014 as it forms part of domestic law by virtue of the EUWA (the "UK PRIIPs Regulation") for offering or selling the Notes or otherwise making them available to retail investors in the UK has been prepared and therefore offering or
selling the Notes or otherwise making them available to any retail investor in the UK may be unlawful under the UK PRIIPs Regulation.
 MiFID II product governance / Professional investors and ECPs only target market – Solely for the purposes of each manufacturer's product approval process, the target market assessment in respect of the Notes has led to the conclusion that: (a) the target market of the Notes is
eligible counterparties and professional clients only, each as defined in MiFID II; and (b) all channels for the distribution of the Notes to eligible counterparties and professional clients are appropriate. Any person subsequently offering, selling or recommending the Notes (a
“distributor”) should take into consideration the manufacturers' target market assessment; however, a distributor subject to MiFID II is responsible for undertaking its own target market assessment in respect of the Notes (by either adopting or refining the manufacturers' target
market assessment) and determining appropriate distribution channels.
UK MiFIR product governance / Professional investors and ECPs only target market – Solely for the purposes of each manufacturer’s product approval process, the target market assessment in respect of the Notes has led to the conclusion that: (a) the target market for the Notes is
only eligible counterparties, as defined in the FCA Handbook Conduct of Business Sourcebook ("COBS"), and professional clients, as defined in Regulation (EU) No 600/2014 as it forms part of domestic law by virtue of the EUWA ("UK MiFIR"); and (b) all channels for distribution of
the Notes to eligible counterparties and professional clients are appropriate. Any person subsequently offering, selling or recommending the Notes (a "distributor") should take into consideration the manufacturers’ target market assessment; however, a distributor subject to the
FCA Handbook Product Intervention and Product Governance Sourcebook (the "UK MiFIR Product Governance Rules") is responsible for undertaking its own target market assessment in respect of the Notes (by either adopting or refining the manufacturers’ target market
assessment) and determining appropriate distribution channels.
The information presented herein is an advertisement and does not comprise a prospectus or listing particulars for the purposes of Regulation (EU) 2017/1129 (the “Prospectors Regulation”) and/or Part VI of the Financial Services and Markets Act 2000 or admission particulars for
the purposes of an admission to trading on the International Securities Market. This Presentation does not constitute or form part of, and should not be construed as, an offer to sell, or the solicitation or invitation of any offer to buy or subscribe for, Notes in any jurisdiction or an
inducement to enter into investment activity. No part of this Presentation, nor the fact of its distribution, should form the basis of, or be relied on in connection with, any contract or commitment or investment decision whatsoever. Any purchase of any Notes should be made
solely on the basis of the final programme admission particulars and final pricing supplement and investors may obtain copies of such final documents from the relevant link set out in the relevant RNS announcement which corresponds to the Issuer’s information page on the
website of the London Stock Exchange.
The distribution of this Presentation and other information in connection with the Notes in certain jurisdictions may be restricted by law and persons into whose possession this Presentation or any document or other information referred to herein comes should inform
themselves about and observe any such restrictions. Any failure to comply with these restrictions may constitute a violation of the securities laws of any such jurisdiction. This Presentation and any materials distributed in connection with this Presentation are not directed to, or
intended for distribution to or use by, any person or entity that is a citizen or resident or located in any locality, state, country or other jurisdiction where such distribution, publication, availability or use would be contrary to law or regulation or which would require any
registration or licensing within such jurisdiction. The Relevant LiveWest Entities do not accept any liability to any person in relation to the distribution or possession of this presentation in or from any jurisdiction.

Sourcing – unless otherwise stated: LiveWest Financial Statements 2020, LiveWest Trading Statement September 2020 and associated Offering Materials

                                                                                                                                                   2
Our Presenting Team

                      Melvyn Garrett, Deputy Chief Executive and Executive Director of Finance

                      •   Joined LiveWest in 2013 (then Devon and Cornwall Housing (DCH))
                      •   Previously Europe, Middle East and Africa Finance and Operations Director at Motorola Mobility
                      •   Previously held finance, strategy and chief executive positions in the transport, electronics and
                          distribution sectors; with eight years spent in the USA

                      Andrew Hart, Director of Corporate Finance

                      •   Joined LiveWest in 2014 (then Devon and Cornwall Housing (DCH))
                      •   25 years’ finance experience including 10 years in corporate finance consultancy
                      •   Previously Managing Director at a consultancy specialising in housing sector treasury risk
                          management

                                                        3
References made to Sustainability Reporting Standard      Environmental
                           highlighted throughout the presentation with full
                    reference table available as part of transaction materials   Social

                                                                                 Governance

         • Introduction & Group Overview
         • Organisational Structure & Governance
         • Operational Update
         • Development and Asset Management
Agenda   • Financial Performance
         • Treasury
         • Transaction Overview
Introduction &
Group
Overview

Credit Highlights

                                       • Focussed entirely in the South West
      Geographically
                                       • 37,384 homes under management
        Focussed
                                       • Strong long term demand for stock with rents less than 70% of median private rent

                                       • A2 (Stable) Moody’s rating (January 2021)
      Strong External
                                       • G1/V1 regulatory grading (January 2021)
       Endorsement
                                       • Homes England Strategic Partner

         Consistent                    • 72% Income from Social Lettings as % of Turnover
          Financial                    • 33% Social Operating Surplus
        Performance                    • 252% EBITDA MRI Interest Cover

                                       • £381m available liquidity (September 2020)
     Robust Liquidity
                                       • £1bn available security for future borrowing
        Position
                                       • Repeat Issuer - £250m 2043 & £100m 2048 Issues in the EMTN Programme

                                       • Sustainability Reporting Standard early adopter
                                       • £1.7m invested in communities during 2019/20– to increase by £600,000 in 2020/21 to
         ESG at Core                     support those impacted by COVID-19
                                       • 89% Overall Customer Satisfaction
  At 31 March 2020 unless otherwise stated                                    6
Introduction: Stock Map – Focussed Entirely in the South West

                                                            7
Affordability: Rent compared to LHA rate                                                                                               C1

                                                                                        Gross Rent as % of Median PRS Rent
                                                                                                    March 2020
                 70%                                                                                                               9,000

                                                                                                                                   8,000
                 65%
                                                                                                                                   7,000

                 60%                                                                                                               6,000

                                                                                                                                   5,000
        Rent %

                                                                                                                                           Homes
                 55%
                                                                                                                                   4,000

                 50%                                                                                                               3,000

                                                                                                                                   2,000
                 45%
                                                                                                                                   1,000

                 40%                                                                                                               0

                                                                                                     Homes      % of Median Rent

 •        LiveWest rents below 70% of PRS across all local authorities in our operating area
 •        Rents below 50% in major conurbations of Bath, Bristol and Exeter
 •        Indicates strong long term demand for our stock
 •        All rents are below LHA (30th percentile)
Source: https://www.ons.gov.uk/peoplepopulationandcommunity/housing/datasets/privaterentalmarketsummarystatisticsinengland
      LiveWest Statistical Data Return 2020                                                                        8
Introduction: Stock Overview                                                                                                                                                                    C2    C3

   Total Stock                                                               New Units Developed            General Needs                        Property Type
                                                General Needs                                               (Social Rent)
                                                (Social Rent)                     2019-20                                                                     2% 1%
                                                                                                            Affordable Rent                                                           Houses
                                                Affordable Rent
              3% 7%                                                                                                                                        7%
                                                                                                  24%                                                                                 Flats
                                                Supported Housing                  32%                      Supported Housing
      12%
                                                                                                            Housing for Older                                                         Bungalows
                                                Low Cost Home
    9%                                          Ownership                                                   People                                  34%
                                                                                                                                                                          56%
                                60%             Other Social                                                Low Cost Home                                                             Bedsits
                                                                                   2%
         9%                                                                                                 Ownership
                                                                              1%              41%
                                                Private Rented                                                                                                                        Maisonettes

                                                                                                                                                                                    59% of rented stock
                                                                                                                Stock Age Profile (rented units)
                                                 March         New Units Disposals/      March
                                                   2019        Developed  Transfers        2020                  9,000
  General Needs (Social Rent)                    23,255              274      (924)      22,605                  8,000
  Affordable Rent                                 2,780              482       (25)       3,237                  7,000
  Supported Housing                               3,259                8         10       3,277                  6,000
  Housing for Older People                           89               19        (7)         101                  5,000
  Low Cost Home Ownership                         4,250              375      (126)       4,499                  4,000
  Care Homes                                         74                -        (8)          66                  3,000
  Other Social                                       27                -     1,078        1,105                  2,000
  Total Social                                   33,734            1,158        (2)      34,890                  1,000
  Private Rented                                  2,488                -          6       2,494                      0
  Total Units                                    36,222            1,158          4      37,384                             Pre-1919 1919-1944 1945-1964 1965-1980 1981-1990 1991-2000 2001-2010 Post-2010

Source: LiveWest Statistical Data Return 2020                                                           9
Introduction: What We Have Achieved in the Last Twelve Months

• 1,158 affordable homes developed in 2019/20

• Outperformed budget in 2019/20

• Merger savings of £12m achieved

• Additional Funding for Homes England Strategic Partnership (in partnership with Sovereign Housing Group)

• Established EMTN programme

       o Initial issue of £250m

       o Simplified borrowing structure through Consent Solicitation process

• COVID-19 response

       o Continued to maintain compliance services during lockdown and to date

       o Made 9,000 customer calls during the initial lockdown period – being ramped up again

       o Hardship fund created for our most vulnerable customers

• Achieved record scores for Employee Net Promoter and Employee Engagement
 Source: Moody’s Credit Opinion January 2021
                                                              10
Introduction: Strategy
Values Customer Focused Challenge Convention Together We Deliver
Homes and A Growing
Trusted by
Communities Proud to Business Fit
Vision our
that people Work Here for the
Customers
love to live in Future
Asset management
Strategy
Customer Service Development
Strategies People Strategy Digital Strategy
Strategy Strategy
Housing Support
Strategy
Internal / External Communications and Public Affairs
11Organisational Structure & Governance
Introduction: Corporate Structure and Funding                                                                                     C25    C28

                                                                LiveWest Homes Limited
                                                              (Regulator of Social Housing
                                                               registration number: 4873)

                                                    Arc
                                                                                             LiveWest                              Great Western
     LiveWest              LiveWest            Developments                                                      Westco
                                                                                             Properties                           Assured Growth
    Capital Plc*         Treasury Plc*          South West                                                    Properties Ltd
                                                                                              Limited                                   Ltd
                                                   Ltd**

                   *Parent Company Guarantee        •   Completed consent solicitation process transferring £100m LiveWest Capital Bond into
                      from LiveWest Homes               the LiveWest Treasury EMTN Programme

                      ** Company Limited            •   LiveWest Capital Plc and Arc Developments South West will become inactive and
                         by Guarantee
                                                        dormant

                                                                           13
Introduction: Board Membership C9 C26 C27 C28 C31 C32 C33 C34 C40 C44
• Board comprises 11 members:
o 9 independent members, 2 executives
❖ LiveWest board is led by Linda Nash
❖ LiveWest CEO is Paul Crawford
o Phil Stephens joined September 2020 (replacing Tim Larner who retired in November
2020)
❖ Phil trained as a quantity surveyor and has worked in construction and house
building for over 40 years. He also has over 25 years of experience at director level.
• Treasury Committee includes specialist banking co-opted member
• We are not-for-profit and comply with the National Housing Federation’s Code of
Governance 2015 edition
• InFocus customer scrutiny group of over 40 members who help ensure customer views
are heard and acted upon and review performance
Board Statistics
Gender Ratio Male : Female 73:27
Average Age 62
Average Tenure 4 years
Maximum Tenure (non-executives) 9 years
Percentage Non-Executive 82%
Regulator Grading G1/V1
ARC = Audit and Risk committee DC = Development committee TC = Treasury committee
CEO/Worker Median Pay Ratio 8.12 CSC = Customer Servicescommittee RC = Remuneration and Nominations
committee
14Introduction: Executive Team C32
• Reorganisation of executive team completed in the past year
• Jill Farrar retired in October 2020
15Operational Update
Operational Performance Update                                                                                                                             C10

COVID-19 IMPACT & RESPONSE
o   Our primary concern was, and continues to be, the safety and wellbeing of our colleagues and customers
    ➢   Initial response included telephoning customers to find out how they are managing, prioritising those most vulnerable. We also established a team of
        Community Connectors who have access to resources including accessing food, medicines, prepaid electricity and gas cards as well as mental health
        support
    ➢   Maintained gas servicing and fire risk safety compliance
    ➢   Expanded our crisis and hardship grants programme
    ➢   No use of furlough schemes
    ➢   Increased levels of employee engagement and net promoter score
    ➢   Programme of wellbeing initiatives

o   Majority of development sites initially closed down, but have been largely operational since July. There were 190 affordable handovers in the 6 months to
    30 September
o   Sales margins have remained strong. Sales and reservations to date have been resilient to the pandemic, resulting in reduced stock levels
o   Virtual viewings implemented

o   Rent arrears at 30 September of 2.54% (March 2020 1.93%)

o   Customer satisfaction stayed high at 89% (89% March 2020, 90 % 2019, 89% 2018)

                                                                                17
Operational Performance Update C6 C7 C8
BUILDING SAFETY
o Customer Safety is our top priority, ensuring that our customers are safe in their
homes through appropriate servicing of components and risk assessments
o No buildings with ACMs (Aluminium Composite Materials)
March March March
o 9 blocks over six storeys one of which is nine storeys
2020 2019 2018
o 4 require remedial cladding work which will be completed in the next two Valid Gas Safety Certificates 100% 99.98% 100%
years as part of a £6m replacement programme
Fire Risk Assessments Complete 99.45% 99.93% 100%
o We have used criteria (such as the number of storeys, quantity of cladding, the
% of homes meet the Decent Homes
nature of the residents, the presence of a fire detection system) to prioritise Standard 99.91% 100% 100%
remedial action
o New developments include consultation with fire specialists at an early stage of our
design process
RENT COLLECTION
o Void loss performance improved since March despite Covid-19
March March March
o As at March 2020, c. 33% of rent received was from tenants on housing benefits 2020 2019 2018
o 6,960 tenants were in receipt of Universal Credit Rent arrears 1.93% 1.83% 1.90%
➢ £1.5m arrears balance of tenants on Universal Credit Void rent loss (general needs) 0.64% 0.51% 0.51%
➢ Represents 4.34% Rent arrears of tenants on Universal Credit Average days to re-let 29.6 22.8 24.1
➢ 0.84% of Income from Social Housing Lettings No. of tenants in receipt of Universal 6,960 4,010 1,319
Credit (%) (23%) (14%) (5%)
o Rent arrears at 30 September of 2.54%
Source: LiveWest Statistical Data Return 2020, Moody’s Credit Opinion January 2021
18ESG: Environmental C14 C15 C17
Early adopter of the Sustainability Reporting Standard Case Study: Ringswell Avenue Exeter
Environmental Initiatives Start on Site November 2020
• Average SAP rating of 71 vs National Average of 67 (Source: Ministry of Housing, Communities and Local Government - Energy Performance Certificate data on Open Data Communities)
60 Unit scheme (35 Rented, 25 Shared Ownership)
SAP rating of at least 86 in each home (EPC B)
• Investment on existing homes to achieve minimum EPC C rating by 2028 is fully provided for in the Business
Plan All Homes will be fitted with solar photovoltaic panels to
generate their own electricity
• Lowest performers prioritised for efficiency - disposal plan where improvements are not possible
Electric car charging ports
• Additional £200m allocated in the long term plan to achieve carbon neutrality by 2050 (Source: Moody’s Credit Opinion Public cycle parking, with spaces available for use by a car
2021)
club.
• New Homes:
o Own build – fabric first approach (High EPC B or A)
o Joint Ventures moving towards fabric first approach
o Work with Councils on their stated climate emergency initiatives
o Communities – ‘rewilding’ existing green space and incorporating into new schemes
• Internal work:
o “Green” offices and suppliers
o ULEV car scheme
o Year on Year Mileage reduction
EPC Rating of Total Stock EPC Rating of New Units
Delivered in FY19/20
C B
60% 65%
B
10%
E
3% C
35%
D
19
27%ESG: Social & Governance C5 C12 C43
Social Initiatives:
• Aim to create long-term sustainable communities where people want to live and where there are opportunities to thrive and become resilient to increasing local and global impacts
• Ensuring affordability, security and safety through substantial discounts to market rates, all rented tenancies are long term with the majority on lifetime tenancies and a
comprehensive above compliance approach to safety
• Early adopters of the National Housing Federation “Together with Tenants” programme
• Signed the Time to Change Employer Pledge which supports those facing mental health issues
• Continued to pinpoint “Neighbourhoods In Focus” – focussed on 64 priority neighbourhoods to shape the service and community plans after working with customers to understand
their experiences
Key Social Achievements:
• Delivered 1,158 new homes for rent and shared ownership
• 631 people moved from supported housing to live independently
• £2.2m invested in Community investment schemes in 2019/20
• 1,323 customers supported by our tenancy sustainment team
• 2,521 volunteer hours donated by LiveWest staff
Governance:
• Highest possible Governance and Viability rating (G1 / V1) - reaffirmed by the regulator in January 2021
• Board and Executive team comprise experienced members with a balance of skills and recognise importance of effective succession planning
• Gender Ratio of the Male: Female in the Board is 73:27
• Adopted the National Housing Federation’s Code of Governance and comply with the 2015 version in all respects
• 89% Overall Customer Satisfaction and we continue to strive to improve in all aspects of our offering to our customers
• Undertaken a harmonisation exercise to ensure that all our staff are on the same terms and conditions
• Gender pay gap of 12.32%
20Development
&
Asset
ManagementDevelopment: Strategy
• Deliver c.6,000 new homes over the next 5 years
• Focus on principal housing market areas: Bristol, Bath, Exeter, Plymouth, Truro and Taunton
• Affordable housing delivered through land led schemes and Section 106, with aim to increase land led schemes as
a percentage of the total
• Open market sites delivered through joint ventures with house builders or contractors for own-build for sites up to
100 homes
• Focus on sites with outline planning permission or conditional subject to planning
• Looking at longer term strategic opportunities
• Homes England – Partnership with Sovereign is committed to delivering 2,775 new homes under the agreement by
March 2025 (extended by 12 months due to COVID-19)
• Investment appraisal – Robust governance controls where minimum yield and profit targets are reviewed annually
by the Board
22Development: Market Conditions C1
House Price Inflation (year to Sep-20) in Sales Locations
10% 500
8% 400
6% 300
House Price Inflation
Pipeline
4% 200
2% 100
0% 0
-2% -100
Open market Shared ownership HPI
• Strong house price growth in our area where we have sales exposure
Source: https://www.gov.uk/government/publications/uk-house-price-index-england-september-2020/uk-house-price-index-england-september-2020
Contracted Schemes only 23Development: Appraisal Process and Controls
All schemes taken to Development Review Team for approval:
• Membership consists of senior management
• Yield, cost to value and profit targets are considered in
decision-making process
Additional sales controls:
• Impairment exposure limits to keep land holdings within risk
Development Committee approval required for: limits
• Open market schemes with a total open market sales between • Sales revenue limited to 30% of total revenue in any year, for
50 units and 100 units the life of the plan
• All schemes in excess of 100 homes, but less than 150 homes • Liquidity buffer held against sales delays
• Housing market scenario testing with early warning trigger
levels
Board approval required for:
• All schemes in excess of 100 open market units
• All schemes in excess of 150 units in total
24Development: Delivery & Sales
• More cautious delivery forecast due to COVID-19 and Brexit – further Sales Performance
2020 2019
review in March 2021 Actual Actual
Shared Ownership
• Approximately 6,000 new homes for development in the next 5 years Sales (£000s) 31,529 21,596
o 62% affordable rented, 27% Shared Ownership, 11% Open Market 366 252
Units
Sales as % of Turnover 12.7% 9.3%
• Contracted pipeline of 2,529 affordable homes (at September 2020)
Stock 130 125
of which, unreserved 71 68
Units Developed of which, unreserved 3 mths 15 15
1,200 87
27 Open Market
Sales 29,066 29,124
1,000
67 375 85 90
2 Units
800 262 Sales as % of Turnover 11.7% 12.5%
84
Stock 3 2
600 208
467 of which, unreserved 0 1
of which, unreserved > 3 mths 0 1
400 466
283
Total Sales as % of Turnover 24.4% 21.8%
200 Current Year
289
170 204
0 • Sales volumes reduced as a result of Covid-19
2018/2019 2019/2020 2020/2021
• Margins remaining at budgeted levels, indicating strong values
Total
900 1,158 695
Affordable
• Low stock levels
Social Rented Affordable Rented Shared Ownership Supported Non Social
25Financial Performance
Financial
Performance
2020 2019 2018
Total Turnover - £m 249 233 231
Social Housing Lettings Turnover - £m 180 175 171
Social Housing Lettings Surplus - % 33% 33% 31%
First Tranche Shared Ownership Sales - £m 32 22 23
Open Market Sales - £m 29 29 29
Total Property Sales (S/O + OMS) as % of Turnover 24% 22% 23%
Operating Surplus - £m (pre asset disposals) 70 66 62
Operating Surplus - £m (post asset disposals) 90 81 69
Operating Margin % (pre asset disposals) 28% 28% 27%
Gearing % 41% 40% 38%
EBITDA-MRI Interest Cover % 252% 267% 252%
27Financial Performance
260 Total Turnover - £m 30% Operating Surplus - %
28%
240
26%
24%
220
22%
200 20%
2018 2019 2020 2018 2019 2020
• Our operating and social housing letting margins have largely remained constant with savings in management costs being delivered in the year.
• £5m of turnover increase due to social housing lettings, remainder is shared ownership and open market sales related
280% EBITDA-MRI Interest cover % 42% Gearing - %
40%
260%
38%
240% 36%
34%
220%
32%
200% 30%
2018 2019 2020 2018 2019 2020
• Significant interest cover and gearing headroom compared with lenders covenants and internal warning levels
Net Debt per Unit Owned
25,000
20,000
15,000
• Increased investment in land and work-in-progress has led to debt per
10,000
unit of £23.8k, against £21k in 2018
5,000
-
2018 2019 2020 28Benchmarking
Operating margin – social housing lettings EBITDA – MRI Interest Cover %
Headline social housing Cost Per Unit (£) Gearing %
• Comparing LiveWest against a selection of Moody’s rated housing associations using HouseMark data
• Comprises of current A2 or higher rated associations
29
Source: LiveWest 2019/20 Annual ReportTreasury
Treasury Policy
  •     Treasury Committee review policy and strategy annually and recommend to the board
  •     Treasury Committee meet and monitor performance and risk quarterly
  •     Business plan stress tested

  Credit risk                                                                                      Liquidity risk
  •   Approved list of counterparties                                                              •    Minimum 24 month liquidity + Liquidity Buffer
  •   Minimum credit rating criteria                                                               •    Liquidity Buffer for 6 months sales delay + 15% fall in
  •   Maximum exposure levels                                                                           value

  Interest rate risk                                                                               Margin call
  •    Fixed/Variable targets                                                                      •  Free standing derivatives secured through charged
  •    Monitored against market conditions throughout the                                             property
       year by Treasury Committee and Executive Team                                               •  Policy requires sufficient security to cover fall in long
                                                                                                      term interest rates of 0.5%

  “In addition to their low debt, the group's credit quality is supported by strong financial management, which is captured in their 'a’ score for financial management. This assessment is
  based on a number of factors, including its strong decision-making framework (the Internal Financial Framework) which outlines minimum requirements for interest cover, cash,
  immediate and long-term liquidity, and maximum limits for debt to revenues and market sales exposure. The group also has strong stress testing with quantified mitigating actions.
  The high financial management score also reflects strong delivery against merger plans.” Moody’s Credit Rating Report January 2021

                                                                                              31
Debt and Security: Portfolio – March 20
March 20 Loans Swaps Net loans % NAB Pool Valuations Valuation
Units
December 2020 £m
Fixed 503 364 867 97%
EUV-SH 7,679 446
Floating 395 (384) 11 1%
MV-ST 5,137 545
Index linked 2 20 22 2%
Nil Value 564 -
Total Debt 900 - 900 100% Total 13,380 991
Cash and liquid investments (51) - (51)
Net Debt 849 - 849 Available Security
Stock uncharged or held as excess security and
available to secure future borrowings:
• 11,951 properties
Debt Facilities
• Security value of >£1bn
£339m Swaps
• MTM Liability - £116m
£900m
• Liability is fully secured (Including buffer
against rate movement)
• Average Maturity – 9 years
Drawn Undrawn
32Credit Highlights
• Focussed entirely in the South West
Geographically
• 37,384 homes under management
Focussed
• Strong long term demand for stock with rents less than 70% of median private rent
• A2 (Stable) Moody’s rating (January 2021)
Strong External
• G1/V1 regulatory grading (January 2021)
Endorsement
• Homes England Strategic Partner
Consistent • 72% Income from Social Lettings as % of Turnover
Financial • 33% Social Operating Surplus
Performance • 252% EBITDA MRI Interest Cover
• £381m available liquidity (September 2020)
Robust Liquidity
• £1bn available security for future borrowing
Position
• Repeat Issuer - £250m 2043 & £100m 2048 Issues in the EMTN Programme
• Sustainability Reporting Standard early adopter
• £1.7m invested in communities during 2019/20– to increase by £600,000 in 2020/21 to
ESG at Core support those impacted by COVID-19
• 89% Overall Customer Satisfaction
At 31 March 2020 unless otherwise stated 33You can also read