New challenges in municipal broadband network management : from vertical integration to wholesale-retail model - Pure
←
→
Page content transcription
If your browser does not render page correctly, please read the page content below
New challenges in municipal broadband network management
: from vertical integration to wholesale-retail model
Citation for published version (APA):
Sadowski, B. M., & Nucciarelli, A. (2008). New challenges in municipal broadband network management : from
vertical integration to wholesale-retail model. In Proceedings of the 17th International Telecommunications
Society ITS Biennial Conference, June 24-27, 2008 (pp. 1-28).

Document status and date:
Published: 01/01/2008

Document Version:
Publisher’s PDF, also known as Version of Record (includes final page, issue and volume numbers)

Please check the document version of this publication:
• A submitted manuscript is the version of the article upon submission and before peer-review. There can be
important differences between the submitted version and the official published version of record. People
interested in the research are advised to contact the author for the final version of the publication, or visit the
DOI to the publisher's website.
• The final author version and the galley proof are versions of the publication after peer review.
• The final published version features the final layout of the paper including the volume, issue and page
numbers.
Link to publication

General rights
Copyright and moral rights for the publications made accessible in the public portal are retained by the authors and/or other copyright owners
and it is a condition of accessing publications that users recognise and abide by the legal requirements associated with these rights.

       • Users may download and print one copy of any publication from the public portal for the purpose of private study or research.
       • You may not further distribute the material or use it for any profit-making activity or commercial gain
       • You may freely distribute the URL identifying the publication in the public portal.

If the publication is distributed under the terms of Article 25fa of the Dutch Copyright Act, indicated by the “Taverne” license above, please
follow below link for the End User Agreement:
www.tue.nl/taverne

Take down policy
If you believe that this document breaches copyright please contact us at:
openaccess@tue.nl
providing details and we will investigate your claim.

Download date: 11. Apr. 2021
PRELIMINARY VERSION New challenges in municipal broadband network management: from vertical integration to wholesale-retail model Bert Sadowski and Alberto Nucciarelli Economics of Innovation and Technological Change, Eindhoven University of Technology, PO Box 513, 5600 MB Eindhoven, The Netherlands Abstract Over the past years, municipal networks deploying Fiber-to-the-Home (FttH) technologies have increasingly been implemented in Europe. In order to achieve compatibility with the European Union (EU) legal and regulatory framework, a variety of public and private partnership (PPP) models have been developed throughout Europe aimed contributing expertise, finance, etc. to their growth. Recently, the debate has focused on the different industry structure that can foster the growth of municipal networks by moving from sole-supplier environment to a wholesale-retail split model. In undertaking a techno-economic analysis, the paper examines the viability of a wholesale- retail split model. It uses data from the implementation of an FttH network for a small town in the Netherlands. The paper demonstrates that the advantages in moving towards a wholesale retail split model and characterizes the neccessity to define open access conditions for these networks.
1. Introduction

Since 2003, a number of local initiatives aimed at implementing Fiber-to-the-

Home (FttH) networks and based on collaborations of municipalities, social

housing corporations and new entrant companies have emerged in the

Netherlands. The development of municipal networks in the Netherlands has to

be considered in the context of European liberalization of markets for network

access. The European Commission (EC) has been in favor of these networks if

they were considered as part of the European drive towards realizing the goals

of the Lisbon Agenda, in line with the New Regulatory Framework and

compatible with Article 87(1) of the European Union (EU) Treaty on State Aid.

Under these conditions, municipalities in the Netherlands had to justify their

investment in new telecommunications infrastructure.

In the Netherlands, a variety of FttH networks have been developed since 2003.

A few have been based on single vertically integrated FttH models, most

involved a split between the wholesale and retail of services. The first model is

based on an integrated industry structure in which network owner and service

provider are the same entity. In the second (the wholesale-retail split) model,

the network owner (the wholesaler) leases facilities to competing service

providers (retailers), who then provide voice, video and data service over the

shared network. In this case, the network owner provides mainly dark fiber on

a wholesale basis.
In the following sections, we, first, discuss forms of local government

involvement in municipal networks in the context of the existing legal and

regulatory framework in the European Union (EU) (see Section 2). Second, we

characterize the different economic models in municipal networks in the

Netherlands and examine in detail options for a wholesale-retail split in a small

town by undertaking a techno-economic analysis (Section 3). Thirdly, in

concluding remarks, we discuss our findings and put them in the context of the

current discussion on the European regulatory and legal framework (Section 4).

2. Municipal Networks in the Netherlands: The Regulatory Discussion

In the EU, the European Commission has acted in different ways dealing with

municipal networks:

First, these networks have, in general, been stimulated if they were considered

as a part of the European drive towards realizing the goals of the Lisbon

agenda 2004-09 to make the EU "the most competitive and dynamic

knowledge-driven economy by 2010". With respect to reaching the goals of the

2000 Lisbon Agenda, the European Commission has justified further

investment in broadband infrastructure based on the argument that Europe is

lagging behind in comparison with the United States and South Asian countries

(Fransman, 2006). Even if broadband has rapidly been growing with

penetration levels reaching 15.7 percent of the EU population in 2006 (58,5

million lines), up from 11.5 percent in 2005 and 7.3 percent in 2004, Europe is
still lagging in the diffusion of broadband behind Japan, USA or South Korea

(OECD, 2007).

In its efforts to sharpen and renew the Lisbon objectives, the European Council

stated in March 2005 that "knowledge and innovation" are vital as they are

"engines for sustainable growth" (European Council, 2005). As broadband

diffusion has been considered as a priority area within the objectives of the

Lisbon Agenda, the EC has followed a two-way strategy to foster the

development and diffusion of these new technologies: 1) to coordinate

community-wide initiatives by Member States aimed at primarily stimulating

joint research and development initiatives across the European Union; and, 2)

to promote different National Action Plans by Member States.

In 2003, the European Commission provided a justification for investing in

municipal networks if they were supporting growth in underserved areas (EU,

2003). In these areas, private initiatives did not exist at all ("white areas") or

were insufficient to provide more than basic infrastructure and services ("grey

areas"). In 2005, with the set-up of the New Rural Development Fund, the EU

was facilitating the implementation of broadband infrastructure and services in

particular in rural areas. In October 2006, the EU explicitly referred to

innovation as part of long-term structural policy in the EU. It added to the

existing instruments for facilitating municipal broadband networks test and
experimentation programs (EU, 2006). For "black areas", i.e. with two or more broadband networks, these justifications did not hold and were considered as conflicting with European legislation on State Aid. Second, the New Regulatory Framework of 2003 does not directly address investment incentives for municipalities in broadband networks in local communities, but it refers to them in the context of markets that have "transitional problems". With the overhaul of the EU regulatory framework starting in 1999 with the publication of the Communications Review by the European Commission, a discussion started aimed at redefining the balance between incentives to build new networks and to access existing ones. As a result, a package of directives was introduced that represent the New Regulatory Framework of the EU. Within this framework, the Directive (2002/19/EC) on Access and Interconnection was aimed at discussing the conditions under which regulatory intervention should occur to the presence of some form of market dominance. It also provided room for ex-ante regulation in markets (like for broadband access) that have “transitional problems” as a result of technological developments. These markets - (expected to be) unable to generate effective competition - were, therefore, subject to some sort of sector-specific regulation. Within the New Regulatory Framework of 2003 municipal initiatives could be exempted from ex ante regulation as these networks would operate in new "emerging markets" (Lewin and Williamson, 2005).
Even if the emerging market concept has been specified in the New Regulatory

Framework, the European Commission has been more concerned with

describing the (phasing out of) regulatory supervision over particular market

(segments) rather than with providing incentives for infrastructure investment

of new entrants. In cases of market failure, explicit reference has been made to

the EU Competition Law. In particular, EC recommendations on relevant

product and service markets have been aimed at identifying those markets

which cannot be expected to generate effective competition and should,

therefore, come under same sort of sector-specific regulation 1 . The concept of

"new and emerging markets" explicitly recognizes the need to guarantee "first-

mover" advantages so as to protect innovation incentives, and hence, the

development of new infrastructures.

Third, municipal initiatives have actively been investigated as to whether or not

they are compatible with Article 87(1) of the EU Treaty. Article 87 focuses on

state subsidies that distort competition in the common market. As Article 87 is

under discussion to provide "less and better aid" (Kroes, 2005), there are

important repercussions for public intervention in broadband markets.

Currently, there are three options for public involvement in these markets: a) as

an investor that invests similar to a private party ("market investor principle");

b) if the (local) government invests in the passive infrastructure and opens

1
 European Commission’s Recommendation on relevant product and service markets (C(2003)
497).
access up to all interested private parties on non-discriminatory terms and c) as
the (local) government intends to deliver services as part of Service of General
Economic Interest (SGEI) 2 (Hencsey et al., 2005). These options have provided
different opportunities for involvement of municipalities in municipal
networks.
2.2 Public-Private Partnership Models to Foster Municipal Networks in
the Netherlands
Since full liberalization of the telecommunication markets in 1998, municipal
networks have been started to become a mass phenomenon in Europe. A
forerunner of building up a fiber network in Europe has been the well-known
example of the municipality of Stockholm, in Sweden, which started already in
1994 (Stockab, 2006). In 1998, the European Commission in their Report about
Alternative Networks estimated that there have been approximately 50
networks in which municipalities participated in particular in Belgium,
Germany and Sweden (CEU, 1999). Some of these networks were acquired by
market parties or ended up as a failure in the late 1990s (Sadowski and
Runhaar, 2000). However, since 2000s, municipal networks have started to
grow rapidly (see e.g. (Preston et al., 2007; Tookey et al., 2006)3 . A major
factor contributing to this growth has been underinvestment of incumbent
2
The Green Paper on Services of General Economic Interest (COM(2003)270 final) has been central in
defining the balance between common service obligations and economic efficiency arguments with
respect to investment in broadband infrastructure and services.
3
Estimates put them currently at around 140 projects whereby three quarters of these projects have
been initiated by municipalities.telecom and cable companies in new telecommunication infrastructure and services (Cave and Prosperetti 2001; Fransman, 2002). In order to comply with the European legislatory and regulatory environment, municipalities have increasingly become involved in different private-public partnerships (PPP) models to foster growth of municipal networks. In a private- public partnership framework, the extent to which these different models include public or private resources (e.g. function of municipality, expertise at different layer) can be examined. These models have partly been developed as a reaction to the decisions of EU competition authorities to contest municipal networks in particular in "black areas" 4 . However, in the EU, competition authorities have been lenient with respect to municipal projects in "white" and "grey" areas. Six projects in the United Kingdom and one in Spain were approved as State Aid compatible with Article 87(3)(c) of the EC Treaty. Regarding the two French projects in the department of Pyrénées-Atlantiques and the region of Limousin, the European Commission decided that they did not constitute State Aid. The European Commission did not oppose to the qualification of this public intervention as a 4 e.g. CEU. 2006a: "Commission Decision of 19 July 2006 on the measure n° C 35/2005 (ex N 59/2005) which the Netherlands are planning to implement concerning broadband infrastructure in Appingedam." CEU: Brussels.The case of the citynet Amsterdam still is under discussion on the EU level. CEU, 2006b: "State Aid nr. C 53/2006 (ex N 262/2005) – the Netherlands Citynet Amsterdam – Investment in a Glassfiber access network by the municipality of Amsterdam ". CEU: Brussels.
compensation for a Service of General Economic Interest (SGEI) made by the

French Authorities in their notification. In three of the approved projects

(Atlas; Pyrénées-Atlantiques; Limousin) public funding was granted for the

deployment of infrastructure, while in the other six5 the subsidies were given to

telecommunications operators for the provision of retail services to end-users

(either residential, businesses or public authorities). The European Commission

has recently approved a number of local broadband initiatives by

municipalities. However, only a few have been implemented as a compensation

for a service of general economic interest.

To provide municipal networks in "black areas", a wide variety of PPP models

have developed across the European Union ranging from models in which

municipalities act as initiator (e.g. franchise model) or coordinator to

orchestrate market demand (coordinator model). They fulfilled important

functions in providing incentives for municipal networks (e.g. subsidies or

passive infrastructure) based on the initiative of private entrepreneurs and

citizens (cooperative model) and of social housing corporations (social housing

corporations model).

5
  Regional Innovative Broadband Support in Wales; Broadband for SMEs in Lincolnshire; Broadband
in remote and rural areas in Spain; Broadband Business Fund; Broadband in Scotland remote and rural
areas.
Municipalities        active     in    the    investment        in    new      telecommunication

infrastructure have favored different forms of glass fiber networks to be

implemented in their communities. Compared to existing infrastructure

technologies (mainly xDSL and cable modems), glass fiber networks are long-

lived, enable very high transmission rates (typically higher than 10Mbps, up to

100Mbps symmetric) and support triple play services (TV, Internet, Voice). 6

The basic architectures of glass fiber networks (point-to-point, active star and

passive star) differ according to technical characteristics like the amount of

deployed fiber, the extent of sharing of network resources between users, the

complexity of open access and required investment 7 . Municipalities can get

involved in the implementation of these networks at different layers: the

physical or passive layer (providing e.g. for dark fiber leasing), the data link or

active network operation layer (providing for dark fiber and link layer

electronics) and network layer (providing basic network services).

To examine the techno-economic characteristics of these models, we focused

on two extreme cases: first, an integrated industry structure in which network

owner and service provider are the same entity and; an industry structure in

which wholesale and retail of services are separated, i.e. the network owner

(the wholesaler) leases facilities to competing service providers (retailers), who

6
  Infrastructure initiatives of municipalities have to be examined within the context of the growth of
next generation networks (NGN). As NGN are based on commonly agreed definitions according to
international accepted standards, they should provide the following characteristics: a) an uncoupling of
services from the network; b) open access to the network and c) sufficient communication capacity for
users (ITU Recommendation, 2001).
7
  All current FttH networks in the Netherlands are based upon the point-to-point architecture, in other
parts of the world (including the US and Asia, PON networks are used as well).
then provide voice, video and data service over the shared network. In the latter
case, the network owner provides mainly dark fiber on a wholesale basis.This
distinction allowed to focus on differences in the cost characteristics of these
networks.
3. The Experiences with Municipal Networks in the Netherlands
3.1. The Emergence of Municipal Networks
Even if the Netherlands has been one of the forerunners in broadband
penetration, the FttH penetration in households has been lagging (see Figure 1).
Penetration Level (per 100 inhabitants)
35,0 31,9 31,8
29,1
30,0 27,7
25,1 26,0
25,0
21,2 20,2
19,6 19,6 19,6
20,0 FTTH
16,3
14,8
15,0 Broadband
10,0 7,2
5,0 2,9 3,7
2,5 1,4 1,4 1,0 1,0 1,0
0,0
s
an
ay
ng
n
en
a
k
a
ly
es
nd
pa
ar
in
re
Ita
rw
iw
Ko
ed
at
Ch
nm
la
Ko
Ja
Ta
St
No
er
Sw
ng
De
PR
h
th
d
ut
Ho
ite
Ne
So
Un
e
Th
Figure 1: Broadband Penetration in Countries with Highest FTTH Levels, 2006
Municipalities in conjunction with social housing corporations and private
firms have initially been the main forces behind the growth of municipal FttHnetworks in the Netherlands. A number of municipal initiatives emerged from 2001 onwards aimed at implementing glass fiber infrastructures in cities like Amsterdam (Andriessen Commissie, 2003), Rotterdam (Andriessen, Commissie 2004), but also Almere, Den Haag and Eindhoven. They were using a variety of private-public partnership (PPP) models ranging from a cooperative model (e.g. Nuenen, Eindhoven) over coordination models (e.g. Rotterdam) to franchise models (e.g. Helmond) and social housing corporation models (e.g. Enschede). These models were used to gather sufficient investment, to design, build and guarantee the operation of these networks. The implementation of these networks started after 2004 on a small scale mostly in co-operation with social housing corporations (see Table 1).
PPP Model            Initiative            Function of Municipality            Network components and Access                              Examples**          Authors

                                                                               Physical          Network           Access,     Services
                                                                               infrastructure    (Backbone     &   and Content
                                                                               (Dark Fiber)      Access)

Franchise Model      Municipality          Contracts with a private party      Operating Company                   Multiple service and   Milan      (It),    (Lehr et al.,2004)
                                           to build and operate the facility                                       contents providers     Helmond (NL)

Cooperative Model    Citizens/ Private     Supports the set up of a non-       Owned by non-     All levels are managed and owned by      Nuenen (NL)         (ICM, 2004;
                     Entrepreneurs         profit     organization     that    profit            non-profit organization
                                           negotiates     with    suppliers    organization                                                                   Lehr et al., 2004)
                                           different services

Social    Housing    Social    housing     Provides a nexus for the            Owned        by   Operating         Multiple service and   Rotterdam (NL)      (ICM, 2004)
Corporations         Corporations          aggregation of demand of            municipality or   Company           contents providers
Model                                      different    social housing         housing
                                           corporations                        organization

Coordination         Municipality          Provides a nexus for the            Municipality      Operating         Multiple service and   CityNet             (ICM, 2004;
Model                                      aggregation of demand of            aggregated        Company           contents providers     Amsterdam (NL),
                                           households, private companies       passive                                                                        Lehr et al., 2004)
                                           and semi-public parties like        infrastructure                                             Terrecablate (It)
                                           hospitals

Table 1: Different Models for Public Private Partnerships
3.2. Re-Defining the Role of Municipalities in Municipal Networks The emergence of regional municipal initiatives was accompanied by a legislative discussion on the national Telecommunication Act in the Netherlands starting in 2006. Initially, the Telecommunication Act specified only the role of municipalities as providing "rights of way" (grafrechten) in Article 5.4. In January 2007, Article 5.14 was added that explicitly prohibited municipalities to "provide public telecommunication infrastructure and public telecommunication services" and to gain controlling interest in companies that provide these kinds of infrastructure and services 8 . The change in the national Telecommunication Act was embedded in the continuing legislative and regulatory discussion about the development of the municipal glass fiber network in Amsterdam. 3.3 The Nuenen Network The Cooperative Model "Ons Net" Nuenen The municipality in Nuenen 9 has been the first to roll-out a municipal FttH network under the Kenniswijk subsidy. The original idea of the Nuenen network was to set up a cooperative scheme under which infrastructure 8 There has been an exception for municipalities that have already been involved in these activities prior to changes in the Telecommunication Act (Article 20.5). 9 Nuenen is a small municipality near the city of Eindhoven in the south of the Netherlands, well known due to the close relationship between the town and the Dutch painter van Gogh.
investment in a FttH network could take place10 . Under the "Kenniswijk"

subsidy scheme, Nuenen residents became eligible for a €800 subsidy that was

aimed at stimulating demand for new ICT services and infrastructure. This

subsidy had to be split over the active and passive network because of different

cost and payback period for the active and passive network. Specifically, €500

had to be utilized to pay for the infrastructure and €300 that could be used to

pay for at least one telecommunication service. In order to persuade the

residents joining the cooperative "Ons Net", they received an offer for a one-

year contract with "Ons Net" based on a 10Mbps symmetrical Internet

connection that was free of charge. This scheme was successful and let, within

the first year, to a penetration rate of 97 percent in Nuenen.

The Network Model

The consortium "OnsNet" was initially set up as a network operator as well as

service provider in a strict vertically integrated fashion. The functional network

boundaries of the Nuenen network are outlined in Figure 2.

10
   Due to problems of financing and unexpected costs, a private company has recently taken a stake of
five percent in NEM. Based on priority stakes they received from NEM, the company obtained the
right to appoint the management board of NEM. That meant in effect that the Nuenen residents are not
anymore the owners of the network.
Legend:
                      4. Application layer
                                                             Ons Net

                                                                       Network
                       3. Network layer

                                                             Ons Net
                       2. Data link layer

                    Physical addressing (MAC),

                        1. Physical layer

                       Passive infrastructure,

Figure 2. The Operation of the Municipal Network in Nuenen

To be able to offer services, the network had its own Internet backbone and a

TV broadcast headend. This was also necessary due to the requirements of the

"Kenniswijk" subsidy that was set up to support the development of new

services, not just infrastructure. The consortium “OnsNet” offered open access

to its network to other service providers at the layer three. The choice for a

layer three system allowed a complete and integrated system, which could be

used by "OnsNet" to offer services. No additional equipment was needed which

made an integrated three-layer system a more economic option compared to a

two-layer system. Moreover, the implemented integrated three-layer system

(provided by Swedish vendor PacketFront) was based on customized system

for municipalities that were willing to provide services themselves, while still

offering the option of open access for competitive service providers.
The Techno-Economic Model
Available economic and financial data (referred to its first year of activity in
2006) and main business model assumptions of the Nuenen network are shown
in Table 3. We used the cost methodology provided by Lehr et al. (2006) with a
few changed assumptions for our calculations (for more detailed information
on the model see (de Rooij, 2006).
Name OnsNet
Proprietary 95% NEM; 5% others
Provided services Broadband connectivity
Geographical area served City of Nuenen
Market size 7662 (100%)
Number of connections in year 1 7.445 (~97%)
Number of expected connection year 2 5747(~75%)
Starting date of business activity 2005
Passive Infrastructure Fixed Costs (in €) 3.450.000
Variable costs (in €) 1.870000
Active Infrastructure Fixed Costs (in €) 800.000
Variable costs (in €) 5.000.000
Interest passive/active network 10%
Depreciation passive network 25 years
Depreciation active network 5 years
Table 2: Techno-Economic Characteristics of the Consortium "OnsNet"
The fixed costs for the passive infrastructure include POP installations, basic
distribution infrastructure and indirect labor costs. Part of the fixed costs for the
active infrastructure has been core data equipment, core CATV broadband
equipment, system management equipment and indirect labour costs. The
variable costs for the active infrastructure consisted of access routes, customer
premises equipment and subscriber CATV modules.The Vertical-integrated model
The results of the techno-economic model showed that the network displayed
the characteristics of a declining cost industry. Our calculations showed that the
network in Nuenen became profitable after levels of penetration at about 35 to
40 percent. However, the subsidy has been important for the development of
the network (Sadowski et al., 2006) in particular as it allowed the network
operator to deploy the FttH infrastructure in the whole of town of Nuenen. The
relationship between the different cost components of the network in terms of
network costs and costs for service provision are shown in Figure 3.
Cost determinants in Nuenen broadband
Vertical Integrated model
90
80
70
60
cost (euros)
50
40
30
20
10
0
20% 30% 40% 50% 60% 70% 80% 90% 100%
Penetration rate
Network cost/subscriber Services cost/subscriber Total cost/subscriber
Figure 3: Cost Characteristics of the Municipal Network in Nuenen
Network costs (as well as total costs) are decreasing. In Nuenen, the network
deployment was aimed at connecting the whole town. In addiction,
construction to connect the houses was done in parallel with work to pass the
homes with distribution cabling. Accordingly, no additional work was requiredto connect the houses later. It meant that the very high network costs had to be
split among different subscribers. With rising penetration, the existence of
economies of scale allows to spread fixed costs among an increasing number of
customers with a sensible decrease of both network and total costs per
subscriber per month.
Profit determinants in Nuenen broadband
Vertical integrated model
90
80
70
costs and revenues (euros)
60
50
40
30
20
10
0
-10 20% 30% 40% 50% 60% 70% 80% 90% 100%
-20
-30
-40
Penetration rate
Network cost/subscriber Services cost/subscriber Total cost/subscriber
Revenue/subscr/month Profit/subscr/month
Figure 4: Profits and Revenues of the Municipal Network in Nuenen
Figure 4 displays profits determinants of the vertical integration model in the
Nuenen subsidized market. It completes data provided in Figure 3. Some main
aspects are described in the following:
1) in the vertical integrated model, the network owner also acts as a service
provider. It let to the existence of a total cost curve which is the sum of two
main costs curves related respectively to the maintenance of the network
(both the CapEx and OpEx for the active and passive part of the FttH
network) and the provision of services. The network costs curve isdescendent in its trend since the amount of costs can easily be split out over of the market size. This explains why with a penetration rate of 100%, network costs are around €15 per subscriber/month. Differently, the service cost is a constant since it embeds single customer costs/month in terms of service provisioning and economies of scale are not applicable any more. Its amount has been assumed to be €11 as the cost of a 3-play bundle service (de Rooij, 2006); 2) revenues (subscriber/month) are constant. It is assumed that the single market carrier charges customers with a €59.39 subscription fee (price for a triple-play service) in order to recover costs. 3) the curve of profits increases over higher penetration rates. It allows the carrier to reach positive profits around 30% of market penetration (namely, 30.8%). The Wholesale-retail split model In contrast to the existing vertically integrated model in Nuenen, we have been investigating the economic characteristics of a model in which the wholesale and the retail of services have been separated. In this model, the cost of service supply are not a burden on the network operator but carried by a separate service supplier. The network operator will benefit from the service provider using the network. This has some repercussions in terms of cost structure. According to our assumption, the network owner decides to charge a €20 fees to subscribers. In terms of cost structures, the service provider tries to achieve
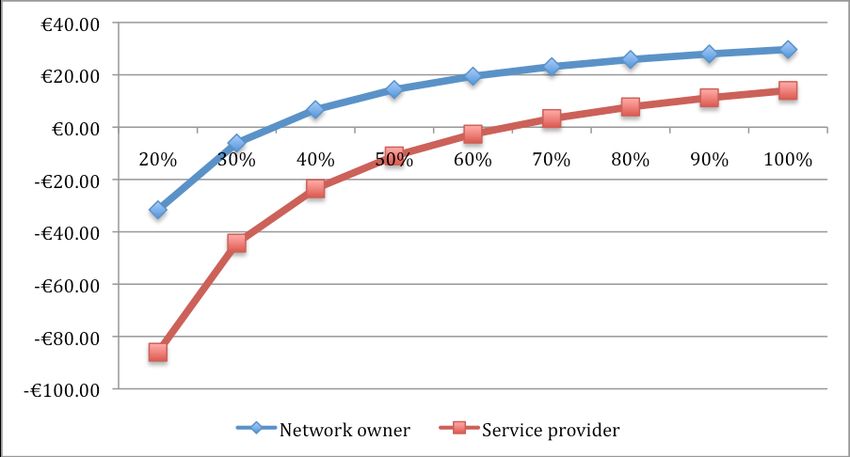
profitability by covering its fixed and variable costs. The first category (fixed

costs) deals with the fact that the network owner sells the access to the network

to the service provider at an estimated rate of €25 per subscriber per month.

However, the service provider is not sustaining network costs because all of

them as far as the operational costs are allocated to the network operator. The

second category of costs (variable costs) concern broadcasting rights, servers

for the Internet services and marketing activities. They are fully sustained by

the service provider and are estimated to be €11 per subscriber per month.

To test the affordability of the wholesale-retail model in the Nuenen market,

profits of both the network operator and the service provider are plotted in

Figure 5.

Figure 5: Profits of network owner and service provider in Nuenen

The profit curves displayed in Figure 5 show how the way to allocate costs to

the market is able to impact the reliability of the wholesale-retail model,

especially in a small market like in Nuenen. In this scenario, as the network
owner makes the profitability of its business model worse – gaining profits at

around 35% penetration rate – one service provider is not able to generate

profits before reaching around 75% of the potential subscribers. Accordingly,

though the Nuenen model provides positive results in term of network

deployment (the network is broadly deployed in Nuenen), the dimension of the

market itself is not big enough to allow a network owner and a separate service

provider co-exist. The critical mass to cover costs is reached at higher

penetration rate in the wholesale-retail scenario than in the vertical integrated

one. It leads to consider a vertically integrated industry structure as a ‘must’ for

a small-size market like Nuenen.

The Nuenen case with respect to the Dutch FttH scenario

The case of Nuenen stimulated the implementation of new infrastructure driven

by new entrant firms like Volker Wessels Telecom and Lybrandt. These new

players together with a number of other players (e.g. municipalities, social

housing corporations) took responsibility for an increase in the number of FttH

networks throughout the Netherlands. Involvement by the municipality in these

networks has been varying from direct initiation (e.g. Almere) to passive

participant (e.g. Deventer) with social housing corporations as major

participants. From the small-scale projects (like Nuenen), municipal networks

developed in 2007 based on the rollout of city-wide projects in which housing

corporations still played a major part (Table 4 and 5). Most municipal FttH
networks in the Netherlands are based on vertically integrated network models

in which the network owner is also the service operator (in the case of NEM) or

there is just one additional service operator (which sometimes even is partly

owned by) the network operator (recently the case in Nuenen).
Municipality/Region     Initiator              Inititated /   Dec.2006          Network   PPP Model        Network and Service Provision
                                               Started        connected                                    Network Owner                   Network Provision      Service Provision

Almere                  Municipality           2001( 2003)             1,700    FttH      Coordination     Municipality via                First Mile Ventures    UNet (until 2008)
                                                                                                           Almere Fiber Company
Amersfoort              Municipality           2005 (2006)             1,000    FttH      Coordination     BreedNet Amersfoort             BreedNet Amersfoort    Casema
Amsterdam               Municipality           2003 (2006)              N.A.    FttH      Coordination     Glasvezelnet Amsterdam C.V.     BBned                  Variety of Service
                        PC (GNA)                                                                                                                                  Providers
Arnhem                  SHC (Portaal) /        2006 (2007)             3,769    FttH      Social Housing   GNEM                            GNEM                   XMS
                        PC (GNEM)                                                         Corporation
Deventer                SHC (Rentree)         2004 (2006)              1,200    FttH      Social Housing   SHC Rentree via                 SHC Rentree via        SHC Rentree via
                                                                                          Corporation      Y3-net                          Y3-net                 Y3-net
Deventer                PC (Reggefiber)       2007 (2007                   0    FttH      Coordination     NEM Deventer                    NEM Deventer           NEM Deventer

Eindhoven               COOP ("Ons Net"        2001 (2005)             6,500    FttH      Cooperative      "Ons Net" Eindhoven             "Ons Net" Eindhoven    Edutel
                        Eindhoven)                                                                         via NEM                         via NEM
Enschede                SHC (Woonplaats&       2003 (2005)             7,500    FttH      Social Housing   Initially SHC via               Initially SHC via      KPN-Casanet
                        Domijn)                                                           Corporation      Casanet                         Casanet
Helmond                 Municipality           2005 (2006)                 0    FttH      Franchise        BBNed                           BBNed                  BBNed

Naaldwijk               PC (CaiW)              2004 (2004)                700   FttH      Franchise        CaiW                            CaiW                   CaiW

Nuenen                  COOP ("Ons Net"        2001 (2005)             7,200    FttH      Cooperative*     "Ons Net" Nuenen                "Ons Net" Nuenen via   Edutel
                        Nuenen)                                                                            via NEM                         NEM
Nijmegen-Hazenkamp      COOP (Glazenkamp)      2005 (2006)                24    FttH      Cooperative      Glazenkamp                      Glazenkamp             UCI-KUN
                                                                                                                                                                  (University)
Rotterdam               Municipality           2002 (2006)             4,000    FttH      Coordination     Glasvezel Rotterdam via         Bbned                  Bbned
                                                                                                           Bbned
Utrecht                 COOP (Lomboxnet)       2002 (2004)             1,000    FttH      Cooperative      Lomboxnet                       Lomboxnet              Lomboxnet

Utrecht-Leidsche Rijn   COOP (Kersentuin)      2003 (2004)                94              Cooperative      Xs4all                          Xs4all                 Xs4all

Local Initiatives                                                     34,687
Table 3: Local Initiatives in the Netherlands by Municipalities (December 2006)
Municipality/Region Initiator Inititated / Dec.2006 Network PPP Model Network and Service Provision
Started connected Network Owner Network Provision Service Provision
Amersfoort SHC 2005 (2006) 900 FttH Social Housing GNEM GNEM GNEM
(De Velden/Portaal) Corporation
Amersfoort SHC 2005 (2006) 3,000 FttH Social Housing GNEM GNEM GNEM
(De Velden/Portaal) Corporation
Arnhem SHC (Portaal) 2005 (2006) 3,500 FttH Social Housing GNEM GNEM GNEM
Corporation
Bussum SHC (Patio) 2005 (2006) 1,000 FttH Social Housing GNEM GNEM GNEM
Corporation
Hilversum SHC (Patio) 2005 (2006) 2,000 FttH Social Housing GNEM GNEM GNEM
Corporation
Leiden SHC (Portaal) 2005 (2006) 6,000 FttH Social Housing GNEM GNEM GNEM
Corporation
Naarden SHC (Portaal) 2005 (2006) 1,000 FttH Social Housing GNEM GNEM GNEM
Corporation
Nijmegen SHC (Portaal) 2005 (2006) 4,000 FttH Social Housing GNEM GNEM GNEM
Corporation
Soest SHC (Portaal) 2005 (2005) 900 FttH Social Housing GNEM GNEM GNEM
Corporation
Utrecht SHC (Portaal) 2005 (2006) 4,500 FttH Social Housing GNEM GNEM GNEM
Corporation
Hillegom PC (Lijbrandt) 2005 (2006) 7,200 FTTC Franchise Lijbrandt Lijbrandt Lijbrandt
Lisse PC (Lijbrandt) 2005 (2006) 24 FTTC Franchise Lijbrandt Lijbrandt Lijbrandt
Haarlem SHC (Pré Wonen) 2005 (2006) 4,000 FTTC Social Housing Lijbrandt Lijbrandt Lijbrandt
Corporation
Bollenstreek region PC (Lijbrandt) 2005 (2006) 1,000 N.A. Franchise Lijbrandt Lijbrandt Lijbrandt
Various towns SHC. 2005 (2006) 94 FTTB Social Housing Lijbrandt Lijbrandt Lijbrandt
Corporation
Local Initiatives 34123
Table 5: Local Initiatives in the Netherlands by Social Housing Corporations, December 2006
(Source: (Stedenlink, 2007; Stratix, 2007) own investigations; PC – Private Company; COOP – Cooperative; SHC – Social Housing Corporation)4. Summary and Conclusions Our paper has shown that there are wide varieties of private-public partnership models that allow fostering the growth of municipal networks even if the existing legal and regulatory framework in the European Union (EU) imposes some limitations on (local) government involvement in these networks. As the focus was on the techno-economic characteristics of these networks, we compared a vertical-integrated model with a wholesale-retail split model by using data from a small-scale network in the Netherlands. We found that for a small-scale market (like the one in Nuenen) a vertical- integrated model has been the most appropriate industry structure. For such markets, separate service suppliers will not achieve profitability in a wholesale- retail split model. As the vertically-integrated model has been adopted by a variety of municipal FttH projects in the Netherlands, it will become increasingly necessary to discuss the consequences of this model in terms of open access conditions. As current EU and national regulations insufficiently equipped to deal with these issues, new initiatives are required to guarantee open access.
References
Andriessen Commissie, 2003, Slagkracht door Glas, Amsterdam.
Andriessen Commissie, 2004, De Glazen Maas, Rotterdam.
Cave M. and Prosperetti L., 2001, European Telecommunications
Infrastructures, Oxford Review of Economic Policy, 17:3, pp. 416-31.

CEU, 1999, Alternative Networks in EU Member States." CEU: Brussels.

CEU, 2006a, Commission Decision of 19 July 2006 on the measure n° C
35/2005 (ex N 59/2005) which the Netherlands are planning to implement
concerning broadband infrastructure in Appingedam, CEU: Brussels.

CEU, 2006b, State Aid nr. C 53/2006 (ex N 262/2005) – the Netherlands
Citynet Amsterdam – Investment in a Glassfiber access network by the
municipality of Amsterdam, CEU: Brussels.

European Council, 2005, Communication to the Spring European Council.
Working Together for Growth and Jobs, European Council: Brussels.

de Rooij M., 2006, Open access exploitation of Fibre-to-the-Home networks,
Eindhoven.

EU, 2003, Guidelines on the Use of Structural Funds for Electronic
Communications, SEC(2003) 895: Brussels.

EU, 2006, Innovation in the National Strategic Reference Frameworks, EU:
Paris.

Fransman M., 2002, Telecoms in the Internet Age. From Boom to Bust to ...?
Oxford: Oxford University Press.

Fransman M., 2006, Global Broadband Battles. Stanford: Stanford University
Press.

Hencsey M., Reymond O., Riedl A., Sanatmato S. and Westerhof J., 2005,
State Aid and Public Funding of Broadband, Competition Policy Newsletter,
1:Spring.

ICM, 2004, Aanbevelingen Breedbandactiviteiten Publieke Organisaties.
Eindrapport ICM Werkgroep Breedband ad Marketordening, ICM: Den Haag.

ITU Recommendation, (2001), NGN overview, www.itu.int.
Kroes N., 2005, Less and Better State Aid for Growth and Jobs - the New
Rules on Research, Development and Innovation, and Risk Capital (Speech),
21 April 2006: Graz.

Lehr W., Sirbu M. and Gillett S., 2004, Broadband Open Access: Lessons from
Municipal Network Case Studies, Telecommunications Policy Research
Conference - T PRC 2004, Alexandria.

Lewin D. and Williamson B., 2005, Regulating Emerging Markets, Economic
Policy Note 5:April 2005.

OECD, 2007, Broadband Statistics, OECD: Paris.

Preston P., Cawley A. and Metykova M., 2007, Broadband and Rural Areas in
the EU: From Technology to Applications and Use, Telecommunications
Policy, 31:6-7, pp. 389-400.

Sadowski B., de Rooij M. and Smits J., 2006, State Aid, Open Access and
Market Size: Two Cases of FTTH Network Implementation in Dutch
Municipalities, ECIS working paper series, 06.09.

Sadowski B. and Runhaar H., 2000, Diversifying utilities – opportunity or
fallacy? An empirical analysis of diversification strategies of European utility
companies, ECIS: Eindhoven.

Stedenlink, 2007, Vrij Verkeer van Breedbanddiensten, Stedenlink: Den Haag.

Stockab, 2006, Annual Report 2006, Stockab: Stockholm.

Stratix, 2007, The Netherlands: FTTH Deployment Overview 4Q2006, Stratix:
Hilversum.

Tookey A., Whalley J. and Howick S., 2006, Broadband Diffusion in Remote
and Rural Scotland, Telecommunications Policy, 30, pp. 481-95.
You can also read