The impact of TEN-T completion on growth, jobs and the environment - European Commission
←
→
Page content transcription
If your browser does not render page correctly, please read the page content below
Ref. Ares(2019)1936739 - 22/03/2019

       The impact of TEN-T
    completion on growth, jobs
       and the environment
                                      SYNTHESIS
                                     Final Report

Authors (M-Five): Wolfgang Schade, Johannes Hartwig, Sarah Welter
Authors (TRT): Silvia Maffii, Claudia de Stasio, Francesca Fermi, Loredana Zani, Angelo Martino

30 November 2018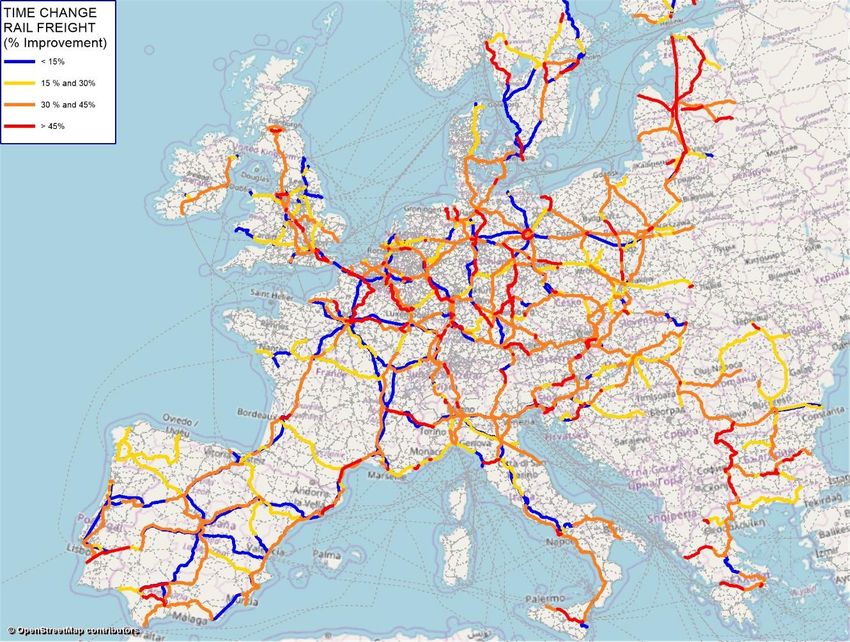
EUROPEAN COMMISSION
Directorate-General for Mobility and Transport
Directorate Dir B — Investment, Innovative & Sustainable Transport
Unit B1: Trans-European network
Contact: Gudrun Schulze
E-mail: MOVE-B1-CNC@ec.europa.eu

European Commission

B-1049 Brussels
The impact of TEN-T
completion on growth, jobs
   and the environment
         SYNTHESIS
         Final Report
Europe Direct is a service to help you find answers
to your questions about the European Union.
Freephone number (*):
00 800 6 7 8 9 10 11
(*) The information given is free, as are most calls (though some operators, phone
boxes or hotels may charge you).
LEGAL NOTICE
This document has been prepared for the European Commission however it reflects the views only of the
authors, and the Commission cannot be held responsible for any use which may be made of the information
contained therein.
More information on the European Union is available on the Internet (http://www.europa.eu).
Luxembourg: Publications Office of the European Union, 2019
ISBN 978-92-76-01400-3
doi: 10.2832/374574
© European Union, 2019
Reproduction is authorised provided the source is acknowledged.About the project consortium M-Five GmbH Mobility, Futures, Innovation, Economics (Karlsruhe) is a scientific consultancy providing systemic advice in the fields of mobility and economics. Their expertise covers the fields of emerging new mobility services and technologies, transport policy, economics and innovations. M-Five advises public and private entities, the former receiving sound policy advice and the latter strategic guidance for their business in the mobility domain and its deepening linkages with energy and ICT domains in a world of strong climate mitigation ambitions. TRT Trasporti e Territorio srl (Milan) is an independent consultancy specialised in transport economics, transport planning and modelling. Established in 1992, TRT combines its expertise in research projects with professional studies supporting public and private players in the transport sector. TRT experts have a long record of experience in strategic planning, transport modelling, sustainable urban mobility, feasibility studies, project assessment, transport demand analysis and forecast, logistics and freight transport, planning and regulating of public transport, energy and environment. Ricardo Energy & Environment is an energy and environmental consultancy with over 40 years’ experience working with clients across the globe. Ricardo Energy & Environment is experienced in high-level strategic policy development and research for the European Commission and national governments, as well as analysis and modelling for major businesses, with their expertise covering a wide range of analytical tools and techniques. These skills and knowledge are used to provide strategic and specialist support to develop and evaluate transport policy both at home and internationally. Report on behalf of the European Commission The information and views set out in this report are those of the author(s) and do not necessarily reflect the official opinion of the Commission. The Commission does not guarantee the accuracy of the data included in this study. Neither the Commission nor any person acting on the Commission’s behalf may be held responsible for the use which may be made of the information contained therein.
Table of contents

1             Introduction and key numbers ..................................................................... 9

2             Methodology and input data ...................................................................... 11

3             Transport impacts of TEN-T implementation............................................. 14

    3.1       Impacts on European freight transport ...................................................... 14

    3.2       Impacts on European passenger transport ............................................... 15

    3.3       Transport impacts of individual core network corridors ............................. 17

    3.4       Impacts on decarbonisation and environment .......................................... 19

4             Economic impacts of TEN-T implementation ............................................ 20

    4.1       Economic impacts for the whole EU ......................................................... 20

    4.2       Economic impacts on Member States ....................................................... 21

    4.3       Economic impacts from individual core network corridors ........................ 24

    4.4       Long-term economic outlook of TEN-T core network impacts .................. 26

5             Limitations ................................................................................................. 26

6             Conclusions and Recommendations ......................................................... 28

7             References ................................................................................................ 33
List of Abbreviations
ATL Atlantic core network corridor
BAC Baltic-Adriatic core network corridor
Bn Billion
CGE Computable general equilibrium model
CNC Core network corridors on the TEN-T
CNoCNC TEN-T core network not part of any CNC
CO2 Carbon dioxide
CTP Common transport policy
EC European Commission
ERDF European Regional Development Fund
ERTMS European rail traffic management system
EU European Union
EU 13 Bulgaria, Croatia, Czech Republic, Cyprus, Estonia, Hungary,
Latvia, Lithuania, Malta, Poland, Romania, Slovak Republic,
Slovenia
EU 15 Austria, Belgium, Denmark, Finland, France, Germany, Greece,
Ireland, Italy, Luxemburg, Netherlands, Portugal, Spain,
Sweden, United Kingdom
FTE Full-time equivalent employment
GDP Gross domestic product
GHG Greenhous gas emissions
IWW Inland Waterway transport
MED Mediterranean core network corridor
MoS Motorways of the sea
MS Member States
Mt Megatonne, million tonnes
NEC National emissions ceiling
NEDC New European Driving Cycle – road vehicle test cycleThe impact of TEN-T completion - Synthesis 8
NSB North-Sea-Baltic core network corridor
NSM North-Sea-Mediterranean core network corridor
OEM Orient-East-Med core network corridor
RALP Rhine-Alpine core network corridor
RHD Rhine-Danube core network corridor
SCM Scandinavian-Mediterranean core network corridor
SDM System dynamics model
TEN Trans-European Network
TEN-T Trans-European-transport-network
Tkm Tonne kilometre – 1 tonne of goods transported over 1 km
WLTP Worldwide harmonized Light-vehicles Test ProcedureThe impact of TEN-T completion - Synthesis 9
1 Introduction and key numbers
Infrastructure development has always been important as a basis for the Common
European Transport Policy (CTP) which dates back to the Treaty of Rome (1957). The
development of Trans-European Networks (TENs) in the fields of transport, energy and
telecommunications was included in the Treaty of Maastricht (1992). It serves the goals of
economic development, competitiveness, environmental sustainability and regional and
social cohesion. The EU Treaty requires the European Union to establish guidelines for the
development of TEN. The first guidelines for the development of a trans-European network
in the transport sector (TEN-T) were published in 1996. This was followed by several
revisions, with the most important ones having been adopted in 2004 and 2013 (notably to
reflect EU enlargement and strengthen the network approach).
European funding was first made available for certain transport infrastructure projects in
1982 through a specific line of the EU budget dedicated to transport infrastructure of
European interest. Since the adoption of the first TEN-T Guidelines, successive EU
Regulations were adopted for the granting of financial support to TEN-T projects of
common interest. Available EU budgets for TEN-T policy have been steadily increasing
over time, with a 24 billion Euro budget under the Connecting Europe Facility 2014 – 2020
(CEF). Besides the CEF as the main EU funding instrument for the TEN-T in all parts of
the European Union, the TEN-T Guidelines are also the basis for EU funding under the
Cohesion Fund.
TEN-T policy contributes to three principal objectives of EU policy-making: fostering
growth, creating jobs and mitigating climate change. After more than 20 years of Trans-
European transport network (TEN-T) policy, the European Commission is interested to
assess the potential impacts of completing the core TEN-T in relation to these political
priorities.
Thus this study has been carried out by M-Five, TRT and Ricardo with the objective to
assess the growth, jobs and greenhouse gas (GHG) emissions impacts arising from the
completion of the TEN-T core network. It builds on the projects along the core network
corridors which remain to be implemented between 2017 and 2030 in order to achieve full
completion of the core network. These projects, complemented by an estimation of
investment needs for core network development outside the corridors, represent a total
investment of 556 billion Euro in 2005 prices. The projects have been identified in relation
to the 3rd work plans of the eleven European Coordinators who are facilitating cooperation
along these corridors.
The study comes to the following key results:
An additional 800 000 European people will be employed in 2030 through the
completion of the TEN-T core network,
7.5 million person-years of jobs will be generated cumulatively during the
period 2017 - 2030,The impact of TEN-T completion - Synthesis 10
Additional GDP growth of 1.6 % will be realised in 2030,
26 million tons of carbon dioxide emissions will be saved between 2017 and
2030 in the transport sector. This is expected to be complemented by noticeable
additional savings of carbon dioxide emission which will be enabled by further roll
out of alternative fuel infrastructure (electricity, natural gas, hydrogen) and their use
by cleaner vehicles.The impact of TEN-T completion - Synthesis 11
2 Methodology and input data
The analysis builds on three major pillars:
A European multi-modal transport network model called TRUST, enabling the
modelling of the travel impacts from implementation of the core network.
A European integrated assessment model called ASTRA, which integrates
transport demand, vehicle fleet and economic models.
An extensive database of projects along the core network corridors (CNC). These
projects have notably been identified in the framework of the corridor analysis
carried out by external consultants on behalf of the European Commission as well
as in a study on ERTMS. Member States and other stakeholders / project
promoters have been closely involved (in particular through the 'Core Network
Corridor Fora').
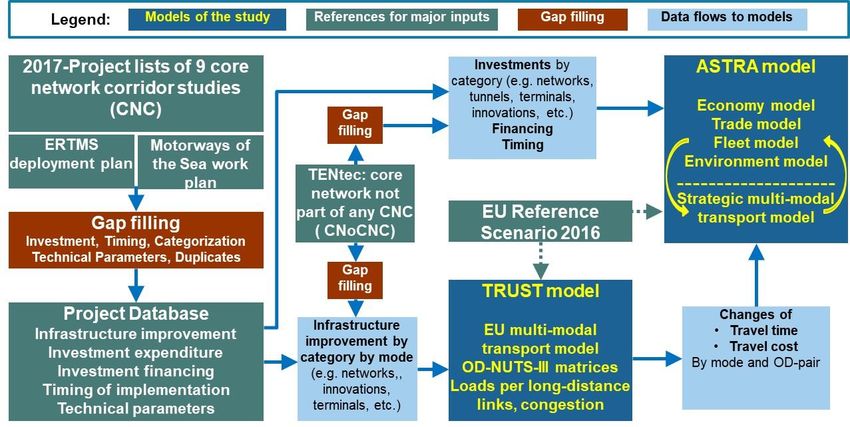
Figure 1 presents the interactions between the TRUST and the ASTRA models, as well as
the major inputs required by the current study. Both models are calibrated to an updated
version of the EU Reference Scenario 20161 in terms of the expected development in
demographics, economic growth, energy and the transport sector. This scenario is
compared against a Baseline Scenario that assumes that no further core TEN-T network
investments are implemented beyond 2016.
Regarding the inputs, "gap filling" has been necessary for projects whose preparatory
process was not yet sufficiently advanced and the database therefore included "gaps".
They have been filled on the basis of certain assumptions and comparable Unit cost. For
projects outside the core network corridors, estimations on projects / investments have
been made on the basis of alignments included in the Commission's geographical
information system TENtec on the one hand and required TEN-T standards in accordance
with the TEN-T Guidelines on the other.
1
The updated EU Reference scenario 2016 includes some updates in the technology costs
assumptions (i.e. for light duty vehicles) and several policy measures adopted after its cut-off
date (end of 2014) such as the Directive on Weights and Dimensions, the 4th Railways
Package, the NAIADES II Package, the Ports Package, the replacement of the New European
Driving Cycle (NEDC) test cycle by the new Worldwide harmonised Light-vehicles Test
Procedure (WLTP). It has been developed with the PRIMES-TREMOVE model (i.e. the same
model used for the EU Reference scenario 2016) by ICCS-E3MLab (Capros et al. 2016). A
detailed description of this scenario is available in the Impact Assessment accompanying the
Proposal for a Directive amending Directive 1999/62/EC on the charging of heavy goods
vehicles for the use of certain infrastructures, SWD (2017) 180The impact of TEN-T completion - Synthesis 12
Source: M-Five
Figure 1: Major elements of the project methodology
The TRUST and ASTRA models
Combining the TRUST and ASTRA models allows transport to be analysed on two levels:
1. The network level: covered by the TRUST model, which includes the links and
nodes of the European transport system, and
2. The strategic level: covered by the ASTRA model, which includes intra-zonal
demand split into different distance bands and inter-zonal demand provided at the
level of origin-destination pairs between European regions.
With such a combined modelling approach it is possible to capture both the direct effects
of the new infrastructure in the transport sector, as well as the indirect effects on supplying
industries and the wider economic impacts induced by mechanisms such as higher
productivity diffusing to other economic agents and into future years. (for more details on
economic terminology, see chapter 3 of the report "Methodology and Results).
The project data base
The major data input to both models are parameters on the implementation of the TEN-T
core network over time. Relevant assumptions are derived from a Project Database that
was specifically developed by the project team, building upon sources including: the
project list of the nine CNC, the deployment plan of the European Rail Traffic Management
System (ERTMS), and the first work plan of Motorways of the Sea (see Figure 1). The final
database contained 3,037 projects. These projects (including the results of the "gap filling"The impact of TEN-T completion - Synthesis 13
exercise represent a total investment sum of 438 billion Euro2. Table 1 shows the
breakdown of these projects in terms of investment types
Table 1: TEN-T investments on the CNC by investment type (in millions of euros,
2005 prices)
Investment type 2017-2020 2021-2026 2027-2030 2017-2030
ERTMS on board 8 853 7 023 1 388 17 263
ERTMS track side 1 499 1 190 235 2 924
Study* 4 106 2 230 310 6 646
Construction** 143 510 203 400 61 970 408 880
Rolling Stock*** 12 198 0 210
Clean Fuel 1 318 492 34 1 844
Total CNC 159 298 214 533 63 937 437 767
* Study: includes feasibility studies, market studies, technology demonstrations, etc.
** Construction refers to implementation of networks i.e. rail tracks, roads, tunnels, bridges, canals, etc.
*** Rolling stock refers to investments into locomotives and rail waggons
Source: EC, M-Five analysis
Additional assumptions had to be formulated on the development of the core network
sections that are not part of any CNC. The investment costs of these were estimated at
118 billion Euro, of which around 97 billion Euro were accounted for by railway projects
and 21 billion Euro by road projects.
This leads to the estimated total investment need for the TEN-T core network of 556 billion
Euro during the period 2017 – 2030. It has to be provided essentially from public sources
at national level as well as, where appropriate, from private sources. EU contributions,
mainly from the Connecting Europe Facility and from the Cohesion Fund, are part of this
investment volume. They shall be used in a way to mobilise the necessary public and
private investment in the most effective way.
2
The work plans and the corridor studies of each CNC including the horizontal priorities can be
downloaded from this website (please click on the link of the CNC that you are interested in):
https://ec.europa.eu/transport/themes/infrastructure/downloads_enThe impact of TEN-T completion - Synthesis 14
3 Transport impacts of TEN-T implementation
This section examines the transport impacts of TEN-T core network implementation until
2030, focussing on indicators related to the travel times, transport performance (tkm / pkm)
as well as on emissions of CO2 and air pollutants.
3.1 Impacts on European freight transport
Figure 2 shows the modelled impacts of the TEN-T core network implementation on rail
freight travel times relative to the Baseline. On some links, time savings are anticipated to
be more than 45%.
Source: TRUST model
Figure 2: Changes of travel time by rail freight in the Reference Scenario relative
to Baseline in 2030 (% change to the Baseline)
The improvements in travel time on rail links and inland waterways are expected to lead to
modal shift, resulting in growing importance of these modes over time. As Table 2 shows,
at EU28 level rail activity increases by 4.7% in 2030 relative to the Baseline scenario. This
is more pronounced in the EU153 (+5.8%), compared to the EU134 (+2.7%). These strong
3
EU15: Austria, Belgium, Denmark, Finland, France, Germany, Greece, Ireland, Italy, Luxembourg,
Portugal, Spain, Sweden, the Netherlands, United Kingdom.
4
EU13: Bulgaria, Czech Republic, Croatia, Cyprus, Estonia, Hungary, Latvia, Lithuania, Malta,
Poland, Romania, Slovakia, Slovenia.The impact of TEN-T completion - Synthesis 15
improvements in rail freight transport performance reflect the impact of projects that aim to
make long distance rail freight transport more competitive with road freight. Rail
investments include substantial funding to remove bottlenecks (e.g. to implement 740-
metre-long sidings) and to implement additional and/or more efficient freight transhipments
facilities from road to rail.
Inland waterway activity in the EU28 increases by 0.6% in 2030 relative to the Baseline
scenario. It should be noted that the focus of the current study is on the implementation of
the projects on the core network corridors (CNC). The maritime sector is covered only in
so far as projects in ports as well as impacts on ports' hinterland connections are
concerned. A detailed analysis of the growth potential of inland waterways and maritime
transport is undertaken in the forthcoming “Study on support measures for the
implementation of the TEN-T core network related to sea ports, inland ports and inland
waterway transport” by EY et al.
Total freight transport performance increases by 0.6% at EU28 level, driven by the positive
impacts of the core TEN-T network investments on economic growth. At the same time,
modal shift leads to an overall reduction in road transport activity (in tkm), which decreases
by around 0.4% at EU28 level relative to the Baseline scenario. The figures in Table 2
refer to the territoriality approach which considers all the traffic on the territory of a country,
regardless of its origin and destination.”
Table 2: Changes in inland freight transport activity (territoriality approach) in the
Reference scenario relative to Baseline in 2030 – difference in millions of
tonne-kilometres and % changes
ROAD RAIL IWW TOTAL
% % % %
Delta Delta Delta Delta
Change Change Change Change
EU15 -7 903 -0.4% 21 311 5.8% 1 108 0.7% 14 517 0.6%
EU13 -1 388 -0.3% 5 344 2.7% 70 0.3% 4 026 0.6%
EU28 -9 291 -0.4% 26 655 4.7% 1 178 0.6% 18 543 0.6%
Source: ASTRA model;
Note: Delta stands for the difference in tonne-kilometre per year while % change stands for the % difference
between the Reference scenario and the Baseline scenario.
3.2 Impacts on European passenger transport
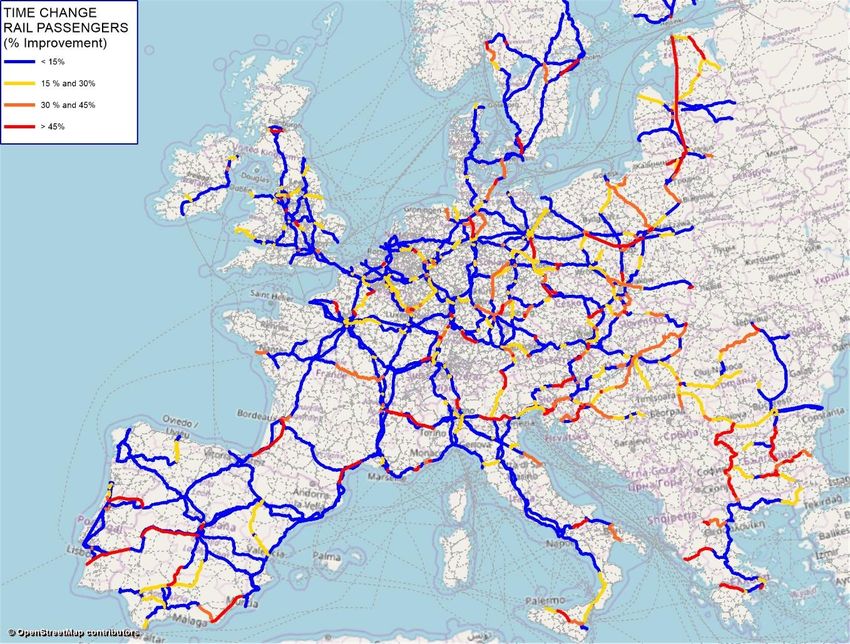
Figure 3 shows that there are also improvements in rail passenger travel time taking place,
although these are slightly lower than those for rail freight. For Western-Central Europe
(Benelux, Germany, France) the improvements are typically less than 15% in 2030 relative
to the Baseline scenario. In Eastern Europe, the improvements reach more than 45% in
certain cases.The impact of TEN-T completion - Synthesis 16
Source: TRUST model
Figure 3: Changes of travel time by passenger rail in the Reference Scenario
relative to Baseline in 2030 (% change to the Baseline)
Passenger rail transport activity at the EU28 level increases significantly (+8.4%) relative
to the Baseline scenario in 2030 (see Table 3). Higher increases are observed for the
EU15 (+8.9%) compared to EU13 (+6.0%). On the other hand, road transport activity falls
by around 0.7% at EU28 level in 2030 relative to the Baseline.
Table 3: Changes in inland passenger transport activity (territoriality approach) in
the Reference scenario relative to Baseline in 2030 – difference in million
passenger-kilometres and % changes
ROAD RAIL TOTAL
% % %
Delta Delta Delta
Change Change Change
EU15 -38 156 -0.7% 52 646 8.9% 14 753 0.2%
EU13 -3 888 -0.4% 6 561 6.0% 2 673 0.2%
EU28 -42 044 -0.7% 59 207 8.4% 17 426 0.2%
Source: ASTRA model; Note: Delta stands for the difference in passenger-kilometre per year while %
change stands for the % difference between the Reference scenario and the Baseline scenario.
Overall, the modelling results show that the investment in the TEN-T core network over the
period from 2017 until 2030 improves the efficiency of the transport system, and boosts the
competitive position of rail and inland waterway transport.The impact of TEN-T completion - Synthesis 17
3.3 Transport impacts of individual core network corridors
Analysis at the corridor level shows that travel time improvements for passenger rail (left
hand side in Figure 4) and freight rail (right hand side in Figure 4) are substantial.
Passenger rail time savings along the corridors range between 6.8% for the Atlantic CNC
and 30% for the Mediterranean CNC in 2030 relative to the Baseline. For rail freight, the
time savings range between 23.3% for the North-Sea Baltic CNC and 44.4% for the
Mediterranean CNC in 2030 relative to the Baseline. Apart from North-Sea Baltic CNC, the
time savings for rail freight are generally higher than those for passenger rail.
Source: TRUST model
Figure 4: Changes in travel time by rail for passengers (left hand side) and freight
(right hand side) by CNC relative to the Baseline in 2030 (% change)
The completion of the TEN-T core network leads to a substantial increase in passenger rail
transport activity (left hand side of Figure 5) and a small reduction in passenger road
transport activity (right hand side of Figure 5) along the corridors in 2030 relative to the
Baseline. The largest changes are observed for the Mediterranean and the Scandinavian-
Mediterranean CNCs, which also constitute the two CNC with the largest investments. It
should be emphasised that the results show modal-shift within the NUTS-zones crossed
by the CNC, and not just on the links of the CNC.The impact of TEN-T completion - Synthesis 18
Source: ASTRA model
Figure 5: Changes in passenger transport activity (territoriality approach) of the
NUTS1 regions crossed by the core network corridors (CNC) relative to
the Baseline in 2030 (% change) – rail on left hand side, road on right
hand side
The completion of the TEN-T core network leads to a substantial increase in freight rail
transport activity (left hand side of Figure 6) and a small reduction in freight road transport
activity (right hand side of Figure 6) along the corridors in 2030 relative to the Baseline.
Rail freight variations range from 3.1% for the NUTS1 regions crossed by the North Sea-
Med and the Atlantic corridor to 0.9% for those crossed by the Orient-East-Med corridor.
Road freight reductions following the increased rail performance range from 0.1% in the
NUTS1 regions crossed by the Orient-East-Med and Baltic-Adriatic corridors to 0.4% in
those crossed by the Rhine-Danube corridor.The impact of TEN-T completion - Synthesis 19
Freight Rail change relative to Baseline in 2030 Freight Road change relative to Baseline in 2030
Source: ASTRA model
Figure 6: Change of freight transport activity by road and rail (territoriality
approach) in the NUTS1 regions crossed by the core network corridors
(CNC) relative to the Baseline in 2030 (% change) – rail on left hand side,
road on right hand side
3.4 Impacts on decarbonisation and environment
The implementation of the core TEN-T network leads to a reduction in CO2 emissions from
transport of 12.5 Mt CO2 in 2030 relative to the Baseline (-1.4%), due to modal shift from
road to rail and inland waterways. The expected cumulative reduction of CO2 emissions
from the transport sector is about 72 million tonnes between 2017 and 2030, of which 26
million tonnes are from TEN-T core network completion and the rest from measures to
promote cleaner vehicle technologies enabled by the refuelling/recharging infrastructure
for alternative fuels and electro-mobility. This adds to the savings already generated by the
part of TEN-T network completed between 1996 and 2016.
The Reference scenario does not take into account the policies recently adopted at the EU
level for 2030 (i.e. the recast of the Renewables Energy Directive, the revision of the
Energy Efficiency Directive and the Effort Sharing Regulation), and those recently
proposed by the Commission (i.e. the first "Europe on the Move" package in May 2017, the
second Mobility Package in November 2017 and the third "Europe on the Move" package
in May 2018). Taking these policies into account would lead to much higher CO2 emissions
savings on the core TEN-T network.
Modal shift to environmental friendly modes also reduces the emissions of air pollutants
from transport. NOx emissions decrease by 11,000 tons in 2030 (-0.7%) compared with the
Baseline. Emissions of particulate matter (PM) reduce by 0.7% in 2030 compared to the
Baseline.The impact of TEN-T completion - Synthesis 20
4 Economic impacts of TEN-T implementation
The economic impacts of TEN-T implementation are analysed from four different angles:
Impacts for the whole EU until 2030
Impacts for different Member States
Impacts of individual CNC,
Longer-term impacts until 2040.
The impacts of investments in the core TEN-T network go beyond the transport system.
The modelling exercise shows a wealth of economic impacts:
Infrastructure investments have a positive impact on value-added and employment in
the construction sector.
Investments in technology such as locomotives or components of the European Rail
Traffic Managements System (ERTMS) foster growth and employment in the railway
and electronics industries.
Supply industries to these sectors (i.e. construction, railway and electronics) provide
intermediate goods and services, improving their own economic outcomes.
Transport time savings increase the productivity of the supply chains and create new
opportunities for business trips, which in turn improves productivity.
Sectoral productivity gains due to higher sectoral investment in technology inputs
increase total factor productivity of the European economy, with positive impacts on
GDP.
Increased GDP leads to second round impacts, with additional income spent by
households on sectors producing consumer goods and services.
4.1 Economic impacts for the whole EU
The ASTRA model measures these macroeconomic impacts through key indicators
including gross domestic product (GDP) and employment. Table 4 shows that GDP at
EU28 level goes up by 1.6% in 2030 (0.4% in 2020) relative to the Baseline. The table also
shows that the economic impacts are not evenly distributed over the European Union:
GDP in EU13 Member States increases by 4.2% in 2030 (1.9% in 2020) relative to the
Baseline, whereas for the EU15, the GDP increase is lower (0.3% in 2020 and 1.4% in
2030).
Since population and labour force are substantially larger in the EU15 than in EU13, the
absolute increase in employment in the EU15 in 2030 (about 510,000 jobs) is higher than
in the EU13 (around 288,000 jobs). In relative terms however, employment in the EU13 is
0.4% higher in 2030 with respect to the Baseline and 0.1% higher in the EU15. For the
EU28, 797,000 additional jobs are created in 2030 thanks to the completion of the core
TEN-T network. Employment numbers are provided as full-time equivalent (FTE), in other
words equivalent employees working full-time.The impact of TEN-T completion - Synthesis 21
Table 4: Changes in GDP and employment in the Reference scenario relative to
the Baseline due to the TEN-T core network implementation between
2017 and 2030
Changes in the GDP Employment (FTE)
Reference scenario
relative to the Baseline 2020 2030 2020 2030
EU15 0.3% 1.4% 185 200 509 600
EU13 1.9% 4.2% 155 300 287 500
EU28 0.4% 1.6% 340 500 797 000
Source: ASTRA model
The economic impacts can also be measured as cumulative impacts over the whole time
period from 2017 until 2030 by summing the difference between the Reference and the
Baseline for each year. The resulting cumulative impacts are shown in Table 5.
Table 5: Changes in cumulative GDP and cumulative jobs due to the TEN-T core
network implementation between 2017 and 20305
Changes in the Reference
Cumulated GDP
scenario relative to the Cumulated job years
Baseline in billion Euro2005
2017 to 2020 2017 to 2030 2017 to 2020 2017 to 2030
EU 15 95,000 1,400,000 457,000 4,537,000
EU 13 47,000 426,000 394,000 2,963,000
EU 28 143,000 1,826,000 851,000 7,501,000
Source: ASTRA model
4.2 Economic impacts on Member States
At Member State level, the impacts depend on factors such as: the size of TEN-T
investment in relation to GDP or to their total investment; the sectoral structure of their
economy; the specific improvements of transport performance; the dependency on trade
and trade structure etc. The time profile of TEN-T investments and thus of improvements
in travel time is also different between countries. As a consequence, the impacts on GDP
vary country by country. Moderate increases in GDP of around 1% in 2030 relative to the
Baseline are projected for several EU15 countries, while more substantial increases of
more than 3% in GDP are shown for many EU13 countries. Comparing the impacts on
GDP in 2020 and in 2030 allows a rough distinction between countries that benefit most
5
Cumulated GDP is the difference in the integral of the GDP in Reference scenario and the
Baseline in billion Euro2005. Cumulated job years are the difference in the integral of FTE for the
Reference scenario and the Baseline scenario in person-years. One person-year is one person
working on a full-time job over a period of 1 year. The integral is taken for both indicators over
the period 2017 until 2020 and 2017 until 2030.The impact of TEN-T completion - Synthesis 22
from direct impacts of investments (that appear relatively quickly) and those with more
significant impacts due to second-round effects (that take longer to materialise). However,
it is not possible to exactly divide the effects in the taken modelling approach and the two
timings can be rather seen as a proxy for direct and indirect effects. For instance, countries
like Luxembourg, Slovenia and Hungary have positive impacts on GDP that are similar in
2020 and in 2030 (respectively the blue bar and orange bar in Figure 7), showing that most
of their benefits are from direct impacts of investments. Conversely, countries like Bulgaria,
Denmark, Sweden and Latvia have GDP impacts in 2030 that are more than the threefold
of the impacts in 2020, showing that they benefit significantly from second-round effects
deriving from productivity growth and spillovers.
Source: ASTRA model
Figure 7: Changes in GDP in 2020 and 2030 in the Reference scenario relative to
the Baseline, by country
The impacts on employment by Member State in 2020 and 2030 are presented in Figure 8.
Similarly to GDP, these vary by country. For employment, the labour productivity in the
Baseline scenario (i.e. by country and at sectoral level) represents an additional important
factor influencing the impacts across MS. This is obvious taking into account that the
additional employment is derived from the ratio between investment and productivity such
that high productivity levels generate lower additional direct employment from the same
level of investment than low productivity levels.
Similarly to the GDP analysis above, MS can be differentiated between those who
primarily benefit from direct effects of investments and those who mostly benefit from
second-round effects (i.e. 2030 impacts being two to three times higher than in 2020). The
results are presented in terms of additional jobs created, expressed as full-time equivalent
(FTE). Hence, higher increases in absolute terms correspond to larger MS, with Italy,The impact of TEN-T completion - Synthesis 23
France, Spain and Poland showing more than 100,000 additional jobs created in 2030
relative to the Baseline. The impact in these MS stems mainly from the second-round
effects. The reasons for countries with significant direct impacts but limited second round
impacts can be threefold: (1) high share of imports in the sector benefitting from the
investment, and thus (2) low growth of income and thus consumption in the country, and
(3) low stimulus of total factor productivity in that country. The reasons for countries with
more significant second round effects can be fourfold: (1) high share of domestic input to
construction sector, (2) significant exports of intermediate goods for the construction in
other MS, (3) high growth of income and thus consumption in the country, and (4) high
stimulus of total factor productivity. In particular the final two effects stimulate each other
and enfold growth dynamics over time6 such that the second round effects, when the
dynamics are kicked off initially, increase over time and could become much larger than
the direct effects.
Source: ASTRA model
Figure 8: Additional jobs created in 2020 and 2030 in the Reference scenario
relative to the Baseline, by country
6
Higher income in year 1 – more spending in year 1 – more investment to satisfy consumption –
higher productivity – higher income in year 2, etc.The impact of TEN-T completion - Synthesis 24
4.3 Economic impacts from individual core network corridors
Economic multipliers are used as an indicator to understand the economic impact of TEN-
T implementation. The multipliers establish a relation between the input of a policy, in our
case the required investment, and the output, which can refer to different economic
indicators, like GDP, income or employment.
Figure 9 shows GDP multipliers for individual corridors, that provide an indicator of the
additional GDP created by each euro invested over the period 2017 to 2030. These range
from 2.6 for the Orient-East-Med CNC to 4.7 for the Baltic-Adriatic CNC. The GDP
multiplier for the whole TEN-T core network over the period 2017 to 2030 is 3.3, meaning
that every euro invested in the TEN-T core network creates 3.3 euros of GDP on average.
Source: ASTRA model
Figure 9: GDP multipliers for the TEN-T core network implementation between
2017 and 2030
The GDP multipliers of the TEN-T network implementation can be compared with other
sectors that receive European funding. Taking agriculture as an example, Monsalve et al.
(2016) report that the multiplier of EU agricultural funds for value added for rural
development is smaller than one. However, especially for low-skilled employment the
multiplier is considerably higher. It must be noted, though, that the analysis used a multi-
regional Input-Output model, such that induced effects are not considered, while these are
part of our analysis based on the ASTRA model. Mary et al. (2013) used a computable
general equilibrium (CGE) model to show a cumulative multiplier for rural development of
2.1 in an ex-post evaluation. For urban policies, the multiplier is considerably higher.
However, the analysis is made only for one region (Cordoba in Spain) and most likely
cannot be generalised for the whole EU. In general, it seems that the average GDP
multiplier of TEN-T core network implementation of 3.3 is likely to be higher than the
impacts of funds dedicated to agriculture.The impact of TEN-T completion - Synthesis 25
The change in employment induced by the TEN-T core network implementation between
2017 and 2030 is presented in Figure 10. The Baltic-Adriatic corridor (BAC) shows the
highest multiplier with about 24,000 additional job-years per billion Euro invested
(expressed in 2005 prices) by 2030. The high employment multiplier of the BAC results
from the large investments placed in Poland that shows a large impact due to its sectoral
structure, as well as their labour productivity (see Figure 8). Low multipliers are projected
for the Rhine-Alpine and the Scandinavian-Mediterranean corridors, below 10,000
additional job-years per billion Euro invested (expressed in 2005 prices). The reason is
that these corridors pass through countries with comparably high labour productivity so the
same increase in investments leading to growth in value-added would then translate into a
significantly lower impact on employment.7 The high labour productivity also causes
salaries to be higher and thereby employment is often substituted for capital. The average
multiplier for the whole TEN-T core network is above 13,000 additional job-years per billion
Euro invested (in 2005 prices).
Source: ASTRA model
Figure 10: Employment multipliers for the TEN-T core network implementation
between 2017 and 2030
7
To derive employment from value-added the latter needs to be divided by the productivity in
Euro/FTE. High values for productivity then lead to small numbers for employment.The impact of TEN-T completion - Synthesis 26
4.4 Long-term economic outlook of TEN-T core network impacts
Transport infrastructure assets have long lifetimes. Therefore, it is reasonable to test the
longer-term impacts of the full implementation of the TEN-T core network by 2030. This
has been performed by running the ASTRA model until 2040 without adding further
investments or other policy measures between 2030 and 2040. The results show the
medium to long-term (until 2040) second-order effects of the TEN-T core network
implementation taking place between 2017 and 2030. EU GDP is projected to increase by
2.6% in 2040 relative to the Baseline, compared to 1.6% in 2030. The additional jobs
created amount to 1,166,000 in 2040, compared to 797,000 in 2030. Thus, the longer-term
effects increase further. In other words, the economy is lifted on a higher growth path due
to the investment through long-acting mechanisms such as increases in productivity
enabled by the improved transport system.
5 Limitations
The objective of this study is to assess impacts on economic growth and employment at
EU level following the completion of the TEN-T network.
The study is not a transport forecasting study, since the approach required that the
projections of transport activity, GHG emissions and economic indicators were aligned to
the updated EU Reference Scenario 20168. It is also not intended to provide estimates of
traffic volumes along the CNCs, nor to replace the CNCs transport market studies.
The updated EU Reference Scenario 2016 also does not consider the policies recently
adopted at the EU level for 2030 (i.e. the recast of the Renewables Energy Directive, the
revision of the Energy Efficiency Directive and the Effort Sharing Regulation), and those
recently proposed by the Commission (i.e. the first "Europe on the Move" package in May
2017, the second Mobility Package in November 2017 and the third "Europe on the Move"
package in May 2018). It also does not consider the National Emissions Ceilings (NEC)
Directive (2016/2284/EU). Taking these policies into account would lead to higher savings
of CO2 emissions and air pollutants on the core TEN-T network.
Since the Reference scenario does not consider the decarbonisation policies recently
adopted by the EU and those currently in the pipeline, the modelled impacts on GHG
8
The updated EU Reference scenario 2016 includes some updates in the technology costs
assumptions (i.e. for light duty vehicles) and several policy measures adopted after its cut-off
date (end of 2014) such as the Directive on Weights and Dimensions, the 4th Railways
Package, the NAIADES II Package, the Ports Package, the replacement of the New European
Driving Cycle (NEDC) test cycle by the new Worldwide harmonised Light-vehicles Test
Procedure (WLTP). It has been developed with the PRIMES-TREMOVE model (i.e. the same
model used for the EU Reference scenario 2016) by ICCS-E3MLab (Capros et al. 2016). A
detailed description of this scenario is available in the Impact Assessment accompanying the
Proposal for a Directive amending Directive 1999/62/EC on the charging of heavy goods
vehicles for the use of certain infrastructures, SWD (2017) 180The impact of TEN-T completion - Synthesis 27 emissions presented in this study are conservative - reflecting the impact of infrastructure focussed policies but not the vehicle technology focussed policies. The study considers different compositions of the vehicle fleet in the Baseline and in the Reference scenario as a result of the implementation of the TEN-T core network, since the investments are expected to stimulate higher penetration of alternatively fuelled and electric vehicles. More specifically, for passenger cars the share of battery electric vehicles in 2030 at the EU28 level is assumed to increase from 1.4% in the Baseline scenario to about 2% in the Reference scenario. Similarly, the share of fuel cell cars is assumed to go up from 0.1% in the Baseline to 0.3% in the Reference scenario. Similar increases are assumed for light commercial vehicles, while for heavy goods vehicles assumptions concern the uptake of LNG vehicles (their share going up from 2.1% in the Baseline to 2.6% in the Reference scenario). This study does not consider changes in charges (i.e. rail access charges, road charges etc.), or assumptions on other policies in the transport sector except for those explicitly mentioned in the report. Assumptions on reductions in rail operational costs are only driven by the deployment of the European Railway Traffic Management System (ERTMS) over time. The impact of Brexit is not analysed by the study. The most detailed level of the economic analysis is at the Member State level. Regional analyses at more detailed levels may be undertaken by using the total national impact as a benchmark input and other methodologies to analyse the regional impacts at the level of NUTS-zones.
The impact of TEN-T completion - Synthesis                                                  28

6 Conclusions and Recommendations
The study has analysed the full TEN-T core network implementation by 2030, which
consists of the nine core network corridors (CNC) and the remaining part of the core
network that is not part of any CNC. On the CNC, 3,037 projects were identified that will be
completed between now and 2030, requiring an investment of 438 billion Euro in 2005
prices. Additional investments of 118 billion Euro are assumed to take place on the core
network outside the CNC. In total the core network investment considered by the study
amounts to 556 billion Euro until 2030.

Following the full implementation of the TEN-T core network in 2030, rail passenger
activity is expected to increase by 8.4% in the Reference scenario relative to the Baseline
(8.9% at the EU15 level and 6.0% at the EU13 level). Conversely, there are reductions in
road (-0.7%) and air transport (-0.4%) activity taking place as a consequence of the
increased rail performance. The completion of the core TEN-T network is also expected to
lead to an increase in rail freight transport activity of 4.7% in 2030 relative to the Baseline
(5.8% for the EU15 and 2.7% for the EU13); road freight transport activity would decrease
by about 0.4% and the activity of inland waterways would go up by 0.6% in 2030 relative to
the Baseline. The results thus show modal shift towards more sustainable transport modes
like rail and inland waterways, due to their increased competitive position.

In terms of carbon dioxide (CO2), savings of 12.5 million tonnes take place in 2030 relative
to the Baseline as a result of the full TEN-T core network implementation. This is expected
to lead to a cumulative reduction of CO2 emissions from the transport sector of about 72
million tonnes between 2017 and 2030, of which 26 million tonnes are from TEN-T core
network completion and the rest from measures to promote cleaner vehicle technologies
enabled by the refuelling/recharging infrastructure for alternative fuels and electro-mobility.
This adds to the savings already generated by the part of TEN-T network completed
between 1990 and 2016.

Modal shift to environmental friendly modes also reduces the emissions of air pollutants
from transport. NOx emissions decrease by 11,000 tonnes (-0.7%) in 2030 compared with
the Baseline. Emissions of particulate matter (PM) reduce by 0.7% in 2030 in the
Reference Scenario versus the Baseline.

In terms of economic impacts, GDP would increase by 1.6% in 2030 relative to the
Baseline and an additional 797,000 full-time equivalent jobs would be generated due to the
completion of the core TEN-T network. The growth impact differs substantially between the
EU13 (+4.2%) and the EU15 (+1.4%). These large differences between countries are
linked to: (1) the share of TEN-T investments in the total investments undertaken in a
country, and (2) country specific economic endowments (e.g. labour productivity in certain
sectors).

The economic impact can also be shown in relation to the level of investments. The GDP
multiplier of the TEN-T investments amounts to 3.3, which indicates that for every euro
invested, 3.3 euros of additional GDP are created. In terms of employment, for every billion
The impact of TEN-T completion - Synthesis 29
euro invested into the TEN-T core network between 2017 and 2030 an average of 13,000
additional job-years are generated.
The full TEN-T impacts are larger than those already presented, since TEN-T
implementation commenced during the 1990s and accelerated during the 2000s, gaining
further momentum after 2010, in particular fostered by the increased funds provided by the
EU to network elements delivering high EU added-value (e.g. cross-border projects).
CNC are the most important instrument to organise and drive the implementation of the
TEN-T core network. The CNC benefit from a focussed effort to upgrade their
developments to high quality standards as defined by the TEN-T regulation. In particular,
rail networks are addressed by the CNC as well as inland waterway networks on selected
corridors. Along the CNC, bottlenecks are eliminated, cross-border links are established or
upgraded and the travel speeds are increased. The results at the level of CNC in terms of
rail travel time savings and stimulating modal shift are very promising.
Looking at the whole transport system - of which the core network is an important element-
and taking all rural and urban transport infrastructure into account, the impact on total
modal split is of the order of one-digit percentage changes. This is still remarkable
considering that many MS benefit from only one or two CNC. The economic impacts
delivering an increase of 1.6% in European GDP reveals the benefit of the TEN-T policy to
focus on a core network that better connects European regions. The concept of the core
network corridors can be extended in a fruitful manner by connecting the CNC with
regional networks, which can be done in several ways:
via multi-modal terminals enabling the use of other modes for regional distribution.
via upgrading selected links of the comprehensive network, thereby closing gaps in
the regional distribution networks.
via eliminating organisational barriers that still exist at borders even after the cross-
border infrastructure has been upgraded for the more environmental friendly
modes.
The next decade still requires a focus on the completion of the CNC to reap the benefits of
a strong and integrated network covering Europe, which over time is becoming seamlessly
integrated with the regional networks. Taking the two approaches of full implementation of
regional networks and linking various national regional networks across the borders with
each other fits best to the vision of a European integration that benefits both people and
the economy..
Of equal importance is the objective of transport decarbonisation. TEN-T core network
implementation contributes to decarbonisation by fostering modal shift towards more
environmentally friendly modes. However, like other infrastructure programmes, it cannot
solve the decarbonisation problem alone. It must be complemented by other policies to
increase the efficiency of the transport system and to promote low-emission alternativeThe impact of TEN-T completion - Synthesis 30 energy for transport, and low- and zero emission vehicles. This has been acknowledged in the 2016 EU strategy on low-emission mobility.
The impact of TEN-T completion - Synthesis                                                                                   31

List of figures

Figure 1:         Major elements of the project methodology .............................................. 12

Figure 2:         Changes of travel time by rail freight in the Reference Scenario relative to
                  Baseline in 2030 (% change to the Baseline) ........................................... 14

Figure 3:         Changes of travel time by passenger rail in the Reference Scenario
                  relative to Baseline in 2030 (% change to the Baseline) ........................... 16

Figure 4:         Changes in travel time by rail for passengers (left hand side) and freight
                  (right hand side) by CNC relative to the Baseline in 2030 (% change) ..... 17

Figure 5:         Changes in passenger transport activity (territoriality approach) of the
                  NUTS1 regions crossed by the core network corridors (CNC) relative to
                  the Baseline in 2030 (% change) – rail on left hand side, road on right
                  hand side ................................................................................................... 18

Figure 6:         Change of freight transport activity by road and rail (territoriality approach)
                  in the NUTS1 regions crossed by the core network corridors (CNC)
                  relative to the Baseline in 2030 (% change) – rail on left hand side, road on
                  right hand side ........................................................................................... 19

Figure 7:         Changes in GDP in 2020 and 2030 in the Reference scenario relative to
                  the Baseline, by country ............................................................................ 22

Figure 8:         Additional jobs created in 2020 and 2030 in the Reference scenario
                  relative to the Baseline, by country ........................................................... 23

Figure 9:         GDP multipliers for the TEN-T core network implementation between 2017
                  and 2030 ................................................................................................... 24

Figure 10:        Employment multipliers for the TEN-T core network implementation
                  between 2017 and 2030 ............................................................................ 25
The impact of TEN-T completion - Synthesis 32
List of tables
Table 1: TEN-T investments on the CNC by investment type (in millions of euros,
2005 prices) .............................................................................................. 13
Table 2: Changes in inland freight transport activity (territoriality approach) in the
Reference scenario relative to Baseline in 2030 – difference in millions of
tonne-kilometres and % changes .............................................................. 15
Table 3: Changes in inland passenger transport activity (territoriality approach) in
the Reference scenario relative to Baseline in 2030 – difference in million
passenger-kilometres and % changes ...................................................... 16
Table 4: Changes in GDP and employment in the Reference scenario relative to
the Baseline due to the TEN-T core network implementation between 2017
and 2030 ................................................................................................... 21
Table 5: Changes in cumulative GDP and cumulative jobs due to the TEN-T core
network implementation between 2017 and 2030 ..................................... 21The impact of TEN-T completion - Synthesis 33
7 References
Capros, P., De Vita, A., Tasios, N., Siskos, P., Kannavou, M., Petropoulos, A., ... &
Paroussos, L. (2016). EU Reference Scenario 2016 - Energy, transport and GHG
emissions Trends to 2050.
Mary, S., Santini, F., Espinosa, M., Cardenete, MA., Gomez y Paloma, S. (2013). The
rural-urban spillovers of EU structural policies in Cordoba, Spain. JRC Scientific and
Policy Reports. JRC85301, doi:10.2791/33016.
Monsalve, F., Zafrilla, JE., Cadarso, MA. (2016). Where have all the funds gone?
Multiregional input-output analysis of the European Agricultural Fund for Rural
Development. Ecological Economics 129:62-71.The impact of TEN-T completion - Synthesis 34
HOW TO OBTAIN EU PUBLICATIONS
Free publications:
• one copy:
via EU Bookshop (http://bookshop.europa.eu);
• more than one copy or posters/maps:
from the European Union’s representations
(http://ec.europa.eu/represent_en.htm);
from the delegations in non-EU countries
(http://eeas.europa.eu/delegations/index_en.htm);
by contacting the Europe Direct service
(http://europa.eu/europedirect/index_en.htm) or calling 00 800 6 7 8 9 10 11
(freephone number from anywhere in the EU) (*).
(*) The information given is free, as are most calls (though some operators, phone boxes or hotels may
charge you).
Priced publications:
• via EU Bookshop (http://bookshop.europa.eu).
Priced subscriptions:
• via one of the sales agents of the Publications Office of the European Union
(http://publications.europa.eu/others/agents/index_en.htm).You can also read