Coventry Building Society
←
→
Page content transcription
If your browser does not render page correctly, please read the page content below

Coventry Building Society

Disclaimer
The following disclaimers apply to the presentation materials following this page. You are advised to read this page carefully before reading, accessing or
making any other use of the presentation materials.
• This presentation is the property of Coventry Building Society (the “Society”) and has not been approved by any regulatory authority. The presentation and its contents
  are provided strictly for information purposes only for the sole use of the parties to whom it is delivered and may not be reproduced in any form or further distributed to
  any other person or published, in whole or in part, for any purpose. Failure to comply with this restriction may constitute a violation of applicable laws. By reading this
  presentation, you agree to be bound by the following limitations.
• This presentation has not been prepared, and is not being made available, in connection with any offer of securities. It does not constitute a prospectus or other
  offering document. Nothing in this presentation shall constitute an offer to sell or the solicitation of an offer to buy any securities, and no regard should be had to this
  presentation, nor any reliance placed on any of the information contained herein, in connection with any investment decision in respect of any securities. The
  information in this presentation is not intended to be, and must not be, relied on as advice for making investment decisions. The Society accepts no responsibility or
  liability whatsoever in connection with any such use.
• This communication is made to and directed only at persons in the United Kingdom who are (i) professional investors falling within Article 19(5) of the Financial
  Services and Markets Act 2000 (Financial Promotion) Order 2005 (as amended) (FPO), (ii) high net worth entities falling within Article 49(2)(a) to (d) of the FPO and
  (iii) other persons to whom it may lawfully be made (together, Relevant Persons). Securities to which this presentation relates are only available to Relevant Persons
  and no other persons should act upon it. It is not intended for retail investors or otherwise to be made generally available to the public in the United Kingdom or
  elsewhere.
• The statements of fact in this presentation have been obtained from and are based on sources the Society believes to be reliable. The Society does not guarantee
  their accuracy, and any such information may be incomplete or condensed. All information contained in this presentation speaks as of the date of this presentation
  unless otherwise stated, is subject to change without notice and has not been independently verified. The Society is under no obligation to update or keep current the
  information contained herein.
• No representation or warranty, express or implied, is or will be made by the Society, its affiliates, advisers or representatives or any other person as to, and no
  reliance should be placed on, the truth, fairness, accuracy, completeness or correctness of the information or the opinions contained herein (and whether any
  information has been omitted from this presentation). To the extent permitted by law, the Society and each of its directors, officers, employees, affiliates, subsidiaries,
  advisers and representatives disclaim all liability whatsoever (in negligence or otherwise) for any loss however arising, directly or indirectly, from the use of this
  presentation or its contents or otherwise arising in connection with this presentation.
• Certain statements in this presentation may constitute "forward-looking statements". Forward-looking statements are sometimes, but not always, identified by their
  use of a date in the future or such words as "anticipates", "aims", "believes", "continue", "could", "due", "estimates", "expects", "goal", "intends", "may", "plans",
  "project", "seeks", "should", "targets", "will" or the negative or other variations of these terms and related and similar expressions. These statements reflect the
  Society’s current expectations and are subject to risks and uncertainties that could cause actual results or developments to differ materially from any expected future
  events or results referred to in or implied by these forward-looking statements, which could adversely affect the outcome and financial effects of the plans described in
  this presentation. You are cautioned not to rely on such forward-looking statements, which speak only as of the date that this presentation was prepared. The Society
  does not undertake any obligation to update or revise any forward-looking statements, whether as a result of new information, occurrence of unanticipated events or
  otherwise, except where required under applicable law.
• Nothing in this presentation should be construed as legal, tax, regulatory, financial, accounting or investment advice.
• Certain data in this presentation has been rounded. As a result of such rounding, the totals may vary slightly from the arithmetic total of such data.
• The Society is authorised by the Prudential Regulation Authority and regulated by the Financial Conduct Authority and the Prudential Regulation Authority.

1.   Overview
2.   Capital and Liquidity
3.   Asset Quality
4.   Covered Bonds
5.   UK Economy
6.   Contact Details
Overview

Overview
                      What is a Building Society                                                                Regulation

            Building societies are mutuals - owned by their members, both savers                 Governed by the Building Societies Act 1986.
             and borrowers.                                                                       Regulated by the FCA & PRA.
            There are no external shareholders, therefore no external dividends are              Minimum of 50% of funding must come from retail markets (actual
             paid out, with all profits retained in the business for the benefit of                76.1%).
             members.                                                                             Additional controls in place from PRA to enhance safety
            A safe home for savers is the primary driver, together with the provision
             of mortgage loans.
            Focus on profit optimisation rather than maximisation.
            Coventry is the 2nd largest building society and the 7th biggest lender in
             the UK1

                                                                                                                        Assets                   Liabilities
                                    Top 10 mortgage lenders market share1                                            (Use of Funds)           (Source of Funds)
      25.0%
                 21.2%
      20.0%

      15.0%                  12.9%                                                                                                          Retail funding from
                                      11.3%                                                                        Mortgage loans to
                                              10.0%   9.6%                                                                                       Members
      10.0%                                                                                                           Members                       72%
                                                             6.0%                                                        85%
       5.0%                                                         2.6%   2.5%   2.5%    2.1%

       0.0%                                                                                                                                 Wholesale Funding
                                                                                                                 Liquid assets (Including         22%
                                                                                                                          BoE)
                                                                                                                           14%                 Reserves 5%
                                                                                                                        Other 1%                  Other 1%

                                                                                                                                                                     5
1. Source: CML Gross Lending 2017
Overview
                          Simple business model                                                                                                            Financial Strength

               Providing simple, transparent retail savings products which offer long
                                                                                                                                             Strong CET1 ratio highest reported by any top 20 lender.1                                         35.5%
                term value.
               Helping customers buy residential properties through low risk                                                                Management expense ratio lowest reported by any top 10 UK
                                                                                                                                                                                                                                               0.46%
                mortgage lending primarily through intermediaries.                                                                           building society.
               Delivering sustainable organic growth without taking on higher levels                                                        Leverage ratio exceeds regulatory requirements.3                                                  4.6%
                of risk to protect existing members during periods of economic stress,
                and to safeguard the Society’s future.                                                                                       The 2nd Largest Building Society in the UK
               Ensuring operations are cost efficient, allowing the society to pay
                above market interest rates to savers, whilst investing in the future and                                                                            Long term                Short term                Last credit opinion
                maintaining capital strength.                                                                                                   Moody’s                    A2                      P-1                        June 2018
               Underpinned by our CARES values which shapes decision making and
                focuses on putting members first.                                                                                                 Fitch2                    A                       F1                        May 2018

                                        Low risk                                                                                                               Member Focus

               Low LTV lending and third party distribution provides resilience to the                                                    Mortgage and savings rates remain competitive with pricing
                business model if the market deteriorates.                                                                                  supported by low levels of operating costs, impairments and conduct
               Strong margin management capability, with the capacity to increase                                                          provisions.
                margin if needed.                                                                                                          The Society paid an average 1.49% interest on savings in 2017,
               28% of mortgages and 63% of savings on administered rates at 30 June                                                        compared to the market average 0.63%.4
                2018.                                                                                                                      Awarded Fairer Finance Clear and Simple Mark for our General
               Nationwide distribution of savings and mortgage avoids geographical                                                         Terms for savers.
                concentration.

•   1. Source: CML Top 20 mortgage lenders (as published August 2017) - latest published CET 1 data As at 30/06/18 2.Fitch rating unchanged for 20 years 3.Under the BoE modified calculation excluding Central bank exposure less than 3 months
•   4. The Society’s average month end savings rate (society mix of products) compared to BoE WA rate for household interest bearing deposit (market mix of products)                                                                                  6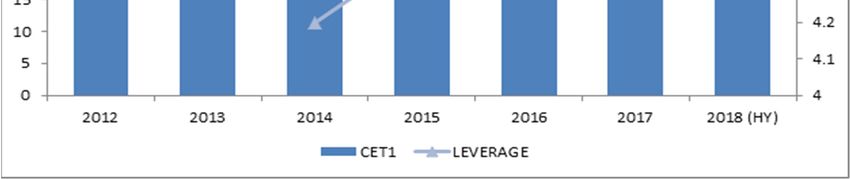
Financial performance

                                                           Financially safe and strong institution with a CET1 ratio, the highest reported by top 20
         Capital                                           lender1 at 35.5% and a leverage ratio of 4.6%2 , reflecting the low credit risk business model.

                                                           Continued focus on cost control with the costs to mean assets ratio at 0.46%, the lowest
             Cost                                          reported by any UK building society. 1

 Impairments                                               Impairment credit of £1.0m, strong asset performance continues.

                                                           Mortgage assets have increased by £1.5bn and Savings balances increased by £0.4bn.
        Growth                                             Mortgage balance growth 4.1% in H1, Savings growth of 1.3%.

                                                           Net interest margin at 100bps, in line with expectations, as the Society continues to reward
             NIM                                           members with competitive products.

           Profit                                          Profit before tax of £113.1m - 0.6% increase on H1 2017.

                                                                                                                                                                                                            7
 1. Source: CML Top 20 mortgage lenders (as published August 2017) - latest published CET 1 data As at 30/06/2018 2.Under the BoE modified calculation excluding Central bank exposure less than 3 months
Financial performance
Large Proportion of Administered Rates Retail Funding led Lending Strategy
Consistent growth in mortgage balances growing by over 4.1% in 2018.
Whilst margins have benefitted from the effects of government funding Mortgage assets continue to be of very high quality with the balance
on retail pricing, the proportion of administered products allows weighted average indexed LTV of the mortgage book at just 53.7% as at
commercial scope to manage margin if required. 30 June 2018.
Coventry’s Flexx for Term mortgage offering, attracts borrowers to Competition continues to return to the mortgage market and we have
administered rate products. seen a focus from other lenders on higher LTV lending and first time
Retail savings growth of 5% over the previous 12 months versus market buyers. However our resilient business model, focused on low risk, low
growth of 2.7%.2 LTV lending, has remained.
Over 90% of mortgages are funded by retail savings or capital.
Savings Mortgages Retail balances growth
Fixed 40.0
Mortgages Savings
35.0
Administered
30.0
37% 25.0
28%
20.0
35.9 37.4
15.0 32.9 31.0 31.4
27.0 29.4 28.1
63% 72% 24.1 23.4 25.4
10.0 21.3
5.0
-
2013 2014 2015 2016 2017 H1 2018
8
1. The Society’s average month end savings rate (society mix of products) compared to BoE WA rate for household interest bearing deposit (market mix of products) 2.Source: Bank of EnglandFinancial performance
Investment for the Future to create competitive advantage
Level of IT and technology change is rising as a result of:
Rising customer expectations for service delivery and enhanced functionality;
Higher levels of cyber threat;
Increased expectations from regulators.
Our capital strength, low cost base and long term view enable us to invest despite a competitive market.
Infrastructure Transformation
Branch network re-design Summit Replacement Programme
Programme
Important face of the Society with the To enhance operational resilience we are Planning the upgrade of our core banking
membership which builds trust and progressing a move to a co-located / cloud platform to provide greater flexibility in
engages the community. hybrid datacentre environment. responding to changing customer needs and
Branches account for over 30% of retail Will provide dedicated and resilient point to regulatory requirements, more quickly and
savings acquisition each year and manage point connectivity. cheaply.
around £10.5bn of the total retail book. Cloud technology adopted subject to Enhancements will create future competitive
70 branches concentrated in our rigorous risk assessment. advantage.
heartland. Enable scalability of operation, and achieve Supports product and change agility and cost
The re-design of the branch network will economies of scale in a safe and secure efficiency
meet evolving needs of members and way. Is a better base on which to build out digital
better reflect the future of branch capabilities, streamline customer journeys
engagement and integrate into an Open Banking market
Flexible design principles will future proof Build resilience of both architecture and
our branches. software
9Capital and Liquidity
Capital
                                                                                                      CET1 and leverage ratios1

      Capital and Reserves                                                                                                                        Leverage Ratio Framework

  The Society has been issued with a TCR by the regulator of 11.3% of                                                             A binding UK leverage ratio applies to firms with retail deposits of
   RWAs, which is comfortably exceeded. This was a reduction of the                                                                 £50bn or more. This is not expected to be binding until at least 2020.
   previous ICG of 12.8%                                                                                                           The components of the UK leverage ratio framework are a minimum
  Retained earnings from strong profitability are Coventry’s primary                                                               ratio of 3.25% (excluding Central Bank exposures below 3 months to
   source of CET1 capital, currently c. £1.54bn.                                                                                    maturity). The CCyB is set by the FPC and is currently 1% not enforced
  Internally generated capital is augmented by £400m of AT1 issuance.                                                              until November 2018. 2
  The whole loan sale of non-member buy-to-let mortgages to a third                                                               The modified leverage ratio on a PRA basis at 30 June 2018 is 4.6%
   party in 2015 and 2018 provide further capital management options.                                                               (4.1% when Bank of England reserve account is included), comfortably
                                                                                                                                    above the 3.25% minimum level (3.6% including the CCyB).

                                                                                                                                                                                                     11
1.The BoE modified calculation excluding Central bank exposure less than 3 months 2.For Leverage Counter cyclical leverage buffer (CCLB) is calculated as 35% of 1% CCyB
Capital and Accounting Future
MREL
3,000
PIBS AT1 CET1
Under the rules the Society is required to meet an interim MREL
MREL requirement is 2x Leverage + Buffers
requirement of 18% of risk weighted assets by 1 January 2020. The
indicative end-state MREL requirement for all firms will be twice the binding
capital requirement, for the Society this is currently two times Pillar 1 and 2,500
Pillar 2a or 22.3% of risk weighted assets. The Society currently exceeds this Additional
required
constraint. If leverage becomes the binding constraint for the Society, this £700m
will result in the need to raise MREL eligible debt.
As at H1 2018, an additional requirement of £700m of MREL would be
2,000
required to meet 2x leverage constraint
This requirement will be expected to grow in the years leading up to 2022,
as the balance sheet grows, however, this equates to a manageable 3 to 4
MREL transactions
1,500
1,000
Requirement
on a 3.25%
basis
500
-
Leverage MREL
12Basel IV Capital implications
Basel IV
BCBS Paper released in December 2017 outlining Standardised Risk Weights and output floors that seek to remove variability in internal models (IRB).
Regulation and implications still need finalising and have national discretion (especially in the treatment of differing mortgage types).
Output floor phased in from 50% in 2022 to 72.5% in 2027.
Assuming the implementation of 50% output floor, the CET1 ratio reduces materially but remains above 22% reflecting the impacts of the flooring on a low risk
business model.
Surplus to regulatory minima remains considerable, equal to over 8 times the actual credit losses experienced in the last 10 years.
Surplus over Basel IV Requirement1
CET1 ratio: 35.5%
CET1 ratio:
c. 24%
CET1 ratio:
c. 17%
13 x losses 11 x losses 8x losses
incurred in incurred in incurred in
previous 10 previous 10 previous 10
years years years
Current Transition (50% Floor) End State (72.5% Floor)
13
1. Based on Portfolio Landlords (landlords with 4 or more properties) risk weighted as real estate exposures with repayment materially dependant on cash flows generated by propertyLiquidity
Liquidity LCR / NSFR
Over 99% of core liquidity is eligible as High Quality Liquidity Assets Buffer The Society maintains liquidity considerably above regulatory
and consists of UK Government or Bank of England assets. requirements with LCR 177% as at 30th June 2018.
Core liquidity holdings are solely UK exposure, the Society has no direct The NSFR was 144% as at 30 June 2018, which is consistent with the year-
exposure to peripheral Eurozone countries. end position (145%).
The UK authorities have placed increased emphasis on contingent The Loan to Deposit ratio was 116% reflecting the stable funding profile
liquidity, from central bank facilities via the pre-positioning of loan books, of the Society
retained bonds and other assets. The Society prepositioned additional
mortgage assets in January 2018 as part of its ongoing liquidity
management strategy.
Core Liquidity1 Contingent Liquidity2
Supranational Offa RMBS
Bonds 1% Gilts 2% 2%
Retained Mercia
Covered RMBS
Bonds 21%
£4.6bn £4.6bn 31%
Core Liquidity Contingent Liquidity2
Pre-
BoE Reserves Positioned
97% Loans
46%
14
1.Showing value of unencumbered assets as at 30 June 2018 – The Society held £750m Gilts in repurchase agreements as at 30 June 2018. 2. including £2.1bn unencumbered prepositioned loans at the BoEWholesale funding
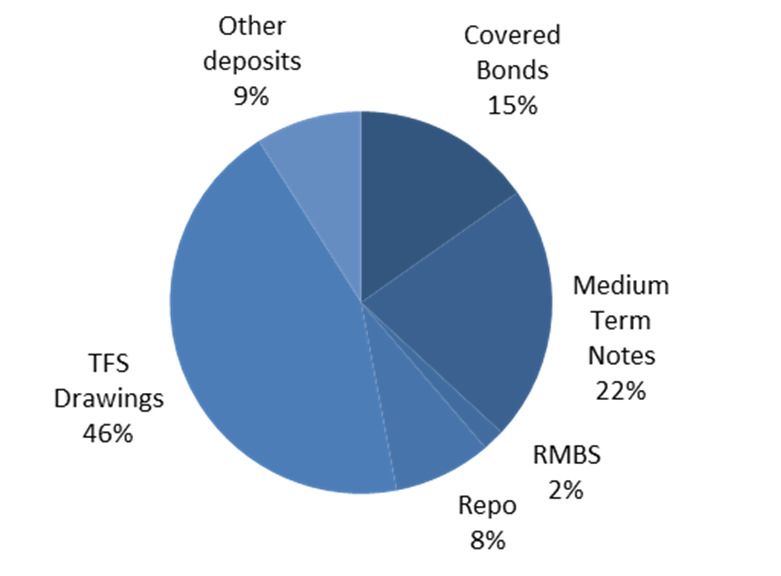
Funding Strategy Wholesale Funding as at 30 June 2018
Retail deposits are supplemented by a number of wholesale funding options.
Wholesale market access provides competitive advantage and diversification of funding via:
MTNs.
Covered Bonds.
Securitisation.
Continued move towards longer dated wholesale deals providing reliable long term funding.
Wholesale funding ratio 23.9% as at 30 June 2018.
TFS drawings of £4.25bn as at 30 June 2018, No FLS remaining.
Wholesale funding maturity profile2
1800
1600
Senior
1400
350
1200
1000 EUR Senior
580
800
600 AT1
Securitisation
400
400 Covered Bond 178
Senior 650 Covered Bond Senior Senior Covered Bond
200 450
350 400 400 400
0
2019 2020 2021 2022 2023 2024
15
1. Current value after amortisation 2. In GBP, excluding TFSAsset Quality
Asset quality - Origination
Coventry Origination
Intermediaries Telephone / Post Branch
91.2% 8.0% 0.8%
Relationship
management team 70 branches, 21
Inbound call centre
agencies
BDMs – UK wide
CeMap qualified CeMap qualified
Intermediary Support mortgage advisors mortgage advisors
Industry Origination
80% Industry Intermediary Business1
Mortgage market reforms favours independent advice
Intermediaries advise customer for best outcome 75%
Search whole of market for customer 70%
Gives national distribution to lenders 65%
60%
55%
50%
45%
40%
Q2 2005
Q4 2005
Q2 2006
Q4 2006
Q2 2007
Q4 2007
Q2 2008
Q4 2008
Q2 2009
Q4 2009
Q2 2010
Q4 2010
Q2 2011
Q4 2011
Q2 2012
Q4 2012
Q2 2013
Q4 2013
Q2 2014
Q4 2014
Q2 2015
Q4 2015
Q2 2016
Q4 2016
Q2 2017
Q4 2017
Q2 2018
17
1. Source: CML by ValueAsset quality
Gross lending ≤ 75% LTV2
Low Risk Loan-to-Value (LTV)
PRA CBS
82% of lending in the first half of 2018 has been at LTVs of 75% or below, 90% 84%
81% 82%
in comparison to the market average of 65% 80% 77%
Market lending above 90% in the first half of 2018 was 3.9%1; Coventry
lending above this LTV was nil. 70% 64% 65% 66% 64%
No sub-prime, commercial or second charge lending (legacy inherited
60%
commercial book currently £2.5m in run off).
Negligible levels of unsecured lending (£26.1m: HY 2018, 31.8m: 2017 ). 50%
The balance weighted average indexed LTV of the entire mortgage book
40%
is 53.7% as at HY 2018.
97% of the overall book has an indexed LTV of 85% or less as at HY 2018. 30%
In the first half of 2018 circa 70% of all buy-to-let lending was originated
at 65% LTV or less. 20%
10%
0%
Q3 2017 Q4 2017 Q1 2018 Q2 2018
Total book split by product2 Total book split by LTV2
Other, 0.6% 85-95, 3% >95, 0%
75-85, 8%Asset quality
Geographic Split Mortgage Book Performance
The majority of the UK mortgage market is introduced via The Society’s arrears performance continues to improve and to be
intermediaries (e.g. independent financial advisors, mortgage brokers, significantly better than the industry as a whole.
estate agents). The value of loans in arrears by ≥ 2.5% of the mortgage balance at 30
Intermediaries give national coverage and support the geographic June 2018, as a proportion of the total book, has fallen to 0.12%.
diversification of the mortgage book. At 30 June 2018, only 37 properties were in possession.
Crucially, all underwriting and servicing is performed by Coventry. Arrears are very rarely capitalised. There was only 1 case in HY18 for
There is no ‘packaging’; the intermediary acts solely as an introducer. Coventry versus 2,400 for the industry as a whole up to Q1.
IFRS 9 introduced in 2018, with a small decrease of impairment for
consumer loans and a negligible impact on regulatory capital.
Geographic distribution by value1 Arrears ≥ 2.5% of mortgage balance (including possessions)1
Wales and 3.0
Scotland,
South West Northern
3.6%
England, Ireland, 2.5
9.1% 2.5%
% Loan Book by Value
2.0
East of London, 1.5
England, 26.6%
11.3% 1.0
Northern
0.5
England,
13.7% South East
England, 0.0
Central Q1 Q2 Q3 Q4 Q1 Q2 Q3 Q4 Q1 Q2 Q3 Q4 Q1 Q2 Q3 Q4 Q1 Q2 Q3 Q4 Q1 Q2 Q3 Q4 Q1 Q2 Q3 Q4 Q1 Q2 Q3 Q4 Q1 Q2 Q3 Q4 Q1 Q2 Q3 Q4 Q1 Q2 Q3 Q4 Q1 Q2
England, 18.4% '07'07'07'07'08'08'08'08'09'09'09'09'10'10'10'10'11'11'11'11'12'12'12'12'13'13'13'13'14'14'14'14'15'15'15'15'16'16'16'16'17'17'17'17'18'18
PRA CBS
14.8%
19
1. As at 30/06/18Asset quality
Robust Origination and Monitoring Impairment charges as % of loans
Coventry has strong and experienced central underwriting and collections
Net UPL loan charges
teams, with no outsourcing.
The Credit Risk department analyses the performance of the mortgage book and 0.01 Charges on products no longer originated
conducts quality assurance assessments.
We consistently target low risk areas of the mortgage market, primarily low LTV Charges on products still originated
owner occupier and buy-to-let. 0.01
No lending has been advanced at more than 90% LTV since 2009.
0.03 Impairment charge release for
2015, 2016 and H1 18
0.02 0.02
0.001 0
2012 2013 2014 2015 2016 2017 H1 2018
20
Average Society Possessions per month Very Low Impairments
18
16 Impairments are very low on a mortgage book of £37.3bn.
14 Impairment charges have fallen over the recent past with releases
reported in 2015 and 2016.
12
Impairment charges in the last recession between 2008 and 2012
10 averaged c. 8 bps per year. A significant proportion (55%) of the
8 impairment charges seen in that period were on loan products that
are no longer offered e.g. unsecured personal loans. Impairments
6
have been consistently falling since exiting such markets, with the
4 continued focus being on high quality lending.
2
0
2013 2014 2015 2016 2017 YTD Jun-18
20Covered Bonds
Secured Funding Programs
Sources of Funding
                                                          Overview

                                                       • Established wholesale programme, with first covered bond issued in
                                                         2008, followed by the inaugural RMBS of Leofric issued May 2012.
  Offa £475m                                           • External wholesale issuance compliments the overall retail funding
                                                         strategy with approximately 80% of assets retail funded, even
                                                         allowing for Coventry’s strong year-on-year asset growth of c.10%.

                                                       • Diversifying funding allows us to utilise a range of sources for
Leofric £1,150m      External issuances                  alternative purposes.

                                                       • Coventry Building Society has excellent ratings with both Fitch and
                                                         Moody’s and a proven funding track record.

 Covered Bond                                          • Multi access points to wholesale markets via EMTN, Regulated
                                                         Covered Bonds and RMBS, both in Sterling and Euros.
  LLP £2,900m
                                                       • We are strongly motivated to maintain market access and investor
                                                         confidence from a funding perspective.

Mercia £1,165m       Retained notes                    • The Society has drawn down from the TFS scheme £4.25bn as at
                     (Used for BoE facilities)           February 2018, using the funds to continuing to offer competitive
                                                         member mortgages.

                                                       • Coventry Building Society has three platforms when utilising
                     Funding scheme usage                securitisation. It has separate programmes for external issuance in
  TFS £4250m         (Drawn against mortgage assets)     prime residential (Leofric) and buy-to-let assets (Offa) with no co-
                                                         mingling of the two asset types, and Mercia which is used for buy-to-
                                                         let retained issuance.

                                                                                                                               22
Covered Bonds
Covered Pool1
Series 1 - £1.5bn
Issue 22/07/08
Guaranteed by Coventry Covered Bonds LLP AAA rated by Moodys and Fitch Maturity 24/07/22
UK originated Owner Occupier Prime residential Minimum Regulatory Overcollaterisation 108%
mortgages vs CBS 140.8%
Series 2 - £500m
8 Issuances across 2 Currencies established in Ring-fenced GIC account with HSBC Bank Issued 20/11/08
2008 Coventry BS Asset Swaps Maturity 24/11/22
Regulated programme size of €7bn
Series 3 - £750m
WA LTV % Product Type Geographical Distribution Issued 19/04/11
Maturity 19/04/18
90% Yorkshire and
Humberside 6.6% East Anglia 4.3%
80%
West Midlands
East Midlands Series 4 - €650m
70% 7.6%
11.5% Issued 24/10/11
60%
41.9% Wales 2.8%
Issuance Maturity 24/10/14
50%
50.9% London 17.2%
40%
30% Series 5 - £500m
Issued 10/02/12
20% North 2.6%
Maturity 10/02/15
7.2% South West 10.3%
10%
0% Fixed rate Outer South East North West 7.4%Covered Bonds
UK RCB Regulation
The implementation of UK Regulated Covered Bond legislation is overseen by the FCA. The FCA conduct onsite visits to assess management of risks inherent in the
programme, as well as reviewing:
Appropriateness of the issuer’s oversight and governance framework Ability of the programme to make timely payment on bonds (assessed
Appropriateness of systems, controls, policies and procedures in relation to separately by both the issuer and the FCA, through two independent
risk management, underwriting, arrears and valuation cashflow models using multiple stressed scenarios)
Proficiency of cash management and servicing functions Compliance of the programme with the RCB Regulations (including the
Quality of eligible assets to meet cover pool requirements (considering programme’s remoteness from issuer insolvency)
borrower history, income verification, LTV ratios, income multipliers, arrears, Existence of procedures for identification and rectification of any potential
seasoning, loan purpose, property types and terms of the loans) issues
Ability of the assets in the cover pool to mitigate the risk of asset-liability Independent legal and audit opinion on the compliance of the issuer and
mismatches, the credit risk of assets, and other market value risks, programme with RCB Regulations
concentration risks, currency risks, basis risks and counterparty risks
Assets on the issuer’s balance sheet available to be substituted in to meet
ongoing cover pool requirements
FCA team monitors on an on-going basis:
Ensure sufficient assets in the cover pool to mitigate risk of non-timely bond Receive and analyse individual loan and pool performance data
payments Review any proposed material changes to the programme’s contractual
Provide independent assurance on further issuance that asset capability terms
remains
Monitor the impact of significant changes in asset/liability profiles of the
programmes
If an RCB issuer or RCB programme breaches any of the RCB Regulations, the FCA has the power to require correction of the breach (including by the transfer of
additional assets into the cover pool), impose financial penalties or otherwise de-register or wind-up the programme.
24Covered Bonds
Comparison of Peers1
The Co- Coventry Nationwide Skipton Yorkshire
Bank of Barclays Bank Clydesdale Leeds Building Royal Bank of Santander UK
operative Bank Building Lloyds Bank plc Building Building TSB Bank plc Building
Scotland plc plc Bank plc Society Scotland plc plc
plc Society Society Society Society
Programme Size €60 billion €35 billion €10 billion £4 billion €7 billion €7 billion €60 billion €45 billion €25 billion €35 billion €7.5 billion €5 billion €7.5 billion
Covered bond ratings
AAA/Aaa/ AAA AAA/Aaa/ AAA NR/Aaa/ AAA NR/Baa2/A NR/Aaa/AAA NR/Aaa/AAA NR/Aaa/ AAA AAA/Aaa/ AAA NR/Aaa/ AAA AAA/Aaa/ AAA NR/Aaa/ AAA NR/Aaa/NR NR/Aaa/ AAA
(S&P/Moody's/Fitch)
WA LTV (current) 60.20% 52.18% 60.89% 50.58% 48.80% 58.90% 60.20% ND 55.73% 57.83% 65.43% 56.70% 56.00%
WA LTV (indexed) 46.40% 41.29% 54.00% 39.72% 43.40% 52.70% 46.90% 48.90% 45.20% 47.51% 58.05% 48.30% 46.97%
WA seasoning (months) 136 90.44 46.64 97 50.9 44.1 99.4 84 68.98 85.95 40 58.1 77.44
Buy to let (% amount) 0.00% 0.00% 13.94% 0.00% 0.00% 13% 0.00% 0.00% 14.57% 0.00% 8.16% 0.00% 0.00%
Interest Only 48.37% 28.82% 17.67% 21.23% 5.30% 20% 37.75% 8.32% 23.34% 22.84% 9.16% 17.73% 4.98%
Arrears (over 30 days) 1.13% 0.40% 0.44% 0.00% 0.00% 0.20% 1.82% 1.00% 0.25% 0.24% 0.07% 0.45% 0.22%
Asset Percentage 87.00% 83.90% 86.21% 77.50% 87.00% 83.00% 92.00% 90.00% 90.00% 89.28% 85.00% 89.00% 88.00%
Maximum LTV 60% 75% 75% 75% 75% 75% 75% 75% 75% 75% 75% 75% 75%
Soft or Hard Soft or Hard Soft or Hard
Repayment structure Soft Bullet Soft Bullet Soft Bullet Soft Bullet Soft Bullet Soft Bullet Soft Bullet Soft Bullet Soft Bullet Soft Bullet
Bullet Bullet Bullet
National Leeds Building
Bank of Barclays Bank Coventry Lloyds Bank plc Royal Bank of Santander UK Skipton Yorkshire
Interest rate swap provider Australia Bank J.P.Morgan Society & third Nationwide TSB Bank plc
Scotland plc plc Building Society & third parties Scotland plc plc Building Society Building Society
Limited parties
Coventry
Abbey National
Barclays Bank National Building Nationwide
Bank of Lloyds Bank plc Royal Bank of Treasury
Covered Bond swap provider plc & third Australia Bank HSBC Bank plc Society, HSBC Third parties Building Society N/A N/A Third parties
Scotland plc & third parties Scotland plc Services plc &
parties Limited Bank plc, & third parties
third parties
Natixis
WA LTV v Asset %
70% 95%
60%
90%
50%
40% 85%
30% 80%
20%
75%
10%
0% 70%
1. As at 30/08/18 WA LTV Asset Percentage 25Contacts
Contact details

  Contacts
    Phil Hemsley                                         Lyndon Horwell
    Head of Capital Markets                              Treasurer
    Philip.hemsley@thecoventry.co.uk                     lyndon.horwell@thecoventry.co.uk
    02476 435076                                         02476 435079

Useful links
• Main website                http://www.coventrybuildingsociety.co.uk/
• Financial results           http://www.coventrybuildingsociety.co.uk/your-society/financial-results.aspx

                                                                                                             27
You can also read