RMBS Performance Watch: Australia - Market Overview - As of June 30, 2020 - S&P Global

Page created by Fernando Ford
 
CONTINUE READING
RMBS Performance Watch: Australia - Market Overview - As of June 30, 2020 - S&P Global
RMBS Performance Watch:
Australia - Market Overview
As of June 30, 2020
RMBS Performance Watch: Australia - Market Overview - As of June 30, 2020 - S&P Global
Australian Macroeconomic
Environment
Recovery from lockdown will be bumpy and
protracted
RMBS Performance Watch: Australia - Market Overview - As of June 30, 2020 - S&P Global
S&P Global Ratings Economic Outlook: Australia
                          2020f         2021f         Outlook                                 Effect on credit quality

Real GDP                  (4.0)         5.3           Outside of Victoria, Australia has      Negative. Reduced economic growth
forecast (% year                                      flattened the COVID-19 curve. The       will add debt-serviceability pressure
over year)                                            economy reopened and consumer           for some borrowers. Stimulus
                                                      activity rebounded in May. Recovery     packages, lower interest rates, and
                                                      may take longer than expected.          access to superannuation should help.

Unemployment              7.5           6.9           Activity is lower than normal,          Negative. Rising unemployment will
rate (year                                            subduing labor demand. We do not        put pressure on certain borrower
average; %)                                           expect a return to pre-COVID            cohorts, influenced by the sectors in
                                                      unemployment levels until 2023.         which they are employed.

CPI (%)                   1.0           1.5           Wage growth remains well below long-    Negative. Weak wage growth is likely
                                                      term averages. Spare capacity in the    to persist for some time. This will be
                                                      labor market will keep wage growth      offset by historically low interest
                                                      subdued for some time.                  rates.

Policy rate, end          0.25          0.25          The RBA has said it will not increase   Positive. Policy rate cuts tend to be
of year (%)                                           the cash rate until unemployment        effective in Australia because they
                                                      improves.                               feed through to mortgages, which are
                                                                                              mostly variable rate.

f--Forecast. CPI--Consumer price index. Source: S&P Global Ratings.

                                                                                                                                       3
RMBS Performance Watch: Australia - Market Overview - As of June 30, 2020 - S&P Global
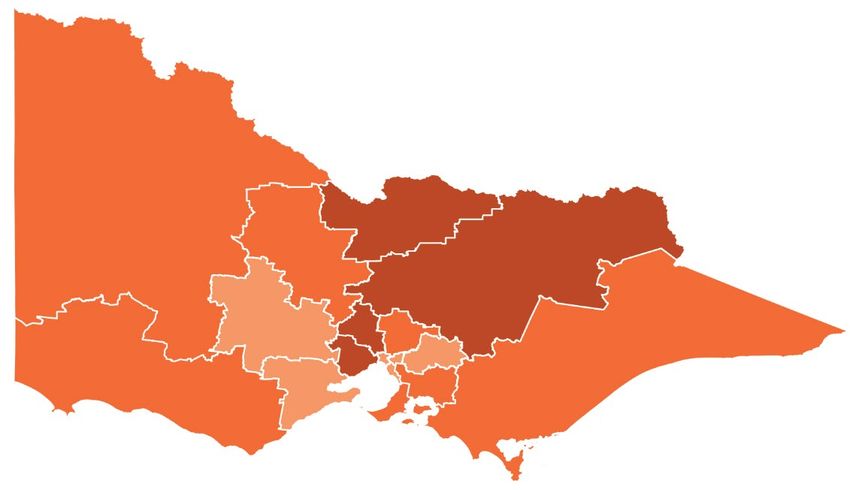
Job Losses Will Differ By Sector And Geography

                                                                                   Employment exposure             Effect on debt serviceability

 First wave:               The first employment casualties of                                                 Leisure, tourism, hospitality
                                                                             Accommodation and food
 Tourism, leisure,         COVID-19 due to their sensitivity to                                               workers are more likely to work
                                                                             services comprise around 7% of
 hospitality,              lockdowns and closure of international                                             part time and are less represented
                                                                             total employment.
 airline sector            borders.                                                                           in home ownership.

                           Not severely affected in Q2 due to the                                             A big employer in Australia. A
                           existing pipeline of work. Construction                                            significant hit to employment in this
 Second wave:                                                                Construction comprises around
                           work continued during the first                                                    sector could result in debt
 Construction                                                                9% of total employment.
                           lockdowns. A fall in new dwelling                                                  serviceability pressures in the so-
                           approvals may lead to job losses.                                                  called mortgage belt.

                           Not directly affected because                                                      Workers typically in higher income
 Third wave:               employees are more able to work                   Professional, technical, and     and housing debt quartiles.
 Professional              remotely. Weaker business sentiment               scientific services comprise     Borrowers who are more highly
 services                  could lead to scaling back of non-                around 9% of total employment.   leveraged are more vulnerable to
                           essential consultancy services.                                                    income declines.

Source: Employment Exposure Data, Australian Bureau of Statistics; S&P Global Ratings.

                                                                                                                                                      4
RMBS Performance Watch: Australia - Market Overview - As of June 30, 2020 - S&P Global
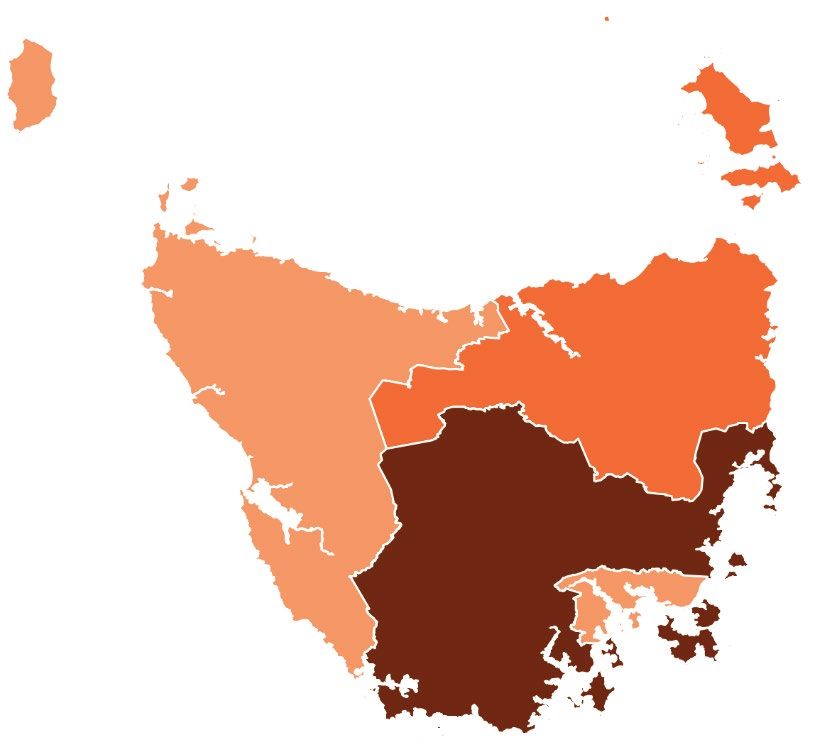
S&P Global Ratings’ Australian RMBS Outlook

– COVID-19 caused a significant economic contraction in the first part of Q2. A recovery
  began during the latter part of Q2 when the economy started to reopen and confidence
  returned.
– Household income has been supported by enormous fiscal stimulus, including
  JobKeeper payments and access to superannuation withdrawals. Lower interest rates
  and mortgage payment deferral schemes have eased debt serviceability pressure.
– Repayment buffers due to a prolonged period of low interest rates will help many
  borrowers.
– Setbacks will foster uncertainty for firms and households, leading to cautious behavior.
  This will influence investment and hiring decisions.
– Debt-serviceably pressure will likely emerge in Q4 2020, followed by losses beginning in
  Q2 2021.
– Lower-rated tranches of nonconforming transactions are more susceptible to ratings
  downgrades.

                                                                                             5
RMBS Performance Watch: Australia - Market Overview - As of June 30, 2020 - S&P Global
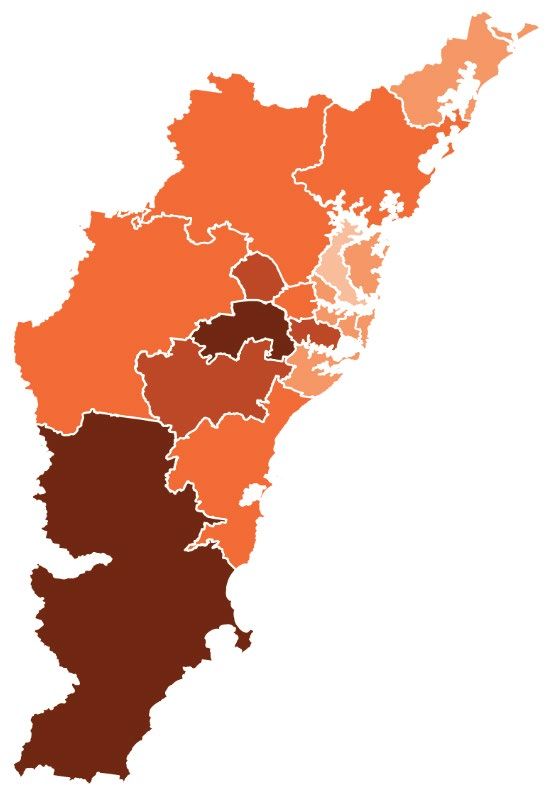
Australian RMBS
COVID-19 Profiles
What do COVID-19 support profiles reveal in the
Australian RMBS sector?
RMBS Performance Watch: Australia - Market Overview - As of June 30, 2020 - S&P Global
COVID-19 Profiles: LTV Ratio Distribution

Prime LTV Distribution                                                                                  –   COVID-19 does not materially discriminate
                                                                                                            by loan-to-value (LTV) ratio LTV profile.
                                Total RMBS      COVID-19 Hardship
                                                         hardship
                                                                                                        –   Loans with >80% LTV loan exposures make
 50%                                                                                                        up a greater proportion of loans under COVID
 40%                                                                                                        arrangements compared to the broader
 30%                                                                                                        RMBS universe.
 20%                                                                                                    –   This trend is more pronounced in the
 10%                                                                                                        nonconforming sector.
  0%                                                                                                    –   Half of the loans under COVID-19
            and       70%> and      80%> and       90%> and        >100%                   arrangements in the nonconforming sector
                         100%
RMBS Performance Watch: Australia - Market Overview - As of June 30, 2020 - S&P Global
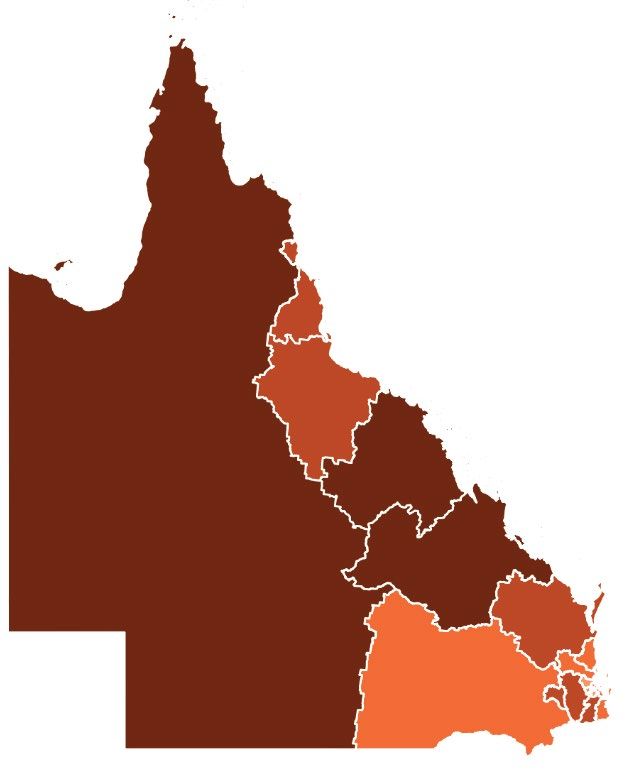
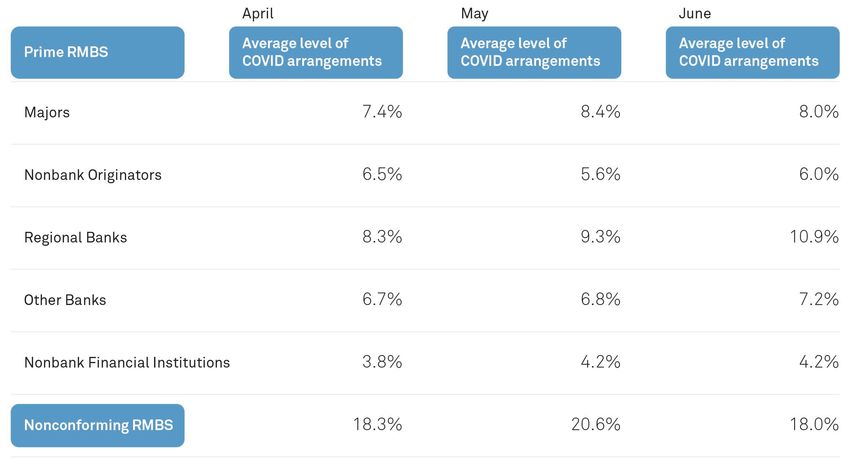
COVID-19 Profiles: COVID Support Levels Across
RMBS Originator Types

                            Average level of         Average level of        Average level of        –   Borrowers who work in the airline, tourism,
                            COVID-19 arrangements    COVID-19 arrangements   COVID-19 arrangements
                                                                                                         and hospitality sectors are more likely to be
                                                                                                         under COVID-19 support arrangements.
                                                                                                     –   COVID-19 support levels are higher in the
                                                                                                         nonconforming sector.
                                                                                                     –   Nonconforming sector has a higher exposure
                                                                                                         to self-employed borrowers which comprise
                                                                                                         around 50% of total loan exposures in trusts.
                                                                                                     –   COVID-19 support levels peaked in May-
                                                                                                         June, according to anecdotal feedback from
                                                                                                         originators.
                                                                                                     –   COVD-19 hardship levels started to taper
                                                                                                         from July, except in Victoria, where
                                                                                                         borrowers are less likely to exit COVID-19
                                                                                                         hardship given the Stage 4 restrictions in
                                                                                                         place.
Data are as of June. 30, 2020. % refers to average % at a trust level.
RMBS--Residential mortgage-backed securities. Source: S&P Global Ratings.

                                                                                                                                                         8
RMBS Performance Watch: Australia - Market Overview - As of June 30, 2020 - S&P Global
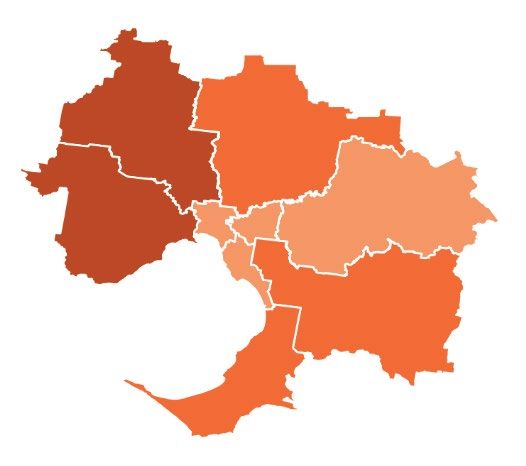
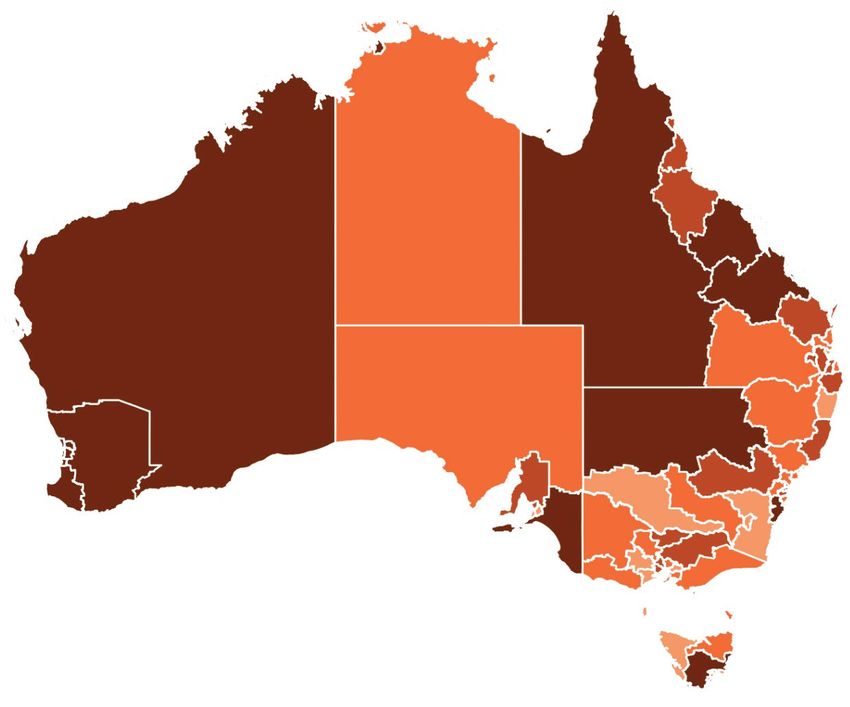
COVID-19 Exposure By State
                                                                                                                            COVID Hardship
                                                                                                                            COVID-19 hardship   Total RMBS Sector
                                                                                                                                                           sector

                                                                                                                             Cairns

                                              1% 1%
                                                                                                                        Gold Coast
                                              Northern
                                              Territory
                                                                        24% 23%

                                                                        Queensland                                  Sunshine Coast
          10% 10%        Western
                         Australia
                                                                                                                                      0%        10%           20%
                                            4% 6%           South
                                                            Australia

                                                                             33% 32%
                                                                                                         1% 2%
                                                                             New South
                                                                               Wales                     Australian
                                                                                                           Capital
                                        25% 25% Victoria                                                  Territory

                                                                 1% 2%                       Tasmania

Data as at June. 30, 2020. %s shown for Cairns, Gold Coast and Sunshine Coast are expressed as a % of total loans in Queensland.
RMBS--Residential mortgage-backed securities. Source: S&P Global Ratings.

                                                                                                                                                                    9
RMBS Performance Watch: Australia - Market Overview - As of June 30, 2020 - S&P Global
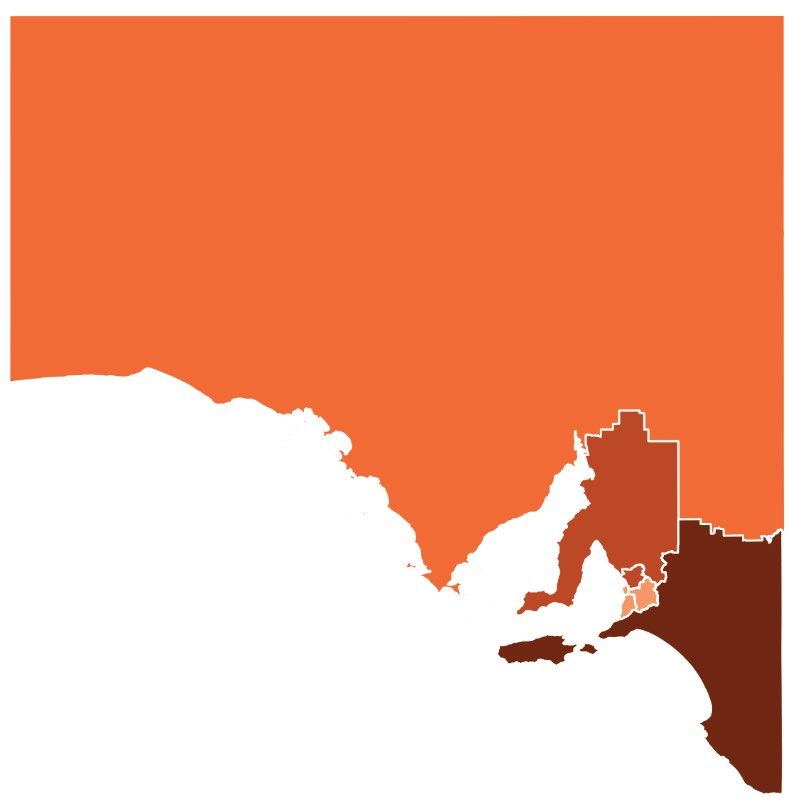
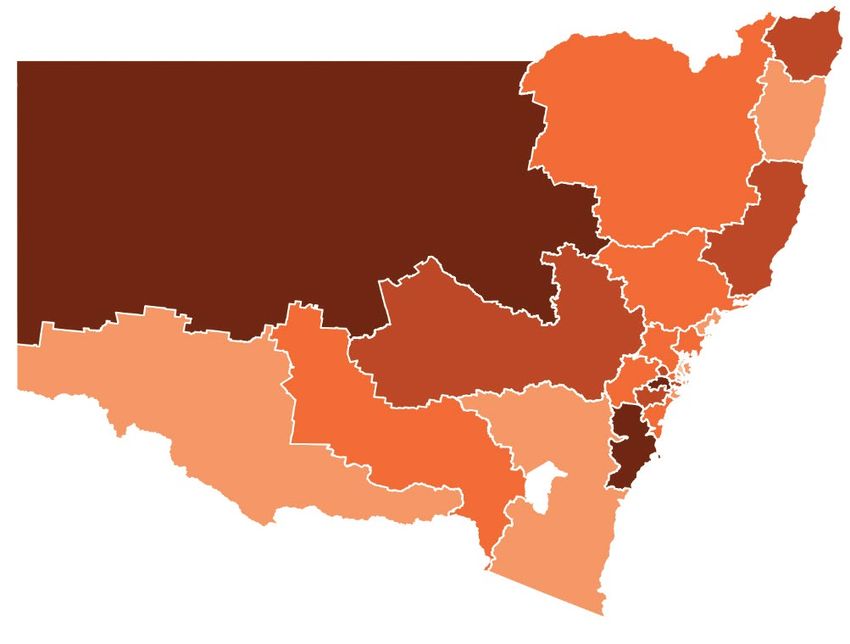
COVID-19 Hardship Hot Spots

                                            Exposure              Exposure           Proportional
 Area                      State          total RMBS         COVID-19 loans             increase

 Sydney - Inner
                           NSW                  3.31%                  4.37%                  32%      –   Popular tourism locations and the outer
 South West
                                                                                                           suburbs of major capital cities have
 Gold Coast                QLD                  3.13%                  4.21%                  35%          disproportionally higher levels of COVID-19
 Melbourne - South                                                                                         support arrangements.
                           VIC                  2.50%                  3.21%                  28%
 East                                                                                                  –   COVID-19 support levels are likely to remain
                                                                                                           elevated in areas where it takes longer to
 Melbourne - North
                           VIC                  2.50%                  3.25%                  30%          return to business as usual.
 East
                                                                                                       –   Tourism-dependent areas affected by the
 Sunshine Coast            QLD                  1.55%                  1.88%                  21%          closure of international and state borders
 Melbourne - North                                                                                         are likely to have larger employment losses .
                           VIC                  1.30%                  1.65%                  27%
 West                                                                                                  –   Victoria’s Stage 4 lockdown could result in an
 Mornington                                                                                                increase in COVID-19 support levels in
                           VIC                  1.27%                  1.93%                  52%          August.
 Peninsula
 Sydney - Outer                                                                                        –   Borrowers already under COVID-19 hardship
                           NSW                  1.03%                  1.25%                  21%          arrangements in Victoria are more likely to
 South West
                                                                                                           seek extensions to original mortgage deferral
 Richmond - Tweed          NSW                  0.97%                  1.33%                  37%          arrangement terms than in other parts of the
                                                                                                           country.
 Sydney - South
                           NSW                  0.89%                  1.31%                  47%
 West
 Darwin                    NT                   0.67%                  0.93%                  38%

Data as at June. 30, 2020. RMBS--Residential mortgage-backed securities. Source: S&P Global Ratings.

                                                                                                                                                           10
COVID-19 Profile: Investors

Proportion Of Investor Vs. Owner-Occupier Loans

                                   COVID-19 subset      Total RMBS
                                                                                   –   Investor loans are not disproportionately
 80%                                                                                   represented in COVID-19 support RMBS loan
                                                                                       profiles.
 70%                                                                               –   LTV ratio profiles of investor loans are
                                                                                       generally more elevated than owner-
 60%                                                                                   occupier loans, given the greater prevalence
                                                                                       of interest-only periods that mean the loans
 50%                                                                                   take longer to pay down.
                                                                                   –   Rental income pressure is likely to be more
 40%                                                                                   prevalent for investors, especially in inner-
                                                                                       city areas, and the movement of AirBNB
 30%                                                                                   rentals into the longer-term residential
                                                                                       market.
 20%                                                                               –   Exposure to CBD areas across the Australian
                                                                                       RMBS sector is limited at less than 2% of
 10%                                                                                   total loan exposures.

  0%
                        Investment                                         Owner

Data as at June. 30, 2020. RMBS--Residential mortgage-backed securities.
Source: S&P Global Ratings.

                                                                                                                                       11
Australian RMBS
Performance
When are arrears likely to surface, given the
insulation effect of mortgage payment deferrals?
COVID-19’s Effect On Prime Arrears
Unlikely To Be Visible Until At Least Q4
                                    31-60 days           61-90 days   90+ days       Standard variable rates (RHS)

  1.8%                                                                                                               12%

  1.6%                                                                           Prime arrears peaked at 1.69%
                                                                                 after the 2008 financial crisis.
                                                                                                                     10%
  1.4%

  1.2%                                                                                                               8%

  1.0%
                                                                                                                     6%
  0.8%

  0.6%                                                                                                               4%

  0.4%
                                                                                                                     2%
  0.2%

  0.0%                                                                                                               0%

Source: Reserve Bank of Australia. S&P Global Ratings.

                                                                                                                      13
Nonconforming Arrears Likely To Rise Earlier And
At A Faster Rate
                              31-60 days   61-90 days           90+ days   Total current loan balance (RHS)

 20%                                                                                                          12

                                            Nonconforming arrears
                                                                                                              10
                                            peaked at 17.09% after the
                                            2008 financial crisis.
 15%

                                                                                                              8

                                                                                                                   Bil. A$.
 10%                                                                                                          6

                                                                                                              4

  5%

                                                                                                              2

  0%                                                                                                          0

Source: S&P Global Ratings.

                                                                                                                              14
Mortgage Payment Deferral Levels
Aren’t An Indicator Of Future Arrears Performance
– Mortgage arrears are closely correlated with rises in unemployment because loss of
  income is a key cause of mortgage default.
– COVID-19 arrangement levels provide some insight into debt-serviceability pressures but
  are not an indicator of imminent mortgage default.
– Borrowers’ underlying credit quality is a driver of mortgage deferral utilization.
  Operational considerations such as initial approaches to granting COVID-19 hardship
  also play a part.
– Small bank (eg. Credit unions) and some nonbank lenders in the prime RMBS sector
  generally have adopted a case-by-case approach to granting COVID-19 hardship, while
  several larger bank lenders used a more automated deferral approach for the initial
  assessment.
– The stage of economic recovery when support measures expire will affect the degree of
  rises in mortgage arrears.
– COVID-19 levels for most publicly rated RMBS trust are available in the June pool
  statistics.

                                                                                          15
Prime Prepayment Rates Surprise On The Upside

                        Prime prepayment rate (Inc. Non-Capital Market Issuance)
                                                                                   –   Prime prepayment rates including noncapital
                        Nonconforming prepayment rate
                                                                                       market issuance jumped to 30.2% in Q2 from
                        10-year long-term average prime prepayment rate                17.4% in Q1, mainly due to loan maintenance
                        Prime prepayment rate (Exc. Non-Capital Market Issuance)       activity in bank internal self-securitization
                                                                                       programs.
 40%                                                                               –   Prime prepayment rates excluding
                                                                                       noncapital market issuance rose to 20.8% in
 35%
                                                                                       Q2 from 17.5% in Q1.
 30%                                                                               –   Increases in prepayment rates (outside of
                                                                                       loan maintenance activity) reflect strong
 25%                                                                                   refinancing activity in the first half of 2020.

 20%                                                                               –   Nonconforming prepayment rates rose to
                                                                                       23.80% in Q2 from 22.03% in Q1.
 15%
                                                                                   –   We do not expect prepayment rates to
                                                                                       continue to increase at this rate. Most
 10%
                                                                                       borrowers that were wanting and able to
                                                                                       refinance their loans have likely already done
  5%
                                                                                       so.
  0%

Data as at June. 30, 2020. Source: S&P Global Ratings.

                                                                                                                                         16
COVID-19’s Effect On Losses
Will Start To Emerge In Q2 2021
  Property prices are likely to fall about 10% from the onset of the pandemic. Strong growth in property prices could return,
  underpinned by increased demand when international borders reopen, low interest rates and potential supply shortages.
                   The modest LTV ratio profile of the Australian RMBS sector will help to minimize losses.

Cumulative Gross Loss By Vintage Of                                         Cumulative Gross Loss By Vintage Of
Origination - Prime RMBS                                                    Origination - Nonconforming RMBS
 0.09%                                                                       0.9%

 0.08%                                                                       0.8%

 0.07%                                                                       0.7%

 0.06%                                                                       0.6%

 0.05%                                                                       0.5%

 0.04%                                                                       0.4%

 0.03%                                                                       0.3%

 0.02%                                                                       0.2%

 0.01%                                                                       0.1%

 0.00%                                                                       0.0%
         2011 2012 2013 2014 2015 2016 2017 2018 2019 2020                           2011 2012 2013 2014 2015 2016 2017 2018 2019 2020

RMBS--Residential mortgage-backed securities. Source: S&P Global Ratings.   RMBS--Residential mortgage-backed securities. Source: S&P Global Ratings.

                                                                                                                                                        17
These timelines are based on current time periods related to existing wage subsidy programs. Further extensions to these programs could alter the timeframes when
arrears and foreclosure periods are expected to occur.

                                                                                                                                                                    18
These timelines are based on current time periods related to existing wage subsidy programs. Further extensions to these programs could alter the timeframes when
arrears and foreclosure periods are expected to occur.

                                                                                                                                                                    19
Arrears Performance
Nationwide
Arrears will vary by state in line with their different
paths to economic recovery
Reporting Nuances Mask COVID-19’s
True Effect On Arrears

Australia                                                                                          Arrears are likely to increase nationwide in the months
                                                                                                    ahead as rising unemployment flows through to debt
                                                                                                        serviceability pressures for some borrowers.
                                                                                                          Enormous fiscal stimulus measures are
                                                                                                    helping many borrowers whose income has been hit
                                                                                                     by COVID-19. This will support household income
                                                                                                               and aid debt serviceability.
                                                                                                    Mortgage payment deferrals are masking COVID-19’s
                                                                                                   true effect on arrears. This is because most lenders are
                                                                                                         not including loans under COVID-19 hardship
                                                                                                      arrangements in their traditional arrears reporting
                                                                                                                during mortgage-relief periods.
                                                                                                   Mortgage arrears are likely to exhibit greater variability
                                                                                                    during mortgage-relief periods. This is partly due to
                                                                                                  operational nuances in the approaches lenders adopt in
                                                                                                  their reporting of loans that were in arrears before being
                                                                                                         granted COVID-19 hardship arrangements.

   0%-0.74%    0.75%-1.24%   1.25%-1.74%   1.75%-2.24%   +2.25%

Map boundaries are based on the ABS SA4 geographical classifications. Some areas on the map have been merged graphically. Source: S&P Global Ratings.

                                                                                                                                                             21
New South Wales: Containing COVID-19’s Spread
And Keeping The Economy Open                                                                                                    111

                                                                            212

                                                                                                                          115      102
                                                           110          104
                                                                                                                                                         121
                  105                                                                               116                                        122
                                                                                                                                                         125
                                                                                                 127
                                                                      108                                                                 119
                                                            106                                            124
                                                                                                                         123                             128
                                       103
                                                                                                                          107
              109

                                  113

                                                                                                                114
                                                 101

 NSW has managed to keep its economy largely open and
 stay on top of localized virus clusters. Managing this will
 be crucial in keeping the economy open, preserving jobs,
   and restoring the state’s strong arrears track record.
                                                                                  Current 30+              Peak 30+             Unemployment           Exposure
                                                                                  Days Arrears            Days Arrears              Rate             Across RMBS

                                                                                  1.33%               2.69%                     7.2%                 32%
   0%-0.74%    0.75%-1.24%   1.25%-1.74%     1.75%-2.24%     +2.25%

Source: Australian Bureau of Statistics. S&P Global Ratings.

                                                                                                                                                                   22
Victoria: Lockdown 2.0 Puts The Brakes On
Economic Recovery

          Victoria’s Stage 4 lockdown will impede its
             path to economic recovery, affecting
           employment, housing markets, and debt
        serviceability. A more protracted lockdown is
       likely to lead to higher job losses and a greater                                215
       effect on property prices than in other parts of
        the country. We expect more borrowers from                                                          216
           Victoria to request extensions to existing                                           202
                                                                                                                   204
       mortgage deferral arrangements than in other
           states, given the dislocation in economic
           activity is likely to persist for some time.                                       201
        Victoria is likely to see the largest increase in                                                                  205
                                                                                       214
        mortgage arrears above pre-COVID-19 levels.

    Current 30+                   Peak 30+            Unemployment         Exposure             203
    Days Arrears                 Days Arrears             Rate           Across RMBS

   1.37%                         1.86%                 6.8%              25%
                                                                                                       210
                                                                                                                  209

                                                                                                                         211
                                                                                                      213
   0%-0.74%        0.75%-1.24%     1.25%-1.74%   1.75%-2.24%    +2.25%

                                                                                                                         212
Source: Australian Bureau of Statistics. S&P Global Ratings.                                          214
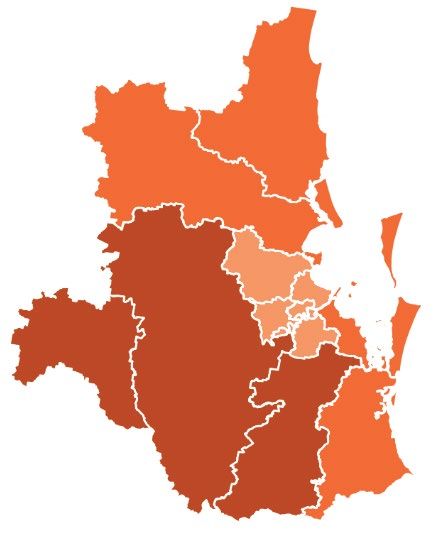
                                                                                                                                 23
Queensland: Tourism Hotspots Have A Higher
Share Of COVID-19 Hardship Levels

                                                                                                                  Arrears were already more elevated
                                                                                                                   in Queensland than other parts of
                                                                                     316
                                                                                                                  the country, reflecting its exposure
                                                                            313                                     to mining and drought-affected
                                                                                                                       regions. With the COVID-19
                                                                                                                    pandemic, tourism hot spots are
                                           306                                                                       struggling from the closure of
                                                                                                                      international and some state
                                                                      317     310                                    borders. Tourist towns have a
                             318                                                                                    disproportionate share of loans
                                                                                                                        under COVID-19 hardship
                                      312                                                                           arrangements and will likely see
                                                                                             309                  higher arrears in the months ahead.
              315                                                                     311

                                            308
                                                       319

                                            307

                                                                              Current 30+           Peak 30+         Unemployment         Exposure
                                                                              Days Arrears         Days Arrears          Rate           Across RMBS

                                                                             1.58%                 2.17%             8.8%                23%
   0%-0.74%    0.75%-1.24%   1.25%-1.74%     1.75%-2.24%     +2.25%

Source: Australian Bureau of Statistics. S&P Global Ratings.

                                                                                                                                                      24
Western Australia: Longer-Dated Arrears Weighing
On Arrears Performance

                                                                                                         Western Australia has been home to the
                                                                                                         nation’s highest arrears for a number of
                                                                                                          years, reflecting borrowers’ increased
                        505                                                                              debt-serviceability pressures since the
                                                                                                           end of the mining boom. COVID-19’s
                                                                                                            economic effect is unlikely to be as
                                       504
                                                                                508                       negative as other parts of the country,
                                                                                                          given its good progress on containing
        503                                                                                                the virus and the strong demand for
                                                                                                              iron ore. Longer-dated arrears
                                                                                                           meanwhile will still weigh on overall
        507                          506                                                                  arrears performance. These loans are
                                                                                                                      unlikely to cure.

                                                                          509

                              502

                                                                    507
                                                                                Current Peak 30+    Peak 30+          Unemployment         Exposure
                                                                                  Days Arrears     Days Arrears           Rate           Across RMBS

                                                                                2.67%              3.10%              8.3%                10%
   0%-0.74%    0.75%-1.24%    1.25%-1.74%    1.75%-2.24%   +2.25%

Source: Australian Bureau of Statistics. S&P Global Ratings.

                                                                                                                                                       25
South Australia: Unemployment Eased In July
As Economic Recovery Continues
                                                                              South Australia’s unemployment rate fell to 7.9% in July from
                                                                               a month earlier but remained above the national average of
                                                                              7.5%. The state has made progress in containing COVID-19’s
                                                                               spread and reopening its economy. This will help with debt
                                                                                  serviceability when fiscal stimulus measures expire.
                                    406

                                                                           Current 30+           Peak 30+            Unemployment     Exposure
                                                                           Days Arrears         Days Arrears             Rate       Across RMBS

                                                                           1.36%                1.81%                7.9%             6%

                                                               405

                                                                     407
                                                                                                               402

                                                                                          404
                                                                                                                     401

                                                                                                         403
   0%-0.74%    0.75%-1.24%   1.25%-1.74%   1.75%-2.24%   +2.25%

Source: Australian Bureau of Statistics. S&P Global Ratings.

                                                                                                                                                  26
Tasmania: Unemployment Rate Lower Than
Most Other Parts Of the Country

                                                                                   Tasmania in July recorded one of the largest declines in
                                                                                       unemployment rate from the previous month. Its
                                                                                    current unemployment rate of 6% was well below the
                             604                                  602                national average of 7.5%. Tasmania has also made
                                                                                   good progress in containing the spread of the virus and
                                                                                      reopening its economy. This is likely to lead to less
                                                                                    pronounced increases in arrears in the months ahead
                                                                                    as the return to business as usual is more progressed.

                                                   603

                                                                        601

                                                                          Current 30+           Peak 30+         Unemployment          Exposure
                                                                          Days Arrears         Days Arrears          Rate            Across RMBS

                                                                         1.10%                2.02%               6.0%               2.0%
   0%-0.74%    0.75%-1.24%   1.25%-1.74%   1.75%-2.24%   +2.25%

Source: Australian Bureau of Statistics. S&P Global Ratings.

                                                                                                                                                   27
The Territories: Northern Territory’s Unemployment
Rate Will Put More Pressure On Arrears
    701

                                                                            Northern Territory has the most volatile arrears
                                                                       performance due to small exposures in portfolios. Darwin
                                                                          has a disproportionate share of COVID-19 hardship
                                                                        arrangements, reflecting the border closure’s effect on
                                                                        the tourism sector. Unemployment in the territory was
                                                                                  7.5% in July, up from 5.7% in June.

                               702
                                                                  Current 30+          Peak 30+         Unemployment          Exposure
                                                                  Days Arrears        Days Arrears          Rate            Across RMBS

                                                                  2.73%              3.50%               7.5%               1.0%

                                                                          Australian Capital Territory has the lowest arrears, at
                                                                          0.99%, as of June 30, 2020. This reflects its stronger
                                                                             employment profile and lower unemployment.

   0%-0.74%    0.75%-1.24%   1.25%-1.74%   1.75%-2.24%   +2.25%

Source: Australian Bureau of Statistics. S&P Global Ratings.

                                                                                                                                          28
SA4 Listing Arrears And Exposure
                                                               30+ days     30+ days                                                                              30+ days     30+ days
Geographic                                                      arrears      arrears    Exposure   Geographic                                                      arrears      arrears    Exposure
area map                                                           level        level     across   area map                                                           level        level     across
code         Regional name                            State   June 2020    June 2019       RMBS    code         Regional name                            State   June 2020    June 2019       RMBS

101          Capital Region                           NSW        1.09%        1.56%       1.23%    124          Sydney - Outer West and Blue Mountains   NSW        1.45%        1.16%       0.94%

102          Central Coast                            NSW        1.31%        1.42%       1.51%    125          Sydney - Parramatta                      NSW        1.33%        1.35%       2.15%

103          Central West                             NSW        1.79%        1.71%       0.48%    126          Sydney - Ryde                            NSW        0.89%        0.50%       0.49%

104          Coffs Harbour - Grafton                  NSW        1.15%        1.18%       0.36%    127          Sydney - South West                      NSW        2.33%        2.23%       0.88%

105          Far West and Orana                       NSW        2.26%        2.90%       0.18%    128          Sydney - Sutherland                      NSW        1.24%        1.55%       0.79%

106          Hunter Valley exc Newcastle              NSW        1.47%        1.42%       1.41%    201          Ballarat                                 VIC        1.16%        1.39%       0.66%

107          Illawarra                                NSW        1.41%        1.33%       1.71%    202          Bendigo                                  VIC        1.49%        1.72%       0.34%

108          Mid North Coast                          NSW        1.81%        1.79%       0.44%    203          Geelong                                  VIC        0.82%        1.14%       1.11%

109          Murray                                   NSW        1.04%        1.58%       0.70%    204          Hume                                     VIC        2.09%        2.22%       0.31%

110          New England and North West               NSW        1.46%        2.36%       0.23%    205          Latrobe - Gippsland                      VIC        1.64%        1.75%       0.60%

111          Newcastle and Lake Macquarie             NSW        0.84%        0.98%       1.66%    206          Melbourne - Inner                        VIC        1.10%        0.94%       4.23%

112          Richmond - Tweed                         NSW        2.06%        1.90%       1.02%    207          Melbourne - Inner East                   VIC        1.22%        1.10%       1.73%

113          Riverina                                 NSW        1.40%        1.48%       0.11%    208          Melbourne - Inner South                  VIC        0.95%        1.04%       2.16%

114          Southern Highlands and Shoalhaven        NSW        2.52%        1.03%       0.26%    209          Melbourne - North East                   VIC        1.56%        1.78%       2.50%

115          Sydney - Baulkham Hills and Hawkesbury   NSW        1.30%        1.29%       1.91%    210          Melbourne - North West                   VIC        2.09%        1.82%       1.29%

116          Sydney - Blacktown                       NSW        1.78%        1.54%       2.45%    211          Melbourne - Outer East                   VIC        1.04%        1.09%       2.43%

117          Sydney - City and Inner South            NSW        0.82%        0.81%       2.92%    212          Melbourne - South East                   VIC        1.61%        1.77%       2.49%

118          Sydney - Eastern Suburbs                 NSW        0.85%        0.78%       0.87%    213          Melbourne - West                         VIC        1.80%        1.61%       2.63%

119          Sydney - Inner South West                NSW        1.85%        1.76%       3.30%    214          Mornington Peninsula                     VIC        1.54%        1.76%       1.26%

120          Sydney - Inner West                      NSW        0.85%        0.63%       1.28%    215          North West                               VIC        1.29%        1.49%       0.12%

121          Sydney - North Sydney and Hornsby        NSW        0.63%        0.61%       2.29%    216          Shepparton                               VIC        1.95%        2.22%       0.12%

122          Sydney - Northern Beaches                NSW        0.87%        0.65%       1.48%    217          Warrnambool and South West               VIC        1.50%        1.63%       0.22%

123          Sydney - Outer South West                NSW        2.03%        1.31%       1.02%    301          Brisbane - East                          QLD        1.31%        1.38%       1.50%

                                                                                                                                                                                               29
SA4 Listing Arrears And Exposure
                                                     30+ days     30+ days                                                                      30+ days     30+ days
Geographic                                            arrears      arrears    Exposure   Geographic                                              arrears      arrears    Exposure
area map                                                 level        level     across   area map                                                   level        level     across
code         Regional name                  State   June 2020    June 2019       RMBS    code         Regional name                    State   June 2020    June 2019       RMBS

302          Brisbane - North               QLD        1.03%        1.02%       2.06%    405          Barossa - Yorke - Mid North      SA         2.04%        2.91%       0.16%

303          Brisbane - South               QLD        1.13%        1.34%       2.86%    406          South Australia - Outback        SA         1.38%        2.14%       0.13%

304          Brisbane - West                QLD        1.00%        0.98%       1.32%    407          South Australia - South East     SA         2.25%        1.80%       0.31%

305          Brisbane Inner City            QLD        1.10%        1.06%       0.96%    501          Bunbury                          WA         2.66%        3.26%       0.46%

306          Cairns                         QLD        2.24%        2.09%       0.89%    502          Mandurah                         WA         3.65%        4.20%       0.32%

307          Darling Downs - Maranoa        QLD        1.58%        2.28%       1.00%    503          Perth - Inner                    WA         1.28%        1.65%       1.04%

308          Fitzroy (Central Queensland)   QLD        3.32%        3.77%       1.00%    504          Perth - North East               WA         2.83%        2.97%       1.36%

309          Gold Coast                     QLD        1.40%        1.53%       3.14%    505          Perth - North West               WA         2.74%        3.24%       2.09%

310          Ipswich                        QLD        2.04%        2.57%       1.24%    506          Perth - South East               WA         2.87%        3.04%       2.16%

311          Logan - Beaudesert             QLD        1.92%        2.78%       0.54%    507          Perth - South West               WA         2.37%        2.74%       1.57%

312          Mackay                         QLD        2.60%        3.63%       0.80%    508          Western Australia - Outback      WA         3.93%        5.18%       0.42%

313          Moreton Bay - North            QLD        1.38%        2.14%       1.28%    509          Western Australia - Wheat Belt   WA         4.08%        4.19%       0.18%

314          Moreton Bay - South            QLD        0.96%        1.14%       0.64%    601          Hobart                           TAS        1.03%        1.16%       0.85%

315          Queensland - Outback           QLD        3.39%        4.99%       0.17%    602          Launceston and North East        TAS        1.26%        1.42%       0.35%

316          Sunshine Coast                 QLD        1.47%        1.65%       1.57%    603          South East                       TAS        2.66%        2.76%       0.03%

317          Toowoomba                      QLD        2.19%        3.29%       0.01%    604          West and North West              TAS        0.94%        1.28%       0.23%

318          Townsville                     QLD        2.22%        3.18%       1.11%    701          Darwin                           NT         2.91%        3.05%       0.67%

319          Wide Bay                       QLD        2.11%        2.45%       0.62%    702          Northern Territory - Outback     NT         1.64%        1.73%       0.09%

401          Adelaide - Central and Hills   SA         1.09%        1.17%       1.43%    703          Northern Territory - Outback     NT         0.00%        0.00%       0.00%

402          Adelaide - North               SA         1.81%        1.99%       1.25%    704          Northern Territory - Outback     NT         0.00%        0.00%       0.00%

403          Adelaide - South               SA         1.11%        1.38%       1.33%    705          Northern Territory - Outback     NT         0.00%        0.00%       0.00%

404          Adelaide - West                SA         1.07%        1.05%       0.78%

                                                                                                                                                                             30
The 10 Worst-Performing Postcodes

State                             Suburb                            Postcode                           Loans in arrears                   Loan count

WA                                Byford                            6122                               6.28%                              430

VIC                               Greenvale                         3059                               5.94%                              390

WA                                Maddington                        6109                               5.92%                              273

NT                                Darwin                            800                                5.36%                              266

WA                                Blythewood                        6208                               5.34%                              258

NSW                               Chester Hill                      2162                               4.91%                              327

WA                                Cooloongup                        6168                               4.83%                              583

WA                                Butler                            6036                               4.82%                              371

WA                                Cloverdale                        6105                               4.69%                              427

VIC                               South Melbourne                   3205                               4.68%                              330

Source: S&P Global Ratings. Data as of June 30, 2020. For a full list of suburbs/localities attached to these postcodes, please refer to the Australia Post website.

                                                                                                                                                                       31
New Zealand
S&P Global Ratings Economic Outlook

                           2020f        2021f         Outlook                                   Impact on credit quality

Real GDP                   (5.0)        6.0           The country has outperformed nearly       Negative. Reduced economic growth
growth (% year                                        all others in containing COVID-19. The    will likely add debt-serviceability
over year)                                            lockdowns hurt economic activity in       pressure for self-employed borrowers,
                                                      the June quarter, but the economy         whose cash flows are more sensitive
                                                      should recover in the next few years.     to deteriorating economic conditions.

Unemployment               5.8          5.6           We forecast unemployment to peak in       Negative. Rising unemployment will
rate (year                                            June, and economic activity and           put pressure on certain cohorts,
average; %)                                           employment to rebound in 2021. Job-       including self-employed and highly
                                                      retention measures have helped to         leveraged borrowers.
                                                      reduce the level of job losses.

CPI (%)                    1.7          1.8           Wage growth is likely to remain           Negative. Weak wage growth is likely
                                                      subdued in the wake of COVID-19.          to persist for some time.

Policy rates, end          0.25         0.25          Official cash rate is set to remain low   Positive. Lower rates will support debt
of year (%)                                           for some time.                            serviceability for borrowers with
                                                                                                variable-rate mortgages.

f--Forecast.CPI --Consumer price index. Source: S&P Global Ratings.

                                                                                                                                          33
New Zealand’s Response To COVID-19 Has Helped
The Economy To Reopen Faster Than Others
– The COVID-19 pandemic and restrictions to contain it led to a sharp contraction in
  economic activity in the June quarter of 2020. The emergence from lockdown resulted in
  a rebound in economic activity in May and June.
– Many workers affected by the COVID-19 outbreak and containment measures have
  mortgage deferral schemes and access to wage subsidies and superannuation balances
  to compensate for lost income.
– Mortgage deferral schemes have been extended to March 2021. The regulatory guidance
  means banks can continue to offer temporary mortgage deferrals to their customers
  during mortgage relief periods without those loans being viewed as being in default,
– Lower interest rates are supporting house price recovery more so than business
  investment at this stage.
– Auckland was placed under Stage 3 restrictions on August 11 after the detection of the
  country’s first locally acquired case of COVID-19 in three months. Auckland is scheduled
  to return to Stage 2 restrictions, as per the rest of the country, from August 31st.

                                                                                             34
New Zealand RMBS Sector Performance
Remains Stable
– The credit quality of the New Zealand RMBS sector is strong, as evidenced by:
     – Weighted-average LTV ratio of 60%.
     – Average loan size of NZ$191,985.
     – Weighted-average seasoning of 55 months.
     – Low levels of arrears in most portfolios, though we expect arrears to rise
       because of a forecast increase in unemployment.
– All losses to date have been fully covered by lenders’ mortgage insurance.
– A number of pools are now “small pools,” which have greater borrower
  concentration risk.

RMBS--Residential mortgage-backed securities. LTV--Loan to value ratio.

                                                                                    35
How To Access RMBS Performance Watch

RMBS Performance Watch including arrears, prepayment, and pool statistics data
can be accessed using the link below:

                                                        CLICK HERE
                                                          Asia-Pacific
                                                       Structured Finance
                                                          Surveillance

                                                                                 36
RMBS Analytical Contacts

Kate Thomson
Analytical Manager | kate.thomson@spglobal.com

Narelle Coneybeare
Sector Lead | narelle.coneybeare@spglobal.com

Erin Kitson
Sector Specialist Research | erin.kitson@spglobal.com

Elizabeth Steenson
Lead Analyst | elizabeth.steenson@spglobal.com

Alisha Treacy
Lead Analyst | alisha.treacy@spglobal.com

                                                        37
Under S&P Global Ratings’ policies, only a Rating Committee can determine a Credit Rating Action (including a Credit Rating change, affirmation or withdrawal, Rating Outlook change, or CreditWatch action).
This commentary and its subject matter have not been the subject of a Rating Committee action and should not be interpreted as a change to, or affirmation of, a Credit Rating or Rating Outlook.

No content (including ratings, credit-related analyses and data, valuations, model, software or other application or output therefrom) or any part thereof (Content) may be modified, reverse engineered,
reproduced or distributed in any form by any means, or stored in a database or retrieval system, without the prior written permission of Standard & Poor’s Financial Services LLC or its affiliates (collectively,
S&P). The Content shall not be used for any unlawful or unauthorized purposes. S&P and any third-party providers, as well as their directors, officers, shareholders, employees or agents (collectively S&P
Parties) do not guarantee the accuracy, completeness, timeliness or availability of the Content. S&P Parties are not responsible for any errors or omissions (negligent or otherwise), regardless of the cause, for
the results obtained from the use of the Content, or for the security or maintenance of any data input by the user. The Content is provided on an “as is” basis. S&P PARTIES DISCLAIM ANY AND ALL EXPRESS OR
IMPLIED WARRANTIES, INCLUDING, BUT NOT LIMITED TO, ANY WARRANTIES OF MERCHANTABILITY OR FITNESS FOR A PARTICULAR PURPOSE OR USE, FREEDOM FROM BUGS, SOFTWARE ERRORS OR
DEFECTS, THAT THE CONTENT’S FUNCTIONING WILL BE UNINTERRUPTED OR THAT THE CONTENT WILL OPERATE WITH ANY SOFTWARE OR HARDWARE CONFIGURATION. In no event shall S&P Parties be liable
to

any party for any direct, indirect, incidental, exemplary, compensatory, punitive, special or consequential damages, costs, expenses, legal fees, or losses (including, without limitation, lost income or lost profits
and opportunity costs or losses caused by negligence) in connection with any use of the Content even if advised of the possibility of such damages.

Credit-related and other analyses, including ratings, and statements in the Content are statements of opinion as of the date they are expressed and not statements of fact. S&P’s opinions, analyses and rating
acknowledgment decisions (described below) are not recommendations to purchase, hold, or sell any securities or to make any investment decisions, and do not address the suitability of any security. S&P
assumes no obligation to update the Content following publication in any form or format. The Content should not be relied on and is not a substitute for the skill, judgment and experience of the user, its
management, employees, advisors and/or clients when making investment and other business decisions. S&P does not act as a fiduciary or an investment advisor except where registered as such. While S&P
has obtained information from sources it believes to be reliable, S&P does not perform an audit and undertakes no duty of due diligence or independent verification of any information it receives.

To the extent that regulatory authorities allow a rating agency to acknowledge in one jurisdiction a rating issued in another jurisdiction for certain regulatory purposes, S&P reserves the right to assign, withdraw
or suspend such acknowledgement at any time and in its sole discretion. S&P Parties disclaim any duty whatsoever arising out of the assignment, withdrawal or suspension of an acknowledgment as well as any
liability for any damage alleged to have been suffered on account thereof.

S&P keeps certain activities of its business units separate from each other in order to preserve the independence and objectivity of their respective activities. As a result, certain business units of S&P may have
information that is not available to other S&P business units. S&P has established policies and procedures to maintain the confidentiality of certain non-public information received in connection with each
analytical process.

S&P may receive compensation for its ratings and certain analyses, normally from issuers or underwriters of securities or from obligors. S&P reserves the right to disseminate its opinions and analyses. S&P's
public ratings and analyses are made available on its Web sites, www.standardandpoors.com (free of charge), and www.ratingsdirect.com and may be distributed through other means, including via S&P
publications and third-party redistributors. Additional information about our ratings fees is available at www.standardandpoors.com/usratingsfees.

Permissions: To reprint, translate, or quote S&P Global Ratings’ publications, contact: Client Services, 120 Collins Street, Melbourne, Vic 3000 Australia, (61) 1300-792-553.

This report and the ratings contained within it are based on published information as of July 31, 2017. Subsequent information may result in the assignment of ratings that differ from the ratings published here.
Please call Standard & Poor’s Client Services at (61) 1300-792-553 for the most recent rating assigned.

For Australian Users — S&P Global Ratings Australia Pty Ltd. holds Australian financial services licence number 337565 under the Corporations Act 2001. S&P Global Ratings’ credit ratings and related research
are not intended for and must not be distributed to any person in Australia other than a wholesale client (as defined in Chapter 7 of the Corporations Act).

S&P Global Ratings 17g-7 Disclosure Report SEC Rule 17g-7 requires an NRSRO, for any report accompanying a credit rating relating to an asset-backed security as defined in the Rule, to include a description
of the representations, warranties and enforcement mechanisms available to investors and a description of how they differ from the representations, warranties and enforcement mechanisms in issuances of
similar securities. The Rule applies to in-scope securities initially rated (including preliminary ratings) on or after Sept. 26, 2011.

Copyright © 2020 by Standard & Poor’s Financial Services LLC. All rights reserved.
STANDARD & POOR’S, S&P and RATINGSDIRECT are registered trademarks of Standard & Poor’s Financial Services LLC.

Reproduction in whole or in part prohibited except by permission.

                                                                                                                                                                                                                      38
You can also read