Investor Presentation - Q2-2019

Page created by Alexander Gregory
 
CONTINUE READING
Investor Presentation - Q2-2019
Investor Presentation
Q2-2019
Investor Presentation - Q2-2019
Disclaimers

Forward-Looking Information
The following presentation contains “forward-looking information” within the meaning of applicable securities laws in Canada. Forward-looking information may relate to
future events or future performance of Neo. All statements in this presentation, other than statements of historical facts, with respect to Neo's objectives and goals, as well
as statements with respect to its beliefs, plans, objectives, expectations, anticipations, estimates, and intentions, are forward-looking information. Specific forward-looking
statements in this presentation include, but are not limited to: expectations regarding certain of Neo's future results and information, including, among other things, revenue,
expenses, revenue growth, capital expenditures, and operations; statements with respect to expected use of cash balances; continuation of prudent management of
working capital; source of funds for ongoing business requirements and capital investments; expectations regarding sufficiency of the allowance for uncollectible accounts
and inventory provisions; analysis regarding sensitivity of the business to changes in exchange rates; impact of recently adopted accounting pronouncements; risk factors
relating to intellectual property protection and intellectual property litigation; and, expectations concerning any remediation efforts to Neo's design of its internal controls over
financial reporting and disclosure controls and procedures. Often, but not always, forward-looking information can be identified by the use of words such as “plans”,
“expects”, “is expected”, “budget”, “scheduled”, “estimates”, “continues”, “forecasts”, “projects”, “predicts”, “intends”, “anticipates” or “believes”, or variations of, or the
negatives of, such words and phrases, or state that certain actions, events or results “may”, “could”, “would”, “should”, “might” or “will” be taken, occur or be achieved. This
information involves known and unknown risks, uncertainties and other factors that may cause actual results or events to differ materially from those anticipated in such
forward-looking information. Neo believes the expectations reflected in such forward-looking information are reasonable but no assurance can be given that these
expectations will prove to be correct and such forward-looking information included in this discussion and analysis should not be unduly relied upon. For more information
on Neo, investors should review Neo's continuous disclosure filings that are available under its profile at www.sedar.com. Information contained in forward-looking
statements in this Presentation is provided as of the date hereof and Neo disclaims any obligation to update any forward-looking statements, whether as a result of new
information or future events or results, except to the extent required by applicable securities laws.

Non-IFRS Measures
This presentation refers to certain non-IFRS financial measures such as “Operating Income”, “Adjusted Net Income”, “EBITDA”, “Adjusted EBITDA”, and “Adjusted EBITDA
Margin”. These measures are not recognized measures under IFRS, do not have a standardized meaning prescribed by IFRS, and may not be comparable to similar
measures presented by other companies. Rather, these measures are provided as additional information to complement IFRS financial measures by providing further
understanding of Neo's results of operations from management's perspective. Neo's definitions of non-IFRS measures used in this news release may not be the same as
the definitions for such measures used by other companies in their reporting. Non-IFRS measures have limitations as analytical tools and should not be considered in
isolation nor as a substitute for analysis of Neo's financial information reported under IFRS. Neo uses non-IFRS financial measures to provide investors with supplemental
measures of its base-line operating performance and to eliminate items that have less bearing on operating performance or operating conditions and thus highlight trends in
its core business that may not otherwise be apparent when relying solely on IFRS financial measures. Neo believes that securities analysts, investors and other interested
parties frequently use non-IFRS financial measures in the evaluation of issuers. Neo's management also uses non-IFRS financial measures in order to facilitate operating
performance comparisons from period to period. For the operating segments, Neo also uses “OIBDA” and “Adjusted OIBDA”, which reconciles to operating income. Neo
uses OIBDA and EBITDA interchangeably as the use of adjustments in each measure provides the same calculated outcome of operating performance. For definitions of
how Neo defines such financial measures, please see the "Non-IFRS Financial Measures” section of Neo’s management’s discussion and analysis filing for the year ended
December 31, 2018, available on Neo’s web site at www.neomaterials.com and on SEDAR at www.sedar.com

                                                                                         2
Investor Presentation - Q2-2019
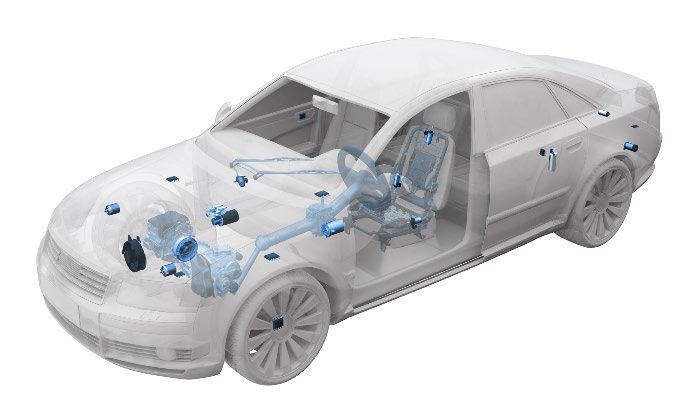
Neo Performance Materials: At A Glance

 At A Glance                                                        Selected Consolidated Results (US$ thousands)

            Exchange /            Toronto Stock Exchange:                            Q-over-Q Comparison                 Y-over-Y Comparison
         Ticker Symbol            TSX:NEO                                            Q2 2019         Q2 2018             2019           2018

          Headquarters            Toronto, Canada                      Revenue         $101,736        $110,433          $210,266        $230,618

                                  China, U.S., Germany, U.K.,
        Operational and                                              Net Income           $2,293           $19,138        $14,520         $27,990
                                  Canada, Thailand, South
         R&D footprint
                                  Korea, Singapore, Estonia         Adjusted Net
                                                                                          $5,234           $12,489        $13,374         $22,757
                                                                         Income
             Employees            1,813
                                                                       Adjusted
                                                                                        $12,004            $17,858        $28,490         $37,146
                                                                       EBITDA
     Shares Outstanding          • 38,841,183
        (as of 6-30-2019)        • 41,105,273 (diluted)

              Market Cap                                            Other Financial Metrics (as of 6-30-2019)
                                 C$461.5 million
          (as of 8-8-2019)
                                                                                   Net Cash Balance
                                                                                                                                    $70.2 million
         52-Week Range                                                       (including restricted cash)
                                 C$9.86 – C$18.49
         (as of 8-8-2019)
                                                                               Debt-to-Capitalization
Investor Presentation - Q2-2019
Company Overview

                                                                  Global Leader Involved in the Innovation, Development, Processing and
                                                                  Manufacturing of Rare Earth- and Rare Metal-Based Functional Materials

                                                                                                   LTM Revenue by Segment1                           LTM Revenue by Geography

                                                                                            Rare Metals                                                     Europe
                                                                                                                              Magnequench                    25%
                                                                                               22%
                  Designs, develops and
  Magnequench

                                                                                                                                 44%
                                                         #1 Global Market
                                                                                                                                                                                       Other
                   produces rare earth                                                                                                                                                  2%

                  magnetic powders for                  Leader of powders for                                                               North America
                     bonded and hot                    bonded and hot deformed                                      $433.8                       19%
                                                                                                                                                                       $433.8
                    deformed NdFeB                            magnets                                               million                                            million
                        magnets.                                                                                                              South Korea
                                                                                                                                                  3%
                                                                                       Chemicals &                                                                                     China
                                                                                         Oxides                                                 Thailand                               33%
                                                                                          34%                                                     3%           Japan
                                                                                                                                                                15%
Chemicals &

                  Designs, develops and                    Top 3 Global
  Oxides

                   produces rare earth-                 Producer of materials
                     based functional                                                                               Adjusted Consolidated EBITDA
                  engineered materials.
                                                             for auto catalysts
                                                                                                          $80
                                                                                                          $70                                              +
                                                                                                          $60                          $68                     $67
                                                                                           US$ millions

                                                                                                          $50                                                                    $58
                                                                                                          $40         $48
 Rare Metals

                   Produces, reclaims,                 #1 Global Producer                                 $30
                                                                                                                                   +
                   refines and markets                   of Gallium Trichloride                           $20                                                                    +
                  high-value rare metals                 (GaCl3) used in LEDs                             $10   +
                  and their compounds.
                                                                                                          $-
                                                                                                                     2016              2017                    2018              LTM

                ___________________________
                1. Percentages shown after inter-segment revenue eliminations          4
Investor Presentation - Q2-2019
End Product Applications

     The functionality that rare earths and rare metals provide includes magnetic, catalytic, luminescence,
                       electrochemical, thermal stability and superconductivity properties

                                                Major Applications

 (44% of revenue
     in LTM)
                         High Efficiency    Hybrid / Electric Vehicles   Hard Disk Drives      Automation
                             Motors

 34% of revenue
    in LTM)
                         Auto Catalysts       Multi-layer Ceramic          Wastewater         High Precision
                                                  Capacitors               Treatment              Optics

                                                            z
 (22% of revenue
     in LTM)               Aerospace            Medical Imaging          High Efficiency        Mobile
                          Applications             Systems                  Lighting         Communication

                   Rare earths and rare metals are critical to applications used in every day life

                                                                5
Investor Presentation - Q2-2019
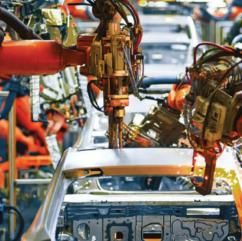
Growing End Markets with Exposure to Key Growth Trends

          Bonded Based Motor
            (~215 g / 0.5 lbs)
          69.2mm
           (2.7”)          30.6mm
                            (1.2”)
                                 30.6mm
                                  (1.2”)

     Electrification of                     Global Adoption           Consumer              Growth in         Rising Demand
       Automobiles                           of Increasingly         Demand for            Automation         for Superalloys
                                            Stringent Air and      Lighter, Smaller,
                                            Water Emission             Smarter
                                                Standards             Electronic
                                                                       Devices

Hybrid / Electric Vehicles                    High Quality      Consumer Electronics       Robotics      Aerospace Applications
                                             Auto Catalysts                              Autonomous
                                           Phosphate Removal                               Vehicles
                                              from Water                               Cloud Computing

                                           Key trends support growing demand for Neo’s products

                                                                           6
Investor Presentation - Q2-2019
Longstanding Relationships with Leading Global Customer Base

 Balanced customer base is well-diversified and includes large industrial, consumer electronics and chemical
  processing companies
 Significant portion of revenue contribution from customers who have been with Neo for 10+ years
 Provides significant value to its customers by being embedded within their supply chain and co-developing
  advanced, functional materials engineered to their needs
   ̶   For example, Neo’s work in partnership with Daido and Honda led to the commercialization of HREE-free
       traction motors for hybrid and electric vehicles, such as in current Honda Accord, Insight, Fit, and Freed models.

                                    Representative Longstanding Customers

                       Market leading customer base with longstanding relationships

                                                            7
Investor Presentation - Q2-2019
Unique Global Infrastructure with State-of-the-Art R&D Capabilities

    Leading R&D Capabilities                                          Global Sales Force                                         Cost-Competitive Manufacturing

 Ability to create functional                             World leading experts with                                           Best-in-class production facilities
  materials specifically engineered                         technical expertise required to                                       located in cost-competitive
  to meet customers’ requirements                           fulfill customers’ needs                                              jurisdictions
 8 R&D facilities across                                  12 sales offices around the world                                    10 production facilities located
  3 continents                                                                                                                    across the globe

                                                                                   Sillamäe, Estonia

                                                                  Abingdon, U.K.
                                                                                         Sagard, Germany
                            Toronto, ON       Peterborough, ON                                                                                               Hyeongok, South Korea
                                                                                       Tϋbingen, Germany
          Greenwood Village, CO                                                                                                                                       Tokyo, Japan
                                                                                                                                             Bejing, China
                                          Pendleton, IN
                                                                                                                                         Tianjin, China
            Blanding, UT
                                    Quapaw, OK                                                                                              Zibo, China            Osaka, Japan
                                                                                                                                        Jiangyin, China      Seoul, South Korea

                                                                                                                           Korat, Thailand

                                                                                                                                      Singapore

                  Production Facilities               Research & Development                           Corporate Offices                Sales & Liaison Offices

    Leading global infrastructure provide Neo with a unique competitive advantage in the industry

                                                                                        8
Investor Presentation - Q2-2019
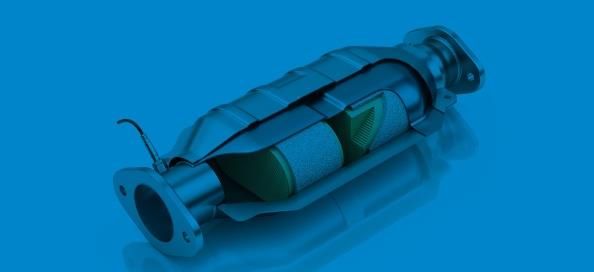
Integrated Product Development With Customers

                                     Vehicle traction motors

High efficiency
   motors
                                                                                       Vehicle
                                                                                      emissions
                                                                                      catalysts

                  Customer Collaboration Drives Product Innovation

        TRANSLATE          CREATE               BIND           DESIGN            VALIDATE/
                                                                                  DELIVER

 Materials for
semiconductor                                                           Superalloys
    chips                     Wastewater
                           Treatment Products     9
Investor Presentation - Q2-2019
Magnequench Case Studies/Results

                                                           Reducing Size and Weight

Ferrite Based Motor:                                                                                       MQ Based Motor:
              ~370g                                                                                            ~215g

                                                 Seat Motor ~25 Million pieces in 2017

                                                                         Improved Efficiency
                                        80
                                        70

    Important for
                                        60
                       Efficiency (%)

                                        50
                                        40

   continuous duty                      30
                                        20

     applications
                                        10
                                        0
                                             0        20          40       60           80      100

                                                                                                              Auto Pump
                                                                 Torque (mN-m)

                                        Auto Pumps volume ~5% of total volume in 2017

                                                                    Improved Performance
                                        6000

                                                                                                                  Stall torque
                                        5000

                                        4000
                         Speed (rpm)

                                        3000

                                        2000
                                                                                                                increased >40%
                                        1000

                                                                                                                 Motor length
                                             0
                                                 0   50    100     150   200      250    300   350
                                                                  Torque (mN-m)

                                                                                                                reduced >25%
 Trunk Lift Motor      >5 Million pieces for Trunk Lift application in 2017
                                                                                                      10
Q2-2019 Financial Performance: Consolidated

          Selected Q2-2019 Consolidated Results

   US$ 000s
                     Q-over-Q Comparison     Y-over-Y Comparison               High Free Cash Flow Conversion
 excl. Volume
                     Q2 2019     Q2 2018    YTD 2019       2018

       Volume
       (tonnes)
                         3,490      3,396        7,097          6,995              Low CAPEX ($8 - $15M)

    Revenue           $101,736   $110,433    $210,266       $230,618               Scalability (70 – 80% capacity)

 Net Income             $2,293   $19,138      $14,520        $27,990               Efficient Global Tax Structure

Adjusted Net
                        $5,234   $12,489      $13,374        $22,757
     Income                                                                        Low Commodity Exposure
     Adjusted
                       $12,004   $17,858      $28,490        $37,146
     EBITDA                                                                        Minimal Debt

  Basic EPS              $0.05      $0.48        $0.36          $0.70
                                                                                   Dividend (C$0.10)
     Adjusted
                         $0.13      $0.31        $0.33          $0.57
         EPS
                                                                                   Strong Net Cash Balance ($70.2M)
    Net Cash                                  $68,695        $98,153               (including restricted cash)
        (including     $70,229   $76,143
                                            (YTD Dec/18)   (YTD Dec/17)
 restricted cash)

    Cash Tax
                        $4,258     $3,089       $6,159         $5,985
        Paid

      CAPEX             $1,973     $3,929       $4,638         $6,234

                                                                          11
Q2-2019 Financial Performance by Segment

Selected Magnequench Results
                        Q-over-Q               Y-over-Y            • Q2-2019 volumes down YoY, mostly in legacy and longer
                       Comparison             Comparison             running programs, due to slowdown in auto markets, slower
                   Q2 2019     Q2 2018        2019         2018      economic performance in some market segments, and
Volume (tonnes)        1,367        1,554     2,812        3,081     anticipated customer inventory adjustments.
($000s)
Revenue            $41,473     $56,229      $89,028   $111,963     • Segment continues to see growth related to newer products,
Operating income    $6,164     $11,432      $15,645   $24,773
                                                                     including traction motors for hybrid / electric vehicles and
EBITDA              $8,121     $13,261      $19,544   $28,589
                                                                     programs still ramping up volumes to full production levels.
Adjusted EBITDA     $8,255     $13,408      $19,184   $28,883

Selected C&O Results
                        Q-over-Q               Y-over-Y            • Segment volume and revenue higher YoY. 3-way autocats saw
                       Comparison             Comparison             incremental growth YoY despite general slowdown in auto
                   Q2 2019     Q2 2018         2019         2018     markets, offset by decline in diesel catalyst products.
Volume (tonnes)      2,053       1,776        4,188        3,783
($000s)                                                            • Softer REE commodity prices in 1H-2019 caused lagging
Revenue            $38,534     $36,698      $82,107   $81,854        impact b/c of higher-cost inventory relative to current selling
Operating income    $3,696      $3,808      $10,322    $5,925        prices, partially offset through timing of high-value spot sales.
EBITDA              $4,870      $4,937      $12,660    $8,214        REE commodity prices began rising in June 2019.
Adjusted EBITDA     $4,924      $5,180      $11,912    $8,700

Selected Rare Metals Results
                        Q-over-Q               Y-over-Y            • Strong sales of Hafnium-based products offset by
                       Comparison             Comparison
                                                                     continuing price decline in Tantalum-based products.
                   Q2 2019     Q2 2018        2019         2018
Volume (tonnes)        154         139         272          274    • Segment continues to develop new products and focus on
($000s)                                                              value-added margins to mitigate short-term earnings
Revenue            $25,027     $21,321      $46,558   $44,092        variations to due material price volatility.
Operating income    $(371)      $1,160       $(214)    $3,639
EBITDA                 $780     $2,384       $2,142    $6,093
Adjusted EBITDA     $1,813      $2,472       $2,988    $6,268

                                                                   12
Low Exposure to Commodity Pricing Risk Allows for
Greater Focus on Value-Added Products and Margins

1                                2                                   3
    As a net buyer of rare             Example: ~90% of                    In the chart below,
    earths, with no upstream           Magnequench sales                   correlating trends can be
    or mining operations, Neo          volumes are covered by              seen between rare earth
    has material cost pass-            formulaic pass-through              consumption cost and
    through agreements on              agreements. Most C&O                adjustments to selling
    the majority of our                and RM customers are                price for typical “quarterly
    business.                          as well.                            pass-through customer.”

      Focus on downstream, value-added operations mitigates risk of rare earth pricing volatility.

                                                   13
Multiple Avenues for Growth

1                                             2                                         3
           Continued Growth in                          Growth from New
                                                                                              Product Portfolio Acquisitions
            Existing Products                          Product Development

 Well positioned to supply materials          Working with customers to develop            Strong balance sheet and the
  within broader magnetic, catalytic,           new and next generation versions of           financial flexibility to selectively
  electronic, healthcare and aerospace          current products                              pursue strategic acquisitions
  markets
                                               Driven by key macro trends that              Target companies or assets that
 Strong competitive position due to:           require the functionality that rare           would benefit from Neo’s global
    ̶    Longstanding customer                  earths provide                                reach, customer relationships, cost-
         relationships                                                                        competitive facilities and product
                                               Over 20% of current revenues come
    ̶    Product development and                                                              development skills
                                                from products not sold 5 years ago
         processing know-how                                                                 Proven track record of integrating
                                               Neo has been successful at
    ̶    Cost-competitive manufacturing                                                       acquired assets and replicating
                                                innovating new products for new
         locations                                                                            acquired technology in new
                                                markets demanded by customers
                                                                                              geographies
    ̶    Global reach with direct sales
         channels
    ̶    Geographic diversification of rare
         earth manufacturing and raw
         material supply

            i.e. Growth of complex                i.e. Development of traction motors          i.e. Integration of Silmet facility,
        auto catalysts (hybrid vehicles)              with Daido and Honda, recent                   replication of Oklahoma
              and electric vehicles                 commercialization of wastewater                   facility in South Korea
                                                               treatment

                                                                  14
Investment Highlights

       1                   2                    3                    4                   5
 Global Leader        Growing End        Unique Global        Longstanding            Strong
   in Growing         Markets with        Infrastructure      Relationships         Profitability,
Specialty Markets   Exposure to Key       Platform with        with Leading        Cash Flow and
                     Growth Trends       State-of-the-Art    Global Customer     Financial Position
                                        R&D Capabilities           Base

                    6     Proven Management Team with Exceptional Track Record

  Unique combination of these competitive advantages make Neo’s business difficult to replicate

                                                15
Questions
Appendix
Industry Overview

                                                       Overview                                              Growth CAGR

                     Two important classes of permanent magnets:
                        ̶ Ferrite (iron-based)                                                                           Roskill -
 Permanent Rare          ̶ Neodymium-iron-boron ("NdFeB") (rare-earth based), which includes sintered,
                                                                                                                          Global
  Earth Magnet             bonded and hot deformed                                                          10.1%       demand for
                                                                                                                          REO in
    Industry         Bonded magnet demand is expected to grow as they are better suited for precision                  permanent
                      motors, sensors and actuators used in automotive, consumer electronic and robotic     2016-2021    magnets
                      applications that require small or complex shapes

                     Products engineered from REOs are used in the production of automotive                             BoA/Merrill
                      emission-control catalysts                                                                           Lynch -
                                                                                                                           Market
Catalyst Industry    Developing auto catalyst applications requires close collaboration with customers
                      and long lead times, providing a barrier for new entrants                              6%          growth for
                                                                                                                            auto
                     Tightening global air emission standards are a large key driver of growth             2019-2025     catalysts

                     REEs and rare metals are indispensable inputs for many applications given their                     Roskill –
   Rare Earth         unique properties which include magnetic, catalytic, luminescence, electrochemical,                  Global

   Separation
                      thermal stability and superconductivity
                     REE deposits are found predominantly in China, which currently supplies ~87% of
                                                                                                            5.7%        demand for
                                                                                                                         separated
                      the global market                                                                                    REOs
                                                                                                            2016-2021

                     Rare metals provide functional benefits such as mechanical strength, resistance to                Growth from
                      thermal creep deformation, corrosion and oxidation and strong surface stability                      many
  Rare Metals        Typically include tantalum, niobium, gallium, hafnium, rhenium, indium, germanium,
                                                                                                                        applications
                                                                                                                        (aerospace,
                      manganese, tellurium, lithium and cobalt                                                           LEDs, etc.)

                             Positive industry fundamentals drive growth

                                                             18
Growth Trends Impacting Neo

                                                                       Growing demand for rare metals
   Increasing demand for           Tightening air emission standards    in aerospace as they provide
smaller, lighter and more             driving growth for higher            weight reduction,
    efficient micro motors           performing auto catalysts          increased fuel efficiency
                                                                        and reduced emissions

 Next generation traction motors
 used in EVs and HEVs rely on           Rare earth materials are        Ongoing rare metals demand
 superior strength and              superior for controlling                 driven by core
 efficiency provided by rare        phosphorus in wastewater                   properties
             earths

Neo benefits from increasing demand for virtually all products that require the core functionality that
                               rare earths and rare metals provide

                                                   19
Growth Trends Impacting Magnequench

               Increasing Use of Micro Motors                                                               Electrification of Automobiles1

 The number of micro motors and sensors in vehicles is                                                                               Continuously
                                                                                                                                         variable                  Fuel
  increasing                                                                                          HEV drive
                                                                                                       motor /
                                                                                                                     Windshield
                                                                                                                       wiper
                                                                                                                                      transmission
                                                                                                                                                      Blower
                                                                                                                                                                  pump
                                                                                                      generator
 Bonded magnets are better suited for a wide array of
  micro motor applications due to their ability to be                                     Variable
                                                                                           valve
  formed into unique shapes                                                               actuator

         Ferrite Based Motor                     Bonded Based Motor                      Electronic
           (~370 g / 0.8 lbs)                      (~215 g / 0.5 lbs)                     control
                                                                                          throttle
         86.3mm                                    69.2mm
          (3.4”)                39.3mm              (2.7”)                               Alternator
                                                                                                                                                                           Power seat
                                                                    30.6mm
                                 (1.5”)
                                                                     (1.2”)                                                                                         Automated
                                                                                           Engine
                                                                                                                                                                      manual
                                  30.3mm                                30.6mm           cooling fan
                                                                                                                                                                   transmission
                                   (1.2”)                                (1.2”)
                                                                                           Starter                                                              EPS
                                                                                                                                                               sensor
                                                                                          Starter /                                                  EPS
                                                                                         generator                                                   motor
                                                                                                                                                                   Ferrite Magnets
                                               ~40% lighter                                          Exhaust gas
                                                                                                                     Antilock brake
                                                                                                                     system (ABS)
                                                                                                                                          ABS
                                                                                                                                         sensor                    Neodymium Magnets
                                                                                                     recirculation
                                               and smaller1
                                                                                              Hybrid Electric Vehicles (Traction Motors)

                                                                                        Next generation traction motors in HEVs and EVs rely on
Home / Office                                                                            rare earth magnets due to their superior strength and
                                    Robotics             Automotive                      resulting efficiency
 Automation
                                                                                        Neo’s work in partnership with Daido and Honda led to the
                                                                                         commercialization of a new magnetic product used in
                                                                                         Honda’s traction motors, an exciting new platform for future
                                                                                         growth

            Neo benefits from demand for virtually all products that require small, efficient motors
___________________________
1. Source: Management estimate

                                                                                  20
Growth Trends Impacting Chemicals & Oxides

                                      Tightening Air Emission Standards                                                                                           Increased Demand for Rare Earth Oxides

Tightening air emission standards and global                                                                                                                        Demand for rare earth oxides are expected to
implementation is driving growth in demand for                                                                                                                        grow at a 5.7% CAGR from 2016 to 2021
higher performing auto catalysts
 ~5% – 10% CAGR for auto catalysts from 2016-2021
  according to Johnson Matthey and 7.8% CAGR from
                                                                                                                                                                            10.1%                          6%
  2015-2020 according to Umicore
                                       Historical Performance          Enacted Target
CO2 emission values (g/km),

                                                                                                                                 Liters per 100 kilometers
                                                                                                                                   (gasoline equivalent)
   normalized to NEDC

                                                                            Mexico 2016: 145
                                                                                Brazil 2017: 138
                                                                                       India 2022: 113                                                                 Magnet growth               Catalyst growth
                                                      Japan 2020: 122*                    Canada: 2025: 99
                                                                S. Korea 2020: 97        China US 2025: 99
                                                                          EU 2021: 95 2020: 117
                                    2000      2005        2010         2015        2020         2025              2030
                                                                                                                                                                Tightening Wastewater Treatment Standards
Source: The International Council of Clean Transportation
(*) Japan has already met its 2020 statutory targets as of 2013

                                                                                                                                                              Government regulations have become more stringent
 Expected growth in HEVs will require better performing                                                                                                       with respect to the allowable amount of phosphorus in
  catalysts
                                                                                                                                                               wastewater discharge
                                           EV Sales             ICE Sales (Including Hybrids)             EV - %
                              140
                                                                                 57% ICE / HEV
                                                                                                           100%                                               Rare earth-based functional materials for controlling
                                                                                                                         EVs as Percentage of

                              120                      92% ICE / HEV
   New Vehicle Sales

                                                                                                                          New Vehicles Sold

                              100
                                                                                                              80%                                              phosphorus in wastewater treatment systems are
                                                                                                                                                               superior to other alternatives at reaching low ppm levels
      (millions)

                              80                                                                              60%
                              60                                                                              40%
                              40                                                                                                                              Current focus on municipal
                              20
                                                                                                              20%
                                                                                                                                                               and industrial centres in the
                               -
                                    2015       2020        2025           2030        2035             2040
                                                                                                              -
                                                                                                                                                               U.S. where low phosphorus
Source: Bloomberg New Energy Finance                                                                                                                           limits are required

                                                                                                                                                  21
Growth Trends Impacting Rare Metals

       Demand Driven by Many Applications                               Rising Demand for Superalloys

 Demand for tantalum and niobium has been driven            Superalloys are commonly used in aerospace
  by the growth in consumer electronics, metal                applications
  construction materials, aerospace applications and         According to the Boeing Company, passenger travel
  healthcare applications                                     growth in the global aviation industry had a 6.2% CAGR
 Demand for gallium has been driven by the                   over the past 5 years
  growing LED market as well as the electronics              Demand for rare metals in aerospace applications is
  market due to gallium’s use in semiconductors and           likely to increase at a faster rate than the industry as a
  wireless devices                                            whole
 Many applications also benefit from the
                                                              ̶   Global effort to reduce carbon dioxide and energy usage
  superconductive properties of rare metals,                      has led to the development of new technologies that
  including these;                                                deliver weight reduction, decreased fuel consumption and
                                                                  reduced emissions

 Neo’s Rare Metals platform provides a complementary suite of functional materials and applications

                                                       22
Evolution of Applications Using Neo’s Products

 Cathode ray lighting (used                                           Fluorescent lighting in turn
  in TVs) was phosphor-                                                 replaced with LEDs, which
  based and required the                                                require GaCl3...
  use of rare earths…

                                    Replaced by fluorescent
                                     lighting applications, also
                                     phosphor-based requiring
                                     rare earths…

           Continued reliance on Neo’s products even as applications evolve…

 New applications continue to require Neo’s products due to the essential functionality they provide

                                                  23
Company History

  NEM (1994 – 2012)                                                                                 Neo Performance (2017+)
  Processor of Rare Earths                                                                          Innovator of Advanced Functional Materials
   1994: Began separating rare earths in China                                                      2017: Initial Public Offering
   1995: Listed on the TSX                                                                          Downstream focus with growing end markets
   2005: Acquisition of Magnequench, which                                                          Adapt with ever changing technologies and
    had been designing and manufacturing                                                              applications
    magnetic powder since 1985                                                                       Commercialization of recently developed
   2012: Acquired by Molycorp for $1.3 billion                                                       products such as wastewater treatment
                                                                                                     Capitalize on fast growing markets and
   Exposure to commodity price cycles                                                                exposure to key trends, including:
                                                                                                         ‒ Electrification of automobiles
                                                                                                         ‒ Increasingly stringent emission standards
                                                                                                         ‒ Growth in automation and others

                                                  Under Molycorp (2012 – 2016)
                                                  Manufacturer of Functional Materials
                                                   2015: Molycorp filed for Chapter 11 in U.S.
                                                   2015: Launched wastewater treatment
                                                    phosphate removal business
                                                   2015: Commercialized MQU program
                                                   2016: Emerged from Molycorp bankruptcy as
                                                    a much stronger entity, with all original NEM
                                                    assets plus Molycorp’s Estonia plant
                                                   Pass through costs with value-add products
                                                   > 20% of revenue from products that did not
                                                    exist 5 years ago
                                                   Neo business remained profitable through
                                                    Molycorp bankruptcy

 Neo consistently generated positive cash flow throughout its history, demonstrating its financial
   resilience and attractive value proposition as an advanced engineering products company

                                                                      24
Board of Directors

          Name                     Position         Country of Residence                       Principal Occupation

 Constantine                                                                Former Chief Executive Officer, Chairman and Director of
                                   Chairman               Canada
 Karayannopoulos1                                                            Molycorp

                                                                            Formerly CEO and Executive Director of Lynas Corporation
 Eric Noyrez1                    Lead Director             France
                                                                             Ltd.

                               President, CEO and
 Geoff R. Bedford                                         Canada            President and CEO of Neo Performance Materials
                                     Director

                                                                            Senior Vice President in the Strategy Credit group of Oaktree
 Nicholas Basso                     Director            United States
                                                                             Capital Management

                                                                            Senior Vice President in the Opportunities Funds group of
 Brook Hinchman                     Director            United States
                                                                             Oaktree Capital Management

 Claire Kennedy1                    Director              Canada            Partner in the Toronto office of Bennett Jones LLP

                                                                            Vice President in the Strategic Credit group of Oaktree Capital
 Aman Kumar                         Director           United Kingdom
                                                                             Management

                                                                            Portfolio Manager for the Strategic Credit group of Oaktree
 Edgar Lee                          Director            United States
                                                                             Capital Management

                                                                            Managing Director in the Opportunities Funds group of
 Emily Stephens                     Director            United States
                                                                             Oaktree Capital Management

___________________________
1. Independent Board Members

                                                                    25
Adjusted EBITDA Reconciliation

See accompanying notes in Neo’s Q2 2019 MD&A, filed on SEDAR and available at NeoMaterials.com

                                                                     26
Adjusted Net Income Reconciliation

See accompanying notes in Neo’s Q2 2019 MD&A, filed on SEDAR and available at NeoMaterials.com

                                                                     27
CONSOLIDATED STATEMENTS OF FINANCIAL POSITION

See accompanying notes in Neo’s Q2 2019 Financial Statements,   28
filed on SEDAR and available at NeoMaterials.com
CONSOLIDATED STATEMENTS OF PROFIT & LOSS

See accompanying notes in Neo’s Q2 2019 Financial Statements,   29
filed on SEDAR and available at NeoMaterials.com
Global Leader in Growing Specialty Markets

                    30+ years of experience developing high-performance rare earth
                     magnetic powders for NdFeB bonded magnets used in motors,
    Bonded           sensors and actuators for consumer electronics and automotive
                                                                                             #1 Global Market Leader
Magnetic Powders     applications                                                             of powders for bonded and
                    Global leader with 70-75% market share; serves as market                   hot deformed magnets
                     benchmark and pioneer in technology and quality

                    Top three global supplier to auto catalyst end markets

   Automotive       Expertise in working with its customers to meet ever tightening
                     emission standards by engineering more advanced formulations
                                                                                              Top 3 Global Producer
    Catalysts                                                                                of materials for auto catalysts
                    Qualified supplier for all leading producers of auto catalysts who
                     supply all of the leading global OEMs

                    Pioneer in processing, developing and manufacturing functional             Strategic benefits from
                     material for a diverse range of applications
   Rare Earth       Only non-Chinese company with a license to separate rare earths in
                                                                                              status as only licensed
   Separation        China                                                                   non-Chinese separator
                    Vertical integration improves quality and reduces overall costs; also   of rare earths in China
                     acts as a launchpad for new uses and applications

                    Leading global producer of advanced engineered materials made
Specialty Alloys     from rare metals                                                         #1 Global Producer of
and Rare Metals     #1 global producer of GaCl3                                                 GaCl3 used in LEDs

          Leading market positions in key specialty markets with high barriers to entry

                                                            30
Proven Management Team with Exceptional Track Record

              Geoff Bedford                                         Rahim Suleman                   Kevin Morris             Constantine Karayannopoulos
             President & CEO                                          EVP & CFO                     EVP & COO                          Chairman
 18 years of experience at Neo1                       EVP and CFO since 2017            6 years of experience at Neo1     23 years of experience at Neo1
 President, CEO and board                             Former CFO of Stackpole           EVP and COO since 2016            Served as President and CEO of
  member since 2013                                     International                                                         both Molycorp and Neo before
                                                                                                                              being acquired by Molycorp

              Greg Kroll                                         Jeffrey Hogan                   Frank Timmerman
           EVP Magnequench                                   EVP Chemicals & Oxides               SVP Rare Metals
 17 years of experience at Neo1                       18 years of experience at Neo1    12 years of experience at Neo1
 Former SVP, Sales & Marketing,                       EVP Chemicals & Oxides since      SVP Rare Metals since 2012
  at Magnequench                                        2016

  Industry leaders with the expertise to deliver results, based on a combined 200+ years of experience

 ___________________________                                                              31
1.   Includes all years spent at Neo as well as its predecessors.
Information Contact

Ali Mahdavi
Capital Markets and IR
(416) 962-3300
Email: a.mahdavi@neomaterials.com
Website: www.neomaterials.com
You can also read