Visitor Demand Mapping - for Queenstown Update 2 Published on Wednesday, June 17, 2020 - Lima
←
→
Page content transcription
If your browser does not render page correctly, please read the page content below
Visitor Demand Mapping
 for Queenstown                    Update 2

 Published on Wednesday, June 17, 2020

                                              1 | Visitor Demand Mapping for Queenstown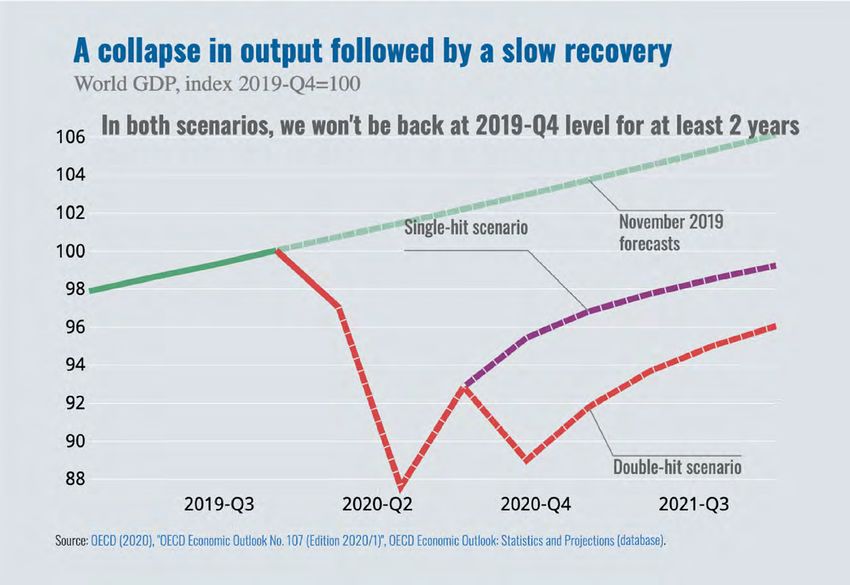
This is an update to the Visitor Demand Mapping for Queenstown-Lakes (2020 to
2024) report published on Thursday, May 14, 2020. You can get the full version of
the earlier report here.

Recent developments to factors
 that impact visitation to Queenstown
New Zealand economy
New Zealand moved to Alert level one effective midnight 9th June. High frequency indicators of economic activity
have remained steady over the past two weeks (exhibit 1), tracking slightly below the same period in 2019 .
However, total spend has tracked slightly above the same period last year, with a 2% increase in spend vs same
week prior year recorded, with industries such as repair services, home and recreational retailing and food and
liquor driving the change, likely the “revenge” buying trend1 .

While life in New Zealand maybe returning to “normal” in many ways there is no denying the ramifications of
COVID-19 will be felt for many years. The Reserve Bank of New Zealand estimates 2020 will see the biggest
drop in GDP in at least 160 years and the IMF is forecasting a -7.2% contraction in GDP growth in 2020 with the
majority of this expected to fall in Q2, 20202. The labour market is likely to be particularly effected with the wage
subsidy due to end on the 1st of September. This has the potential to cause a second wave of redundancies and
the industries that have been hardest hit are also some of the most labour intensive3 (exhibit 2).

Australia economy
Similar to New Zealand, Australia appears to have largely contained the COVID outbreak, however they are still
recording new cases most days4. The Australian economy has official entered a recession, its first since 1991.
The March quarter recorded a -0.3% decline in GDP growth with the bush fires and COVID outbreak stunting
economic growth5 . The IMF is projecting a -6.7% real GDP change for 20206. Consumer and business confidence
are rebounding (exhibit 3) and spending contracted 1.1% over the March quarter with patterns and sector spend
incredibly different mostly driven by panic buying.

Australia’s recovery like the rest of the worlds is varied and for the most part very slow with many headwinds likely
to constrict growth. These headwinds include high unemployment, the ongoing increase in Australian/ China
tensions and a variety of other international impacts such as the USA’s struggle to contain COVID, the upcoming
USA election and Brexit7.

USA Economy
                                                                                                                        2 | Visitor Demand Mapping for Queenstown

Turbulent times continue in the USA as COVID cases exceed two million infections and a “second wave” of
infections emerging. Lockdown protocols and social distancing norms have been severely impacted with the
wide spread protests supporting the Black Lives Matter movement, in almost every state8.

In spite these turbulent times, the USA economy is not fairing as badly as expected. Stock prices are rallying
defying all odds and continuing on an upward trend. All three major US indices (NASDAQ, S&P 500 and Dow
Jones) are up almost 40 percent since March. This is causing suspicion of a “stock market bubble” and concern
around the disconnect between markets and the actual economic data which has shown the USA is officially in a
recession (exhibit 4)9. The disconnect between share prices and reality began to show last Friday (12/06/2020) as
the Dow Jones slid -6.9% in a day10.

The IMF is predicting a -5.6% real GDP growth this year with a bounce back to 4.7% in 2021, so there is no doubt
hard times are here11. An election year, political unrest and protest, new COVID-19 outbreaks and virus hotspots
and escalating tensions between US and China make the road to recovery for the US economy very uncertain.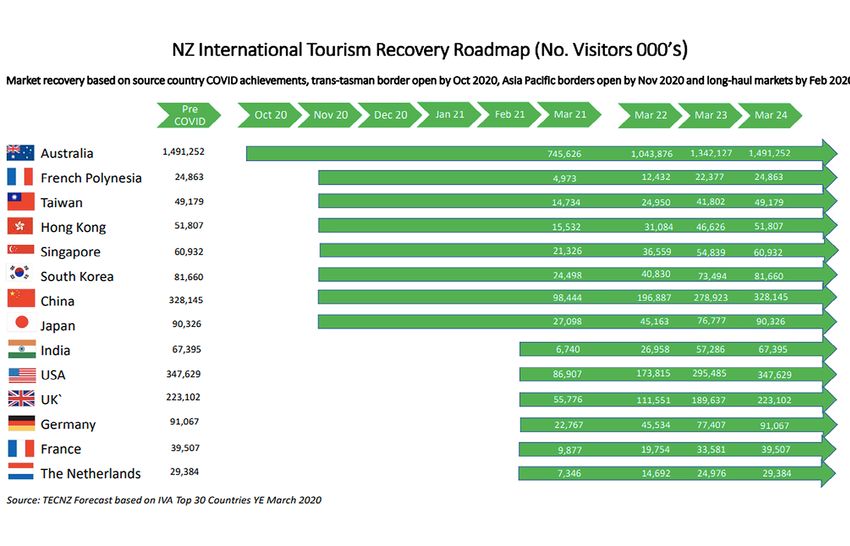
China Economy
The Chinese Economy is firmly on the road to a recovery following its COVID-19 slump. There are two projections
for recovery, which China is simultaneously experiencing depending on what industry you look at12. Both
projections are V shaped but one is a sharp V shaped depicting a fast rebound, on the supply side of the
economy, and a lazier V, depicting a weaker rebound, on the demand side. Consumption has been slow to
recover likely due to high unemployment but it seems this is turning a corner with May retail sales just 3% lower
than May last year. While the recovery is on track there are still isolated outbreaks of COVID-19 clusters emerging
with one in the capital Beijing in the last few days which will drive China toward a W shaped recovery.

 Global Economy
 It was a big fortnight with the International Monetary Fund and the OECD both releasing their reforecast
 expectations for 2020 with COVID-19 impacts factored in. Links to both documents can be found in the reference
 section.

 The OECD released its latest Economic Outlook outlining two scenarios. The first assumes no second wave
 outbreak occurs which will result in a -6% global GDP growth vs last year . The second assumes a second wave
 of the outbreak, which would equate to a -7.6% global GDP growth (exhibit 5). The OECD doesn’t favour either
 of these scenarios – they see them both equally as likely to occur. OECD state that the COVID-19 pandemic has
“triggered the most severe economic recession in nearly a century”. Euro area is predicted to suffer the most with
 the UK having largest expected decline with a -11.5% in the single wave scenario. For a break down of the GDP
 declines see exhibit 6.

The World Bank also have released their reforecast expectations for the remainder of 2020. Like the OECD
Economic Outlook Report, they also expect the deepest recession since World War 2. In their June 2020 Global
Economic Prospects they outline that they expect to see a -5.2% global GDP growth. This is slightly less than the
OECD, but it does go on expand, with advanced economies expecting a -7% decline and emerging economies
expecting -2.5% decline (exhibit 7).

 Queenstown Lakes Economy
The welcome return of domestic visitation at Level 2 provided a well needed boost over the Queen’s Birthday
Weekend. Spending in the Queenstown Lakes Economy has increased. Over Queens Birthday spending
recovered to be just 4% lower than the same week last year and the past four weeks have been an average of
20% lower than the same period last year, during level four this was down an average of 76% vs same period prior
year2 (exhibit 8).

 Global Aviation
 IATA released its semiannual report on the economic performance of the airline industry and as expected the
 impact on the aviation will be severe. They are forecasting a -50.4% change in spend on air transport from last
 year and expect losses to continue into 2021 15 (exhibit 9). This highlights the importance that aviation plays in
 enabling global economic development pointing out that unique city pair connectivity was 67% lower than a year
                                                                                                                       3 | Visitor Demand Mapping for Queenstown

 ago. The only positive was the decline in oil prices which has resulted in lower prices for jet fuel.

 It seems though that aviation has reached a turning point in the crisis, in April Traffic (RPKs) fell 94%, with the
 absolute low on 21st April 2020 16. Since then the number of flights has increased 30%, but still down 73%
 since 1st January 2020 . A lot of the increase in the number of flights has been driven by the domestic markets
 recovering in the Asia Pacific driven by South Korea, China, Vietnam and New Zealand (exhibit 10).

 Domestic Aviation
The move to alert level one has seen the removal of social distancing meaning flights can run to full seating
capacity. Recent developments in the New Zealand domestic market include Air New Zealand and Jetstar
releasing their domestic schedules for the coming months. Air New Zealand expect to be operating at 55% of its
pre pandemic capacity over July/August and Jetstar expect to have an official update “soon” but have released
very competitive pricing.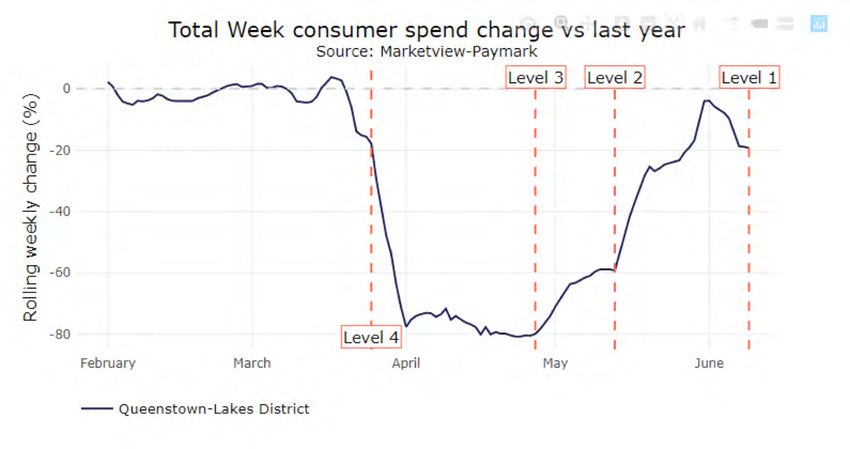
Queenstown Aviation
The recent announcements of increases in flights are particularly encouraging for the Queenstown region with
75% of the usual Air New Zealand seat capacity to return over the July/ August period 17. Air New Zealand alone
will provide 47 weekly services between Queenstown and Auckland, 19 between Wellington and 18 between
Christchurch. Jetstar’s new schedule indicates flight capacity to about 60% of usual at this time of the year.

Epidemiology
Now that New Zealand has moved to level one and to the new normal it could be easy to forget that in many parts
of the world COVID-19 cases are still spiraling upwards with new hotspots emerging in South America, Russia and
Africa (exhibit 11). The Boston Consulting Group have conducted an in-depth examination concluding that the
crush and contain method, which was adopted in New Zealand, is the most effective for suppressing COVID-1918.

According to WHO on 9th June 2020 there are 10 candidate vaccines in clinical evaluation with a further
126 candidate vaccines in preclinical evaluation19. The F.D.A. recently withdrew emergency approval for
hydroxychloroquine and chloroquine the drugs that USA president Donald Trump heavily promoted. The F.D.A.
stated that they are “unlikely to be effective”20.

Multiple new testing technologies are on track to being approved, which will aid the opening of international
borders. These include a “breathalyser” which can detect COVID-19 in under one minute21.

Domestic Market
MRTE April spend was released and as expected spend was practically nonexistent due to level four lockdown
being in place for the whole month. On a more positive note, Queens Birthday provided a boost to the tourism
industry with 1 in 10 New Zealanders hitting the road or sky over the period22. This peaked on 31st of May with
520,000 people out of their home regions and Queenstown saw a 76% increase in domestic visitor numbers
compared to the seven days prior over the weekend (exhibit 12).

Australia Market
Domestic tourism is set to boom in Australia according to a Roy Morgan Research report once state borders are
re-opened, with 10.5 million intending to take a domestic holiday 23. The re-opening of state borders isn’t looking
too far off with South Australia reopening on 20th July and Tasmania in mid-July, Queensland on 10th July. ACT,
Victoria and New South Wales never closed off state borders 24.

The New Zealand / Australian bubble is also somewhere on the horizon with the official blueprint for the
resumption of safe Trans-Tasman travel given to the Australian and New Zealand Prime Ministers on the 5th
June by the Trans-Tasman Safe Border Group25. A register for interest for the first flight between Canberra and
Wellington in July has been released by Canberra Airport but there has been no official approval on either the
Aussie or NZ side for these flights to go ahead.

China
                                                                                                                      4 | Visitor Demand Mapping for Queenstown

The world continues to watch the Chinese market closely for trends for what a restarted tourism industry could
look like. McKinsey has been tracking consumer sentiment toward travel since the beginning of April and recently
have begun seeing a return of families and older demographics interested in leisure travel 26.

China Eastern Airline, China’s second largest airline, is keen to capitalize on the emerging demand for domestic
travel and have launched a new airline with a schedule focusing on connections to leisure destinations like Hainan
and Yunnan.

Europe
Europe is looking toward reopening their borders with the European Union telling members they should “open
up as soon as possible” suggesting the next week was a good date . Many countries are following that advice
and allowing travel between EU countries, Britain and the Schengen zone but not many are extending outside
of the European area. Many countries are restricting which countries their borders are open to and Britain is still
enforcing a 14-day quarantine on return.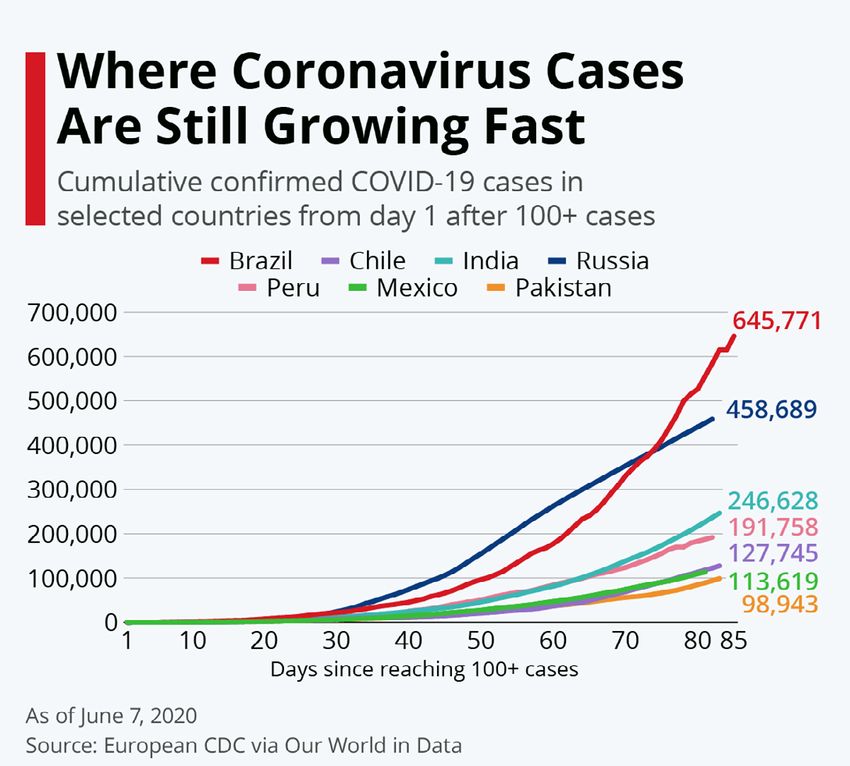
Global
 Deep Knowledge group (a consortium of companies and nonprofits owned by Deep Knowledge Ventures) has
 released a report detailing the top 100 safest countries for travelling, These are based on 130 quantitative and
 qualitative parameters and over 11,400 data points in categories like quarantine efficiency, monitoring and
 detection, health readiness, and government efficiency . The number one spot was taken out by Switzerland, with
 New Zealand ranking number nine on the list. For the full list see exhibit 13.

 The United Nations World Tourism Organisation (UNWTO) is calling for a restart to tourism and has created a
“Global Guidelines to Restart Tourism” outlining the roadmap and priorities for the sector.

                                                                                                                    5 | Visitor Demand Mapping for Queenstown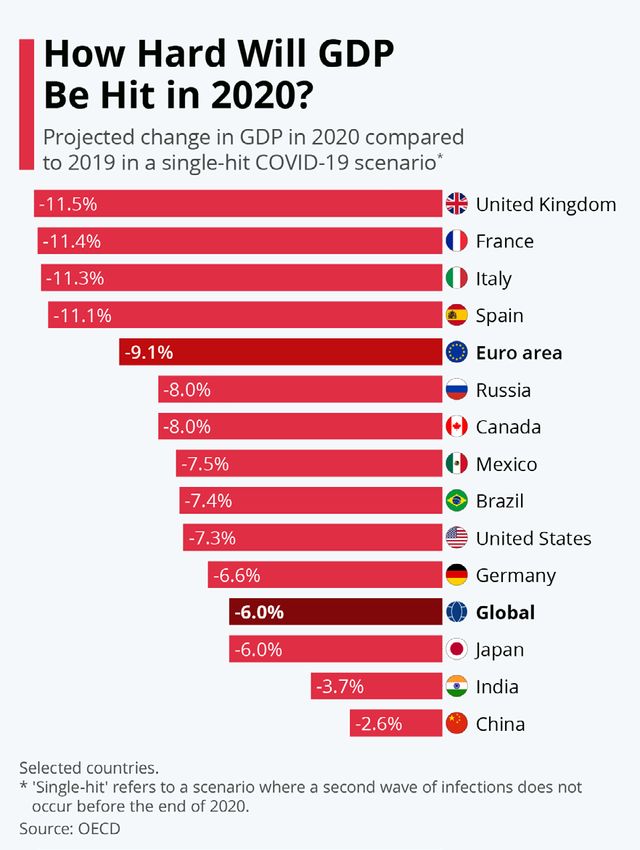
Updates in Destination Queenstown
Assumptions
Scenario Updates
There are no updates to the Destination Queenstown Scenarios. TECNZ have released their road map to NZ
International Tourism Recovery and are expecting to see a return to pre COVID international visitor arrivals until
March 2024 . Their assumptions around long haul border reopening are optimistic in comparison to Destination
Queenstown’s with the majority of Asia–Pacific borders open by November and then further long haul markets,
such as the USA and UK, open by March 2021 (exhibit 14).
Scenarios
Queenstown – All markets
$350m
$300m
Forecast
Historic
$250m
Mid
$200m
6 | Visitor Demand Mapping for Queenstown
$150m
Optimistic
$100m
$50m
Conservative
0
APR 2017
JUL 2017
OCT 2017
JAN 2018
APR 2018
JUL 2018
OCT 2018
JAN 2019
APR 2019
JUL 2019
OCT 2019
JAN 2020
APR 2020
JUL 2020
OCT 2020
JAN 2017
JAN 2021
APR 2021
JUL 2021
OCT 2021
JAN 2022
APR 2022
JUL 2022
OCT 2022
JAN 2023
APR 2023
JUL 2023
OCT 2023
JAN 2024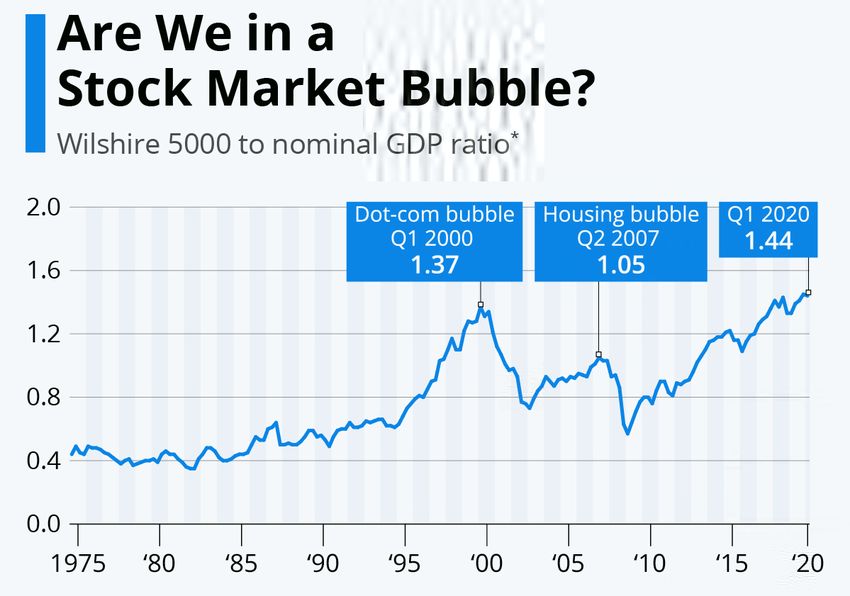
0
$50m
$100m
$150m
$200m
$250m
$300m
$350m
0
$50m
$100m
$150m
$200m
$250m
$300m
$350m
APR 2020 APR 2020
JUL 2020 JUL 2020
OCT 2020 OCT 2020
JAN 2021 JAN 2021
APR 2021 APR 2021
Optimistic
JUL 2021 JUL 2021
Queenstown – All Markets Optimistic Scenario
OCT 2021 OCT 2021
Queenstown – All Markets Conservative Scenario
JAN 2022 JAN 2022
Forecast
Forecast
APR 2022 APR 2022
JUL 2022 JUL 2022
OCT 2022 OCT 2022
JAN 2023 JAN 2023
APR 2023 APR 2023
JUL 2023 JUL 2023
OCT 2023 OCT 2023
Conservative
JAN 2024 JAN 2024
7 | Visitor Demand Mapping for Queenstown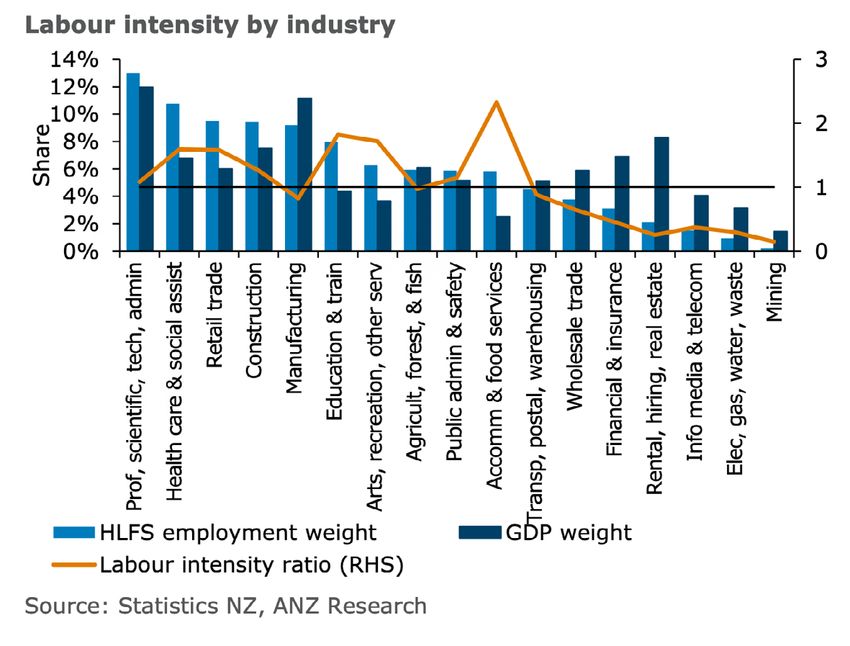
Percentage of Market Spend Recovery Compared to MBIE 2019 – 2024 Forecasts (Monthly, Queenstown
Region)

                                                                                                  8 | Visitor Demand Mapping for Queenstown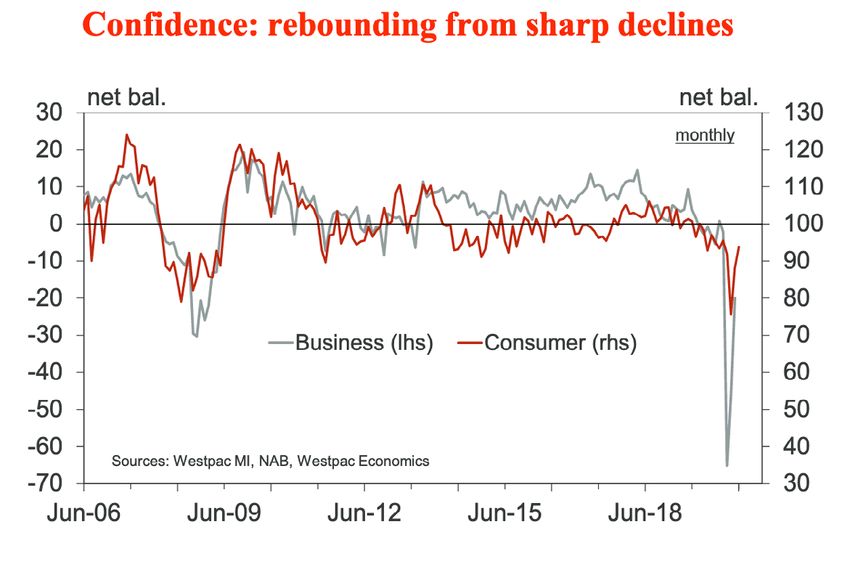
Exhibits
Exhibit 1.
High-Frequency
The New Zealand Treasury: Indicators
Weekly Economic Update. 5th June 2020
Traffic Movement Freight Movement
Weekday Light Traffic, Annual Change Weekday Heavy Traffic, Annual Change
% % % %
20 20 20 20
0 0 0 0
-20 -20 -20 -20
-40 -40 -40 -40
-60 -60 -60 -60
-80 -80 -80 -80
-100 -100 -100 -100
24 Mar 13 Apr 1 May 21 May 10 Jun 24 Mar 13 Apr 1 May 21 May 10 Jun
Auckland Christchurch Auckland Christchurch
Dunedin Hamilton Dunedin Hamilton
Wellington Wellington
Source: Waka Kotahi NZ Transport Agency Source: Waka Kotahi NZ Transport Agency
Electricity Demand Retail Spending
Electricity Demand, Annual Change Total consumer spend, 7-day rolling sum
% % $m $m
10 10 2,000 2,000
5 5
1,600 1,600
0 0
1,200 1,200
-5 -5
800 800
-10 -10
400 400
-15 -15
-20 -20 0 0
1 Apr 15 Apr 29 Apr 13 May 27 May 10 Jun 16 Mar 6 Apr 27 Apr 18 May 8 Jun
Exhibit 2. Source: Electricity Authority Source: Paymark and Verifone data via Data Ventures
ANZ Research: New Job
Zealand Weekly Focus, Great job, but...
Seeker Support . Published
Fiscal 8th
Support: Wage June(paid)
Subsidy 2020 (Link)
Thousands Thousands $ Billion $ Billion
140 140 3.6 18
120 120 3.2 16
2.8 14
100 100
2.4 12
80 80 2.0 10
60 60 1.6 8
1.2 6
40 40
0.8 4
20 20 0.4 2
0 0 0.0 0
10 Jan 31 Jan 21 Feb 13 Mar 3 Apr 24 Apr 15 May 5 Jun 27 Mar 10 Apr 24 Apr 8 May 22 May 5 Jun
JS - Work Ready JS - Health Condition and Disability Weekly amount paid Cumulative amount paid (RHS)
Source: MSD Source: MSD
Weekly Economic Update – 12 June 2020 – The Treasury Page 2
9 | Visitor Demand Mapping for Queenstown
Exhibit 3.
Westpac: Westpac Market Outlook June 2020. Australia and the global economy. Published 11th
June 2020. (Link)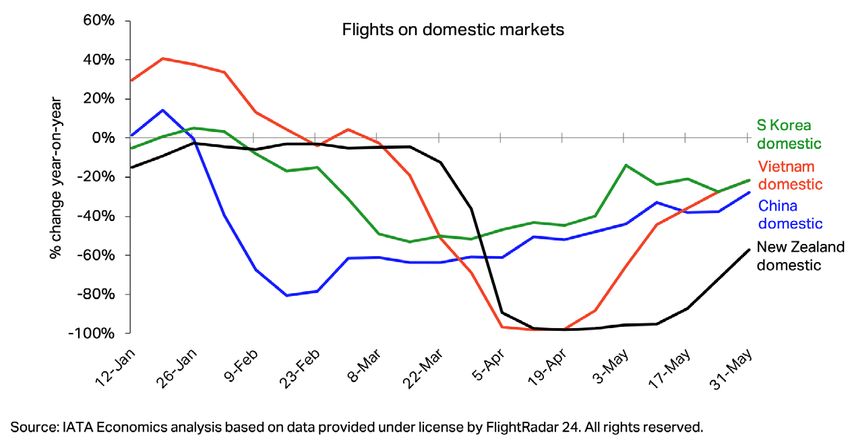
Exhibit 4.
Statista: Are we in a stock market Bubble? Published 11th June 2020. (Link)

 Exhibit 5.
 OECD: OECD Economic Outlook, Volume 2020 Issue 1: Preliminary Version. Published 10th June 2020. (Link)

Exhibit 6.
Statista: How hard will GDP
be Hit in 2020. Published 10th
June 2020. (Link).
                                                                                                           10 | Visitor Demand Mapping for Queenstown
Exhibit
4 7.C H A P T E R 1 G LO BAL EC O NO MIC P ROS P EC TS | J U NE 2020
The World Bank: Global Economic Prospects, June 2020. Published 8th June 2020. (Link)
TABLE 1.1 Real GDP1 Percentage point
(Percent change from previous year) differences from January
2020 projections
2017 2018 2019e 2020f 2021f 2020f 2021f
World 3.3 3.0 2.4 -5.2 4.2 -7.7 1.6
Advanced economies 2.5 2.1 1.6 -7.0 3.9 -8.4 2.4
United States 2.4 2.9 2.3 -6.1 4.0 -7.9 2.3
Euro Area 2.5 1.9 1.2 -9.1 4.5 -10.1 3.2
Japan 2.2 0.3 0.7 -6.1 2.5 -6.8 1.9
Emerging market and developing economies 4.5 4.3 3.5 -2.5 4.6 -6.6 0.3
Commodity-exporting EMDEs 2.2 2.1 1.5 -4.8 3.1 -7.4 0.2
Other EMDEs 6.1 5.7 4.8 -1.1 5.5 -6.2 0.3
Other EMDEs excluding China 5.4 4.8 3.2 -3.6 3.6 -7.6 -0.8
East Asia and Pacific 6.5 6.3 5.9 0.5 6.6 -5.2 1.0
China 6.8 6.6 6.1 1.0 6.9 -4.9 1.1
Indonesia 5.1 5.2 5.0 0.0 4.8 -5.1 -0.4
Thailand 4.1 4.2 2.4 -5.0 4.1 -7.7 1.3
Europe and Central Asia 4.1 3.3 2.2 -4.7 3.6 -7.3 0.7
Russia 1.8 2.5 1.3 -6.0 2.7 -7.6 0.9
Turkey 7.5 2.8 0.9 -3.8 5.0 -6.8 1.0
Poland 4.9 5.3 4.1 -4.2 2.8 -7.8 -0.5
Latin America and the Caribbean 1.9 1.7 0.8 -7.2 2.8 -9.0 0.4
Brazil 1.3 1.3 1.1 -8.0 2.2 -10.0 -0.3
Mexico 2.1 2.2 -0.3 -7.5 3.0 -8.7 1.2
Argentina 2.7 -2.5 -2.2 -7.3 2.1 -6.0 0.7
Middle East and North Africa 1.1 0.9 -0.2 -4.2 2.3 -6.6 -0.4
Saudi Arabia -0.7 2.4 0.3 -3.8 2.5 -5.7 0.3
Iran 3.8 -4.7 -8.2 -5.3 2.1 -5.3 1.1
Egypt2 4.2 5.3 5.6 3.0 2.1 -2.8 -3.9
South Asia 6.5 6.5 4.7 -2.7 2.8 -8.2 -3.1
India3 7.0 6.1 4.2 -3.2 3.1 -9.0 -3.0
Pakistan2 5.2 5.5 1.9 -2.6 -0.2 -5.0 -3.2
Bangladesh2 7.3 7.9 8.2 1.6 1.0 -5.6 -6.3
Sub-Saharan Africa 2.6 2.6 2.2 -2.8 3.1 -5.8 0.0
Nigeria 0.8 1.9 2.2 -3.2 1.7 -5.3 -0.4
South Africa 1.4 0.8 0.2 -7.1 2.9 -8.0 1.6
Angola -0.1 -2.0 -0.9 -4.0 3.1 -5.5 0.7
Memorandum items:
Real GDP1
High-income countries 2.4 2.2 1.7 -6.8 3.8 -8.3 2.3
Developing countries 4.8 4.4 3.7 -2.4 4.7 -6.7 0.2
Low-income countries 5.4 5.8 5.0 1.0 4.6 -4.4 -0.9
BRICS 5.3 5.3 4.7 -1.7 5.3 -6.6 0.4
World (2010 PPP weights)4 3.9 3.6 2.9 -4.1 4.3 -7.3 1.0
World trade volume5 5.9 4.0 0.8 -13.4 5.3 -15.3 2.8
Commodity prices6
Oil price 23.3 29.4 -10.2 -47.9 18.8 -42.5 16.9
Non-energy commodity price index 5.5 1.8 -4.2 -5.9 3.0 -6.0 1.3
Source: World Bank.
1. Headline aggregate growth rates are calculated using GDP weights at 2010 prices and market exchange rates.
Exhibit 8.
2. GDP growth rates are on a fiscal year basis. Aggregates that include these countries are calculated using data compiled on a calendar year basis. Pakistan's growth rates are based on
GDP at factor cost. The column labeled 2019 refers to FY2018/19.
The New Zealand Misistry of Business, Innovation and Employment: Consumer Spending Dashboard – COVID-19
3. The column labeled 2018 refers to FY2018/19.
11 | Visitor Demand Mapping for Queenstown
4. World growth rates are calculated using purchasing power parity (PPP) weights, which attribute a greater share of global GDP to EMDEs than market exchange rates.
Response. Pulled 15th June 2020. (Link)
5. World trade volume of goods and non-factor services.
6. Oil price is the simple average of Brent, Dubai, and West Texas Intermediate prices. The non-energy index is the weighted average of 39 commodity prices (7 metals, 5 fertilizers, 27
agricultural commodities). For additional details, please see http://www.worldbank.org/commodities.
Note: PPP = purchasing power parity; e = estimate; f = forecast. World Bank forecasts are frequently updated based on new information. Consequently, projections presented here may differ
from those contained in other World Bank documents, even if basic assessments of countries’ prospects do not differ at any given date. Country classifications and lists of emerging market
and developing economies (EMDEs) are presented in Table 1.2. BRICS include: Brazil, Russia, India, China, and South Africa. Due to lack of reliable data of adequate quality, the World
Bank is currently not publishing economic output, income, or growth data for Venezuela, and Venezuela is excluded from cross-country macroeconomic aggregates.
Click here to download data.Exhibit 9.
IATA: Economic Performance of the Airline Industry. Published 9th June 2020. (Link)
Exhibit 10.
IATA: COVID-19: Air Travel reaching a turning point. Published 3rd June 2020. (Link)
Domestic Asia Pacific recovery points to improving demand in May
Exhibit 11.
Statista: Where Coronavirus Cases Are Still Growing Fast. Published 3rd June 2020 (Link) 12 | Visitor Demand Mapping for QueenstownExhibit 12.
Data Ventures/ TNZ: Queen’s Birthday Domestic Visitor Report. Published 4th June 2020. (Link)
1 WEEK AGO vs WEEK BEFORE QUEENSTOWN
Exhibit 13.
COVID-19 Ranking of 200 Countries and Regions
Data Ventures/ TNZ: Queen’s Birthday Domestic Visitor Report. Published 4th June 2020. (Link)
Rank Region Score Rank Region Score Rank Region Score Rank Region Score
1 Switzerland 752 26 Qatar 575 51 Uruguay 536 76 Mongolia 499
2 Germany 749 27 Liechtenstein 572 52 Vatican City 535 77 Lebanon 499
3 Israel 748 28 Poland 570 53 Italy 533 78 Belgium 498
4 Singapore 744 29 Lithuania 566 54 Serbia 532 79 Andorra 498
5 Japan 738 30 Malaysia 565 55 Philippines 532 80 Cayman Islands 491
6 Austria 726 31 Latvia 564 56 India 532 81 Armenia 484
7 China 717 32 Slovenia 564 57 Romania 531 82 Moldova 483
8 Australia 716 33 Oman 562 58 USA 530 83 Myanmar 482
9 New Zealand 715 34 Greece 560 59 Slovak Republic 530 84 Bangladesh 482
10 South Korea 712 35 Estonia 556 60 France 529 85 Sri Lanka 482
11 United Arab Emirates 700 36 Croatia 556 61 Russia 525 86 Egypt 480
12 Canada 699 37 Turkey 556 62 Argentina 524 87 Tunisia 478
13 Hong Kong 698 38 Ireland 551 63 Belarus 523 88 Albania 476
14 Norway 685 39 Georgia 550 64 Monaco 523 89 Jordan 475
13 | Visitor Demand Mapping for Queenstown
15 Denmark 671 40 Cyprus 550 65 Sweden 522 90 Panama 471
16 Taiwan 667 41 Chile 549 66 Ukraine 520 91 Brazil 470
17 Saudi Arabia 657 42 Montenegro 548 67 Gibraltar 518 92 Morocco 465
18 Hungary 656 43 Czech Republic 545 68 United Kingdom 513 93 Algeria 461
19 Netherlands 651 44 Malta 544 69 South Africa 512 94 Honduras 457
20 Vietnam 637 45 Spain 543 70 San Marino 509 95 Paraguay 455
21 Kuwait 633 46 Portugal 542 71 Kazakhstan 508 96 Peru 453
22 Iceland 600 47 Thailand 541 72 Bosnia and Herzegovina 508 97 Indonesia 450
23 Bahrain 592 48 Bulgaria 541 73 Iran 505 98 Cambodia 448
24 Finland 584 49 Greenland 538 74 Ecuador 505 99 Laos 442
25 Luxembourg 576 50 Mexico 537 75 Azerbaijan 499 100 Bahamas 440Exhibit 14.
Tourism Ticker: TECNZ maps return to pre-Covid arrivals. Published 15th June 2020. (Link)
Exhibit 15.
Covid-19 WHO bell curves (Current as of 02-06-2020)
(World Health Organisation: WHO Coronavirus Disease (COVID-19) Dashboard. Link
Global
New Zealand
14 | Visitor Demand Mapping for Queenstown
AustraliaChina
United States
United Kingdom
South Korea
Japan
15 | Visitor Demand Mapping for Queenstown
GermanyIndia
Singapore
16 | Visitor Demand Mapping for QueenstownSources and
References
1 The New Zealand Misistry of Business, Innovation and Employment: Consumer Spending Dashboard – COVID-19 Response. Pulled 15th June 2020. (Link)
2 International Monetry Fund: New Zealand Country At a Glance. Pulled 15th June 2020 (Link)
3 ANZ Research: New Zealand Weekly Focus, Great job, but... . Published 8th June 2020 (Link)
4 Australian Government Department of Health: Coronavirus (COVID-19) current situation and case numbers. Pulled 16.06.2020. (Link)
5 The Guardian: Australia enters first recession in 29 years after blow from bushfires and coronavirus. Published 3rd June. (Link)
6 International Monetry Fund: Australia Country At a Glance. Pulled 15th June 2020 (Link)
7 Westpac: Westpac Market Outlook June 2020. Australia and the global economy. Published 11th June 2020. (Link)
8 Bloomberg: Second U.S. Virus Wave Emerges as Cases Top 2 Million. Published 11th June 2020. (Link)
9 The New York Times. Forgetting Contagion, Stocks recover their Losses. Published 8th June 2020. (Link)
10 Trading Economics: Dow Jones Industrial Average 1896 -2020 data. Pulled 15th June 2020. (Link)
11 International Monetary Fund: United States Country At a Glance. Pulled 15th June 2020 (Link)
12 The Economist: V Shapes: China’s Economy. Published 15th June 2020. (Link)
13 OECD: OECD Economic Outlook, Volume 2020 Issue 1: Preliminary Version. Published 10th June 2020. (Link)
14 The World Bank: Global Economic Prospects, June 2020. Published 8th June 2020. (Link)
15 IATA: Economic Performance of the Airline Industry. Published 9th June 2020. (Link)
16 IATA: COVID-19: Air Travel reaching a turning point. Published 3rd June 2020. (Link)
17 Air New Zealand Press Releases: Air New Zealand updates domestic schedule for July and August. Released 4th June 2020. (Link)
17 | Visitor Demand Mapping for Queenstown
18 Boston Consulting Group. Three Paths to the Future. Published 27th May 2020. (Link)
19 World Health Organisation: DRAFT landscape of COVID-19 candidate vaccines – 9th June2020. Published 30th May 2020. (Link)
20 The New York Times: The F.D.A. withdrew emergency approval for malaria dugs promoted by Trump. Published 16th June 2020. (Link)
21 The Australian Jewish News. Israel invents one-minute coronavirus breath test. Published 28th May 2020. (Link)
22 Data Ventures/ TNZ: Queen’s Birthday Domestic Visitor Report. Published 4th June 2020. (Link)
23 Roy Morgan: More than 2 million thwarted overseas holiday-makers ready to be wooed by domestic tourism. Published 5th June. (Link)
24 The New Daily: Australia is bordering on open: These states are leading the way. Published 13th June 2020. (Link)
25 Radio New Zealand: Trans-Tasman bubble plan from expert group given to prime ministers. Published 5th June 2020. (Link)26 McKinsey: China’s travel recovery gains steam: How families are planning their summer vacations. Published 12th June 2020. (Link)
27 AP News: Europe reopens many boarders but not to Americans, Asians. Published 14th June 2020. (Link)
28 Deep Knowledge Group: Big Data Analysis of 200 Countries and Regions COVID-19 Safety Ranking and Risk Assessment. Published June 2020. (Link)
29 Tourism Ticker: TECNZ maps return to pre-Covid arrivals. Published 15th June 2020. (Link)
18 | Visitor Demand Mapping for QueenstownYou can also read