2021 half-year results 5 August 2021 - Hammerson
←
→
Page content transcription
If your browser does not render page correctly, please read the page content below
2021 half-year results
5 August 2021

                                               1

                         The Oracle, Reading
Agenda

         Overview

         Financial results

         Strategy update

         Q&A

                             2
Overview
Progress against FY20 priorities
Balance sheet Strategy Operational
Strengthened capital structure Update on portfolio & organisational reviews Rent collection improving(1)
£403m of disposals, including French presented today: FY20 now at 90%
minority stakes Simplify organisation by more efficient HY 21 at 71%
Issue of €700m 1.75% sustainability- structures and platform
linked bond
Footfall c.80% pre-Covid levels
Redeemed €500m 2022 bond & 53% New leadership:
of 2023 €500m bond CFO with experience in transformation
Leasing volumes improving (+£5.4m on H1
£297m of private placement notes & technology
20, £+1.4m on H1 19)(2)
repaid Expertise in repositioning of assets and
Right categories and structures
£415m RCF maturing 2022 refinanced development
to £200m of facilities maturing 2026 Strong pipeline
Net debt reduced from £2.2bn to £1.9bn
No significant unsecured maturities until 2025
1
2
Rent collection was FY20 89%, HY 21 68% as at 9 July 2021
Flagships only
3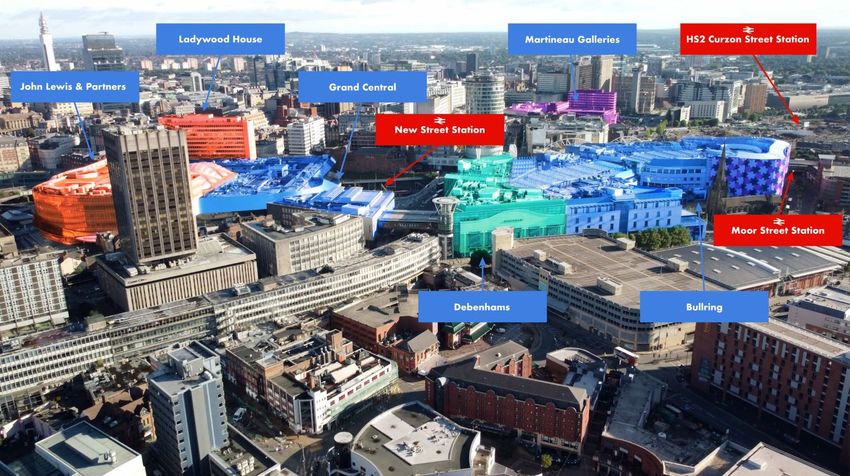
Half-year results

                    Westquay, Southampton
2021 half-year financial results
H1 headline results
                                                                                                                                              30 June 2021                      30 June 2020    Change

Income statement    Adjusted net rental income (£m)(1) (2)                                                                                                        87.2                  94.4      (8%)

                    LFL NRI (£m)                                                                                                                                 67.7       0           67.60     0.1%
                    Premium outlets earnings (£m)(3)                                                                                                             (2.0)                  (7.4)     73%

                    Adjusted earnings (£m)                                                                                                                        20.1                  17.7      14%

                    IFRS loss (£m)(4)                                                                                                                      (375.5)                  (1,088.4)     65%

                                                                                                                                              30 June 2021                      31 Dec 2020     Change

Balance sheet       Managed portfolio value (£m)(1)                                                                                                           3,596                    4,414     (19%)

                    Value Retail net asset value (£m)                                                                                                         1,130                    1,154      (2%)

                    Net debt (£m)(1)                                                                                                                       (1,879)                   (2,234)      16%

                    Value Retail value (£m)                                                                                                                   1,902                    1,924      (1%)

                    Value Retail net debt (£m)                                                                                                                  (690)                  (689)       0%

                    EPRA NTAPS (p)                                                                                                                                    69                  82     (16%)
                                        1   Figures on a proportionally consolidated basis excluding Value Retail.
                                        2   Calculated on an adjusted basis to exclude the change in the provision for amounts not yet recognised in the income statement                            5
                                        3   30 June 2020 includes VIA Outlets earnings of £5.6m which was disposed of on 31 October 2020
                                        4   Includes revaluation deficit on Group portfolio including Premium Outlets of £361.2m (30 June 2020: £939.6m)
2021 half-year financial results
Adjusted earnings walk
                                                                                                                                                                                                                                   slide 41

H1 2021 Adjusted earnings walk (£m)(1)
                                                                                                                                               Surrender premiums           11.3

 20.0                                                                                                                                          Provisions                    6.2

                                                                                                                                               Tenant failure,
 18.0                                                                                                                                          leasing, and void            (9.2)
                                                                                                                                               costs

 16.0                                                                                                                                          Concessions                  (6.6)

 14.0                                                                                                                                                                                                                11.3
                       7.8
                                                                                                                                               Variable income
                                                                                                                                                                            (1.6)
                                                                                                                                               and other

 12.0                                                                                                                                          LFL NRI                      0.1

 10.0                                                                                                                                                                                                                              20.1
          17.7
  8.0
                                           5.0
  6.0

  4.0
                                                                                                                                                                                         8.3                          8.8
                                                                     2.8
  2.0                                      4.9
                                                                                                  1.3
  0.0                                                                                                                          0.4                          0.1
                                 (2)                   (3)
         H1
         Jun 2020
             2020    Disposals         Other NRI             D&O insurance                    Other net                     FX & tax                      LFL NRI                   Net interest                Value Retail       H1
                                                                                                                                                                                                                                   H1 2021
                                                                                                                                                                                                                                      2021
                                                                                               admin

                                       1   At constant FX
                                       2   Disposals include VIA H120 earnings of £5.6m and year on year change in NRI for H121 disposals                                                                                                     6
                                       3   Other NRI reflects year-on-year non-LFL changes in NRI on Les 3 Fontaines, Cergy, which is undergoing a major extension, and assets classified as Developments and UK Other portfolio
2021 half-year financial results
Premium outlets earnings walk
                                                                                                                                    slides 56-60

H1 2021 Premium outlets earnings walk (£m)(1)

 5.0                                                                                                                                   (2.0)
 3.0
           5.6                                                                                                       1.3
 1.0
                                                                                                    2.7
 -1.0                                                                                                                                (2.0)
                                                                                                           1.3             (0.3)
 -3.0
                           (13.0)
 -5.0
                                                                                           2.7

 -7.0                                                                 2.5
 -9.0

-11.0                                                     4.8
-13.0
         VIA Outlets      Value Retail                    GRI   Property operating   Net administration   Interest         Tax     Value Retail
          H1 2020          H1 2020                                     costs               costs                                    H1 2021

        Premium outlets H1 2020 -£7.4m

                                     1   At constant FX                                                                                            7
2021 half-year financial results
NTAPS walk

H1 2021 EPRA NTAPS walk (pence)

 90

 80
                                                    9
 70                                                                                                       3                1
 60

 50

 40             82
                                                                                                                                          69
 30

 20

 10

  0
                                                                       (1)
             Dec 2020                  Revaluation deficit                                          Scrip dividend   Loss on disposal   Jun 2021
             EPRA NTA                                                                                                                   EPRA NTA

                                   1    On a proportionally consolidated basis including Value Retail                                              8
2021 half-year financial results
Rent collection performance(1)
                                                                                                                                                                                                              slides 42-43

                     Total Demanded               Total Waived,                                   Total Due                                 Total Collected                           Total Outstanding   Collected of due
                        in Quarter                Written Off and                                                                                                                                          as at 30th July
                                                   Not Yet Due

                             £m                              £m                                          £m                                             £m                                  £m                   %

FY20                         261                             28                                        233                                             210                                  23                 90%

Q1 21                         58                             13                                          45                                             36                                   9                 79%

Q2 21                         54                               -                                         54                                             34                                   20                 64%

H1 21                        112                             13                                          99                                             70                                  29                 71%

Q3 21                        43(2)                            2                                          41                                             27                                   14                 65%

2021 YTD                     155                             15                                        140                                              97                                  43                 69%

  Collections:
  • Key priority to maximise income and collection rates in H2 2021, good progress made since 9 July
  • Trade receivables reduced in the UK as restrictions are lifted and concessions agreed, France and Ireland lagging at balance sheet date
  • Extension of moratorium on rental collection ‘inexplicable’

  Level of provisioning marginally increased from FY20:
  • Maintain a prudent provisioning approach, and limitations on collection powers in UK.
         • Provisions for arrears at 30 June 2021 £77m, 67% (31 Dec 20: £80m, 64%)
         • Provisions for tenant incentives at 30 June 2021 £55m, 24% (31 Dec 20: £68m, 22%)

                                              1    Excludes Value Retail
                                              2    Decline in total demanded in Q3 predominantly reflects disposal of retail parks portfolio to Brookfield completed on 19 May 2021                                          9
2021 half-year financial results
Portfolio valuation summary(1)
 Sector                   Value            H1 2021                 ERV & other                                  Yield                      Peak to                         ERV            Yield shift   Yield range
                        30 June             capital                     impact                                impact                          date                      decline                from         30 June
                           2021              return                                                                                       decline(2)                      from               peak(3)         2021(3)
                             £m                                                                                                                                         peak(2)

 Managed portfolio

   UK                    1,320              (13.4%)                            (6.7%)                          (6.7%)                           (60%)                     (29%)             +294bp      6.8% - 9.5%
   France(4)             1,023                 (4.2%)                          (2.0%)                          (2.2%)                           (25%)                        (4%)            +59bp      4.6% - 6.3%
   Ireland                     679             (6.6%)                          (0.3%)                          (6.3%)                           (28%)                     (14%)              +91bp      5.2% - 5.7%
 Total flagships         3,022               (8.9%)                          (3.7%)                         (5.2%)
 Developments &
 UK Other
                               574             (9.5%)                          (9.1%)                          (0.4%)

 UK RPs                    -                   (8.8%)                          (8.8%)                          -
 Managed
 portfolio
                         3,596               (9.0%)                          (4.6%)                         (4.4%)

 Value Retail            1,902                 (0.4%)                          (0.4%)                          -                                   (7%)
                                                                                                                                                                                                          slide 47-48
 Total                   5,498               (6.4%)                          (3.4%)                         (3.0%)

                                     1
                                     2
                                         At Hammerson share, translated at 30 June 2021 FX rate
                                         Like-for-like cumulative capital return since peak values (December 2017 – UK & France, December 2018 – Ireland, December 2019 – Value Retail)
                                                                                                                                                                                                                        10
                                     3   Nominal equivalent yield
                                     4   France includes Italik which has been reclassified to Trading properties as at 30 June 2021
2021 half-year financial results
Net debt analysis
Net debt analysis (£m)(1)
2,400
Adj. operating profit 62
2,300
Working capital
(14)
2,200 changes
2,100 Cash generated from
48
operations
2,000
396
1,900
50
1,800 2,234 77 103
1,700
48 13
1,829 1,879
1,600
1,500
1,400
Net
Netdebt
debt Disposals
(2)
Exchange and other Cash generated from Dividends Interest
(5)
Capital expenditure Net
Netdebt
debt
11Jan
Jan 2021
2021 flows
(3)
operations (4) 30
31Jun
Dec 2021
2020
1
2
On a proportionally consolidated basis, excluding Value Retail
Reflects net proceeds from the sale of eight retail parks portfolio, Espace St. Quentin and Nicetoile
11
3 Includes favourable foreign exchange translation of £80m
4 Includes withholding tax of £12m in relation to the 2020 interim dividend
5 Interest includes redemption costs of £14m and purchase of interest rate swap for £21m2021 half-year financial results
Debt maturity profile
Debt maturity profile - pro forma (£m)(1) (2) Refinancing achieved
1,200 Sterling Euro bonds
• €700m 1.75% 6 year sustainability-linked bond
bonds 1.8% avg
4.7% avg coupon
• 2022 bonds repaid (62% in H1, 38% on 8th July, €500m total)
coupon
• 2023 Euro bonds (53% repaid in H1, €265m)
New RCF(3)
1,000 Private Secured debt
placement 2.1% avg • £415m 2022 RCF refinanced (with two new facilities totalling £200m 3+1+1 year RCF)
2.4% avg coupon
coupon • Private placement notes due in June 2021 (£113m) repaid on maturity and 46%
800 (£184m) of notes prepaid at par
Revolving credit facilities
floating rate • O’Parinor JV debt (€55m at 25% share) refinanced with new €53m loan on 6th July
600
Liquidity position (£m)
400 £m
RCF – fully undrawn 1,030
Cash 587
200
Total liquidity 30 June 2021 1,617
July refinancing(2) (165)
0
2021 2022 2023 2024 2025 2026 2027 2028 2029 2030 2031 Pro forma liquidity 1,452
1 Proportionally consolidated debt, excluding Value Retail. Interest rates are on a weighted average basis, post hedging derivatives
2 Pro-forma for final €190m repayment of 2022 Euro Bonds and refinancing and €2m partial repayment of O’Parinor JV debt in July 2021 12
3 New 3+1+1 year RCF shown at current maturity, with options to extend, subject to lender consent, to 20262021 half-year financial results
Balance sheet metrics
slide 50
30 June 2021 31 Dec 2020
Net debt £1,879m £2,234m
Value Retail net debt £690m 0 £689m 0
Group debt Headroom Internal 30 June 2021 31 Dec 2020
covenants guidelines
Gearing(1) 1.75x 1.83x 1.89x
Interest cover(3) >1.25x 40% NRI decline >2.00x 2.08x 1.81x
LTV – incl. Value Retail net asset value(4) no covenants IG rating 40% 40%
LTV – fully proportionally consolidated(5) no covenants IG rating 47% 46%
Net debt/EBITDA(6) no covenants IG rating 15.1x 14.1x
1 Covenant within the Group’s unsecured bank facilities, bonds and private placement notes
2 2021 Covenant within the Group’s unsecured private placement notes only. Covenant was temporarily amended to 1.25x between June 2020 and June 2021, before reverting to 1.40x in October 2021 and 1.50x in December 2021 13
3 Covenant within the Group’s unsecured bank facilities and private placement notes
4 Loan excludes Value Retail net debt and value includes Value Retail net asset value
5 Includes Group’s share of Value Retail net debt and property values
6 EBITDA calculated on a 12 months rolling basis as at 30 June 20212021 half-year financial results
Modelling assumptions
UK rental levels: declining c.35% peak to trough (29% to date), France and Ireland more stable
Rent collections: rates continue to improve, absent further lockdowns, 80-90% by FY21 –
provisioning rates flat
Net admin costs: assume same run rate in H2, 15-20% savings to come in FY22-23
Value Retail: H2 earnings to exceed H2 20 (£5.9m) – assume no cash distribution
Finance costs: annualised run rate saving of £10m
FY 21 capex guidance: £100m, of which £64m in H2 21 (c.50% Cergy and Italik)
Dividends: assume further c.£210m of scrip by end of 2022 to cover REIT/SIIC obligations
14Strategy update
15
Martineau Galleries, BirminghamStrategy update
Future of Hammerson
Owner, operator, developer of focused, prime, urban estates
Indicative long-term core portfolio
Precarious capital structure Sustainable capital structure
Costly, complex organisation Agile, lean, streamlined platform
Complex, retail-only portfolio Reinvigorated mixed-use portfolio
Lack of focus on strategic
Accelerated development pipeline
opportunities
Department store Non fashion retail Fashion retail F&B and leisure Alternative use
16Strategy update
Existing asset footprint and structural shift in retail underpins our strategic choices
Area Strategic options
Disposals to focus
Scale Maintain status quo Consolidate
on core assets
Refocus / Enter logistics &
Mix Grow emphasis industrial
Re-enter office Enter lodging
rebalance
on residential at scale at scale
retail at scale
Footprint Concentrate footprint in set
Maintain status quo Enter new territories
of core urban estates
Model Develop, own,
Asset light Pure developer Financial investor
operate
17Strategy update
Covid-19 has accelerated existing structural change
DEMOGRAPHIC TRENDS CONSUMER TRENDS RETAIL TRENDS
Ageing population Value for money Polarisation of retail markets
Rise in single-person households Digitalisation Channel shift
Increased digital penetration Experience over things Evolving role of the store
Urbanisation Connected self Commercial model evolution
Changing consumer confidence Value of time Data & analytics
High and increasing avg. income Personalisation Importance of technology
Source: Accenture 18Strategy update
Prime urban retail has an important role to play in the omnichannel environment,
but reduction of space required
Forecasts for UK retail space reduction Encouraging re-opening sales despite restrictions
Low High
-6% -14%
Market CBRE Cushman & BNPP Savills
UK May & June France June overall
Net 16% Wakefield 30% 40% overall sales vs 2019 sales vs 2019
Vacancy (2021) 25-30% (2021) (2020)
14% (2019)
Physical sales & fulfilment remains key to profitability Role of physical space in omnichannel world
• c.70% of UK retail sales remain physical, c.80% in France & Ireland1 • Not only about legacy metrics, but also marketing and brand exposure
• Falling average retailer pre-tax profit margins in UK: • New technology = new metrics, comparable to online:
• Passing footfall = brand impressions
• Dwell time outside shopfront = click through
9.2% 5.5% 3.2%
2010-11 2019-20 2024-25 • Complementary to existing metrics:
• Conversion rates
• Customer acquisition costs
• Online costs rising through pandemic: delivery & fulfilment costs +20%;
fashion returns >40%; paid search +26%; social media +25% • Logistics returns costs
slide 40
19Strategy update
Hammerson today – high quality assets; strong locations; overexposed to fashion
and department stores
Asset quality by grade(1) Portfolio by city exposure(2) Portfolio mix by ERV and NIA(3)
Birmingham London Leeds Aberdeen
Other Value 7% 6% 3% 3% 1%
B Retail 7%
14%
17% Southampton By ERV
1% A++
B+ 3% 9% 6%
23%
20% Bristol 8%
26%
3%
By NIA
Reading
14%
2%
A- 79% of assets
10% graded A
A+ Leicester
15% Bicester 2% 28%
17% 19% 27% 41%
Glasgow
A
1%
31% Dublin
14% Paris
Marseille 12%
Black border indicates significant 10% Department store Fashion Non-fashion
JV/associate structures F&B / Leisure Other Vacant
Initial diagnosis stands: we will capitalise on the competitive advantage of the quality
and location of our core assets, with clear valuation upside from repositioning.
1 As at 30 June 2021, UK, Ireland and France flagships, and Value Retail. Source: Green Street Advisors database July 2021, quality grade, 20
weighted by value as of FY20, at Hammerson share
2 As at 30 June 2021
3 As at 30 June 2021, excluding Value RetailStrategy update
Positioning Hammerson as an owner, operator, developer of focused, prime,
urban estates
Deliver Accelerate
Create agile Reinvigorate
sustainable development
platform the assets
capital structure pipeline
• Disposals of non strategic • Flatter organisation • Generate incremental cash • Disciplined capital recycling
assets: • Automation and digitalisation flow to scale development
• reduce net debt • Build skill sets for the future • Optimise use of space – opportunities
• generate capital for • Speed to value/opportunity minimise void • Explore different models
reinvestment ready • Repurposing & redevelopment • Create holistic prime urban
• IG credit rating estates
• Disciplined capital allocation
• Simplify portfolio & platform - focus on core assets • Net positive/sustainability lens over all initiatives
Capital redeployment & value
Stabilisation & simplification
creation
21Strategy update
A sustainable capital structure remains a core near term priority
FY 20 HY 21
€700m
£834m rights Recycling
£403m of sustainability- Further
issue & VIA Refinancing capital
disposals linked bond disposals
disposal Refinancing
issued
Approach through the cycle:
• Focus on total return
• IG credit rating
• Balance LTV & net debt/EBITDA depending on
phasing of disposals and redeployment of capital
22Strategy update
Strategic repositioning of portfolio
Near term disposals Optimise to sell Core
• Minority stakes (lack of control) • Opportunities to create more • Prime city centre locations in most attractive catchments:
value prior to disposal
• Better off in the hands of others • >250k people within 15 minutes / 1 mile
• More liquid assets • Not the right time to sell • >1m people within 1 hr walk/cycle/public transport or car
• Non core for the business • Opportunities for remix/repurposing/development
• Income growth potential
• Ability to scale: asset value potential c.£1bn for some, with at least
three non-retail uses with potential for >£100m value each
• Opportunities to consolidate ownership
• Support from central / local public leadership and policy
NEAR-TERM DISPOSALS MEDIUM-TERM DISPOSALS
depending on market conditions depending on asset conditions
Market conditions and third party interest will drive
individual assets and portfolio disposals
23Strategy update
Create agile platform for the benefit of all stakeholders
AMBITION
Create an efficient & agile, fit for purpose organisation
Develop a more empowered, accountable culture - conducive to delivering speed to value
Current organisation Future organisation
Capable, recognised platform Flatter organisational structure
High commitment from teams Asset-centric operations
Centralised core functions
New senior leadership in place
Fill capability gaps and build expertise
High cost
Explore strategic partnerships
Fragmented operating model
Increase automation & digitalisation
Complex and bureaucratic
Renewed focus on cost discipline
Nascent automation and digital capability
Net admin costs reduced by 15-20%
24Strategy update
Significant value creation opportunities from reinvigorating current prime portfolio
Generate incremental income Lease up & shift mix Repurpose
• Commercialisation • Minimise void • Capital light & more intensive options
• Last mile delivery • Try new concepts • Alternative use: residential; workspace;
• Operating services lodging
• Digitalisation/Data • Target categories: F&B; leisure; culture; services
Opportunity in underutilised space(1)
• 2m sq ft UK department store space, 800k sq ft department store space vacant or in temporary leases: £3/sq ft ERV; £9/sq ft value
• Ten UK car parks; four in France; one in Ireland: c.47k spaces
• 1.9m sq ft UK MSU space; 540k sq ft French MSU space; 220k sq ft Irish
• c. 600k sq ft targeted for repurposing/new lettings in UK
1 At 100% 25Strategy update
Leasing highlights
slide 35-39
Prime brands
New anchors
F&B, leisure, grocery, services
Digitally - native
26Strategy update
Wide variety of scale development opportunities, yielding returns and upscaling
existing assets to neighbourhoods
Retail F&B Leisure Residential Workspace Hotel Education Culture
Public spaces
Outline Earliest (k sq ft) (k sq ft) (k sq ft) (units) (k sq ft) (beds) (k sq ft) (k sq ft)
Key schemes Area planning/ start on
policy site
Les 3 Fontaines, Cergy 8,400m2 on site on site 10 20 45
The Podium at Dundrum, Dublin 10,000m 2
2022 1 107
Near term
Victoria Hotel, Leeds 8,400m 2
On hold 205
25,600m2
St Peters Lane, Leicester 2021 2022 305
Residential Quarter, Reading TBC- 2022 TBC
Victoria Phase 2, Leeds 10 acres TBC 50 50 50 1000 540 200 55 50
Martineau Galleries, Birmingham 7.5 acres H2 2023 90 70 20 1300 1100 200 10
Medium to long term
Callowhill Court, Bristol 9 acres 2022 TBC
Dublin Central 6 acres 2021 H1 2023 60 40 94 475 210
Dundrum Village, Dublin 6 acres 2022 H2 2023
Pavilions Phase 3, Swords 18 acres 2023 TBC
Brent Cross 15 acres TBC TBC
Croydon 22 acres TBC TBC
The Goodsyard, London 10 acres 2024 120 75 500 1400 150 40
TOTAL 103 acres 6m sq ft 4.5m sq ft 1m sq ft
27Case study:
Birmingham Estate
28Strategy update
Evolution of Hammerson: retail-centric assets to mixed use estates
Indicative evolution of identified core portfolio mix by NIA
Core portfolio by current mix Indicative mid-term core portfolio Indicative long-term core portfolio
Department store Fashion retail Non fashion retail F&B and leisure Alternative use
29Strategy update
Summary and priorities – Hammerson at inflection point
Clear direction of travel: owner, operator, developer of focused, prime, urban estates
H1 21 progress: Near-term priorities: Looking ahead:
• Balance sheet strengthened: • Disposals to reduce debt • Sustainable capital structure
• net debt reduced; • IG credit rating
• refinancing achieved • Create agile platform
• cost reduction 15-20% • Focus on core - simplify the
• Business transformation underway: portfolio
• new leadership in place • Improve rent collection
performance • Maximise existing and incremental
• Improving operational performance: cash streams
• rent collection up; • Maintain leasing momentum
• encouraging leasing volumes • Commence recycling of capital to
& pipeline value creation opportunities
• Seek options to accelerate scale
development pipeline
30Questions
Dundrum, DublinAdditional disclosure
32
Cabot Circus, BristolContents
Managed portfolio
Net Positive
Value Retail
33Managed portfolio
34
The Oracle, ReadingAdditional disclosure: Managed portfolio
Leasing cumulative activity – managed portfolio
H1 2021 managed portfolio leasing and cumulative vs. H1 2020 and H1 2019 (£m) Leasing volumes H1 21 H1 20
£m £m
5 12
UK 4.3 2.7
4.5
10 France 5.1 1.4
4
3.5 Ireland 0.4 0.3
8
3
Total 9.8 4.4
2.5 6
2
4 UK retail parks 1.2 1.6
1.5
1 UK other 0.2 0.5
2
0.5
Managed portfolio 11.2 6.5
0 0
March
May
February
January
June
April
Monthly leasing H1 2021 (LHS) Cumulative leasing activity 2019 (RHS)
Cumulative leasing activity 2020(RHS) Cumulative leasing activity 2021 (RHS)
1 Monthly leasing LHS axis, cumulative leasing RHS axis 35Additional disclosure: Managed portfolio
Leasing cumulative activity – UK flagships
H1 2021 UK flagships leasing and cumulative vs. H1 2020 and H1 2019 (£m) H1 2021
leasing
5 5 £m
4.5 4.5
Principal leasing 2.5
4 4
3.5 3.5
Reconfigurations 0.5
3 3 Flexible and other 1.3
2.5 2.5
Total 4.3
2 2
1.5 1.5
1 1
0.5 0.5
UK flagships leasing key facts(1)
0 0 Leasing vs. Dec 20 ERV -24%
March
May
February
January
June
April
Leasing vs. previous passing -26%
Monthly leasing H1 2021 (LHS) Cumulative leasing activity 2019 (RHS) Average lease term: 8 years(2)
Cumulative leasing activity 2020 (RHS) Cumulative leasing activity 2021 (RHS)
Average incentive: 11 months(2)
1
2
Principal leases only
FY 2020: average lease term 6 years, average incentive 5 months
36Additional disclosure: Managed portfolio
Leasing cumulative activity – France flagships
H1 2021 France flagships leasing and cumulative vs. H1 2020 and H1 2019 (£m) H1 2021
leasing
£m
1.2 4.5
Principal leasing 4.0
4
1.0
Reconfigurations 0.5
3.5
Flexible and other 0.6
0.8 3
Total 5.1
2.5
0.6
2
0.4 1.5
France flagships leasing key facts(1)
1
0.2 Leasing vs. Dec 20 ERV 3%
0.5
Leasing vs. previous passing 0%
0.0 0
Average lease term: 10 years(2)
March
April
May
February
January
June
Average incentive: 2 months(2)
Monthly leasing H1 2021 (LHS) Cumulative leasing activity 2019 (RHS)
Cumulative leasing activity 2020 (RHS) Cumulative leasing activity 2021 (RHS)
1
2
Principal leases only
FY 2020: average lease term 7 years, average incentive 1 months
37Additional disclosure: Managed portfolio
Leasing cumulative activity – Ireland flagships
H1 2021 Ireland flagships leasing and cumulative vs. H1 2020 and H1 2019 (£m) 2021 leasing
£m
0.1 1.2
Principal leasing 0.1
0.1
1 Reconfigurations 0.1
0.1
Flexible and other 0.2
0.1 0.8
Total 0.4
0.1
0.6
0.0
0.0 0.4
Ireland flagships leasing key facts(1)
0.0
0.2 Leasing vs. Dec 20 ERV 16%
0.0
Leasing vs. previous passing 72%
0.0 0
Average lease term: 9 years(2)
March
April
May
February
January
June
Average incentive: 4 months(2)
Monthly leasing 2021 (LHS) Cumulative leasing activity 2019 (RHS)
Cumulative leasing activity 2020 (RHS) Cumulative leasing activity 2021(RHS)
1
2
Principal leases only
FY 2020: average lease term 6 years, average incentive 2 months
38Additional disclosure: Managed portfolio
Leasing analysis by type – flagships
UK France Ireland
% vs previous % vs previous % vs previous
£’000s % vs ERV £’000s % vs ERV £’000s % vs ERV
passing passing passing
Principal 2,470 -26% -24% 3,958 0% 3% 119 72% 16%
Other 1,873 -76% -76% 1,125 -49% -28% 263 -75% -80%
Total 4,343 -53% -63% 5,083 -13% -5% 382 -38% -72%
UK France Ireland
% vs previous % vs previous % vs previous
£’000s % vs ERV £’000s % vs ERV £’000s % vs ERV
passing passing passing
Fashion 2,446 -47% -57% 2,596 -15% 0% 114 -79% -89%
Non Fashion 1,479 -68% -70% 2,079 -6% -12% 266 60% -6%
F&B 418 -54% -58% 408 -23% -1% 2 n/a -97%
Total 4,343 -53% -63% 5,083 -13% -5% 382 -38% -72%
39Additional disclosure: Managed portfolio
White box leasing – new metrics relevant to digitally-native brands
Use of physical space is evolving in omnichannel world
• Hammerson “white boxing” initiatives encouraging digitally native
brands into physical space
• Not only about legacy metrics, e.g. sales and OCRs, but also
marketing and brand exposure
• New technology, e.g. AI in CCTV, is allowing development of new
metrics, comparable to online:
• Passing footfall = brand impressions
• Dwell time outside shopfront = click through
First store outside of London for omnichannel retailer of rare sneakers
• Complementary to existing metrics:
Additional 9% footfall in store zone in first week
• Conversion rates
3.5p cost per walk by / brand impression
• Customer acquisition
15% of passing visitors entered store
• Logistics returns costs
3x footfall/sq ft of neighbouring leading brands
High average basket size
Cost of acquisition only 3% of sales
40Additional disclosure: Managed portfolio
LfL NRI analysis - flagships
H1 2021 LfL NRI analysis Ireland flagships Total
UK flagships France flagships
(2.7%
Surrender Premiums 27.0% 6.2%
)
16.7%
(7.8%
Provision for incentives and arrears(1) 15.2% 9.9%
)
9.2%
(0.9%
Other 2.1%
)
0.7% 1.3%
(2.8%
Variable income (5.5%) 1.4%
)
(3.6%)
(10.8 (0.6% (0.3%
Tenant failure (CVAs/Administrations) %) ) )
(6.7%)
(13.7
Leasing and void costs %)
2.0% 4.1% (6.9%)
(12.0 (4.2% (8.2%
Concessions %) ) )
(9.8%)
Total LfL NRI (£m) £41.5m £13.8m £12.4m £67.7m
Change LfL (%) +2.3% +13.6% -17.0% +0.1%
Change LfL (£m) +£0.9m +£1.7m -£2.5m +£0.1m
1 Excludes provisioning for arrears from tenants subject to CVA or administrations which have been included in the tenant restructuring category 41Additional disclosure: Managed portfolio
Rent collection performance - flagships
UK France Ireland
Collected at 31 July Collected at 31 July Collected at 31 July
(%) (%) (%)
FY20 91 93 83
Q1 21 92 67 64
Q2 21 71 43 66
H1 21 79 56 65
Q3 21 67 60 67
2021 YTD 76 57 65
42Additional disclosure: Managed portfolio
Provisions for arrears – managed portfolio
H1 2021 provisions vs FY 2020
Provision as % Provision as %
Net trade Change since Change since
Provisions at Provisions at of net trade of net trade
receivables 31 December 31 December
30 June 2021 31 Dec 2020 receivables receivables
at 30 June 2021(1) 2020 2020
at 30 June 2021 at 31 Dec 2020
£m £m £m £m % % ppts
UK 64.1 42.1 53.1 -11.0 66 65 +1
France 34.9 24.4 18.9 +5.5 70 66 +4
Ireland 15.9 10.9 7.8 +3.1 69 53 +16
Managed
114.9 77.4 79.8 -2.4 67 64 +3
portfolio
1 Net of VAT and deposits 43Additional disclosure: Managed portfolio
Tenant restructuring – leases in CVA/admin as at 30 June 2021
UK France Ireland UK Group NRI LfL impact of CVAs & admins (£m)
flagships flagships flagship other
H121 FY20 FY19
5
Passing rent impact of (0.6) (0.2) - - (0.8)
new units in CVA/admin 0
in H1 21(£m)
(5)
Number of units in 132 31 n/a 12 175
CVA/admin (10)
as at 30 June 2021
(15)
Passing rent subject to 5.1 2.1 n/a 0.3 7.5
CVA/admin as at (20)
30 June 2021 (£m)
(25)
% of Group passing rent 2.2% 0.9% n/a 0.1% 3.3%
as at 30 June 2021(1) (30)
(35)
(40)
UK flagships France flagships Ireland flagships UK Retail Parks
1 Group passing rent £227.3m 44Additional disclosure: Managed portfolio
Top 20 tenants exposure(1)
Rental Rental
% of passing % of passing
Retailer Exposure % of NIA Retailer Exposure % of NIA
rent rent
(£m) (£m)
Inditex 8.1 3.6% 2.7% TK Maxx 2.3 1.0% 1.6%
H&M 6.1 2.7% 2.5% Superdry 2.3 1.0% 0.6%
Next 4.5 2.0% 4.5% Signet 2.2 1.0% 0.2%
Boots 3.7 1.6% 1.3% Apple 2.1 0.9% 0.4%
Watches of Switzerland
JD Sports 3.3 1.4% 0.8% 2.0 0.9% 0.2%
Company
CK Hutchison Holdings 3.0 1.3% 0.7% Natl Amusements (UK) 1.9 0.8% 1.5%
River Island Clothing Co 2.9 1.3% 1.0% McDonald's 1.7 0.8% 0.5%
Marks & Spencer 2.9 1.3% 3.2% Etam Group 1.5 0.7% 0.2%
France Printemps (Borletti) 2.5 1.1% 1.8% Debenhams 1.5 0.7% 2.1%
John Lewis PLC 2.4 1.1% 6.5% Freedom Sportsline 1.4 0.6% 0.3%
Total 58.5 26% 33%
1 Ranked by passing rent as at 30 June 2021 45Additional disclosure: Managed portfolio
Top ten occupiers by region(1)
UK France Ireland
Rental % of Rental % of
Rental % of
Retailer exposure passing % of NIA Retailer exposure passing % of NIA
Retailer exposure passing % of NIA
(£m) rent (£m) rent
(£m) rent
Inditex 4.4 1.93% 1.60% Printemps 2.5 1.12% 1.83% Inditex 1.9 0.84% 0.39%
Next 3.6 1.60% 4.12% Inditex 1.8 0.79% 0.70% River Island 1.7 0.73% 0.24%
H&M 3.5 1.53% 1.78% H&M 1.8 0.78% 0.42% Marks & Spencer 1.1 0.49% 0.82%
Boots 3.0 1.32% 1.12% Etam Group 1.5 0.67% 0.22% Primark 0.9 0.39% 0.35%
John Lewis PLC 2.4 1.05% 6.53% C&A Europe 1.2 0.52% 0.51% Next 0.9 0.39% 0.34%
JD Sports 2.3 1.03% 0.60% Rallye 1.0 0.44% 0.42% H&M 0.8 0.37% 0.30%
Signet 2.1 0.93% 0.22% FNAC Group 0.9 0.39% 0.63% Boots 0.7 0.33% 0.19%
CK Hutchison Holdings 2.1 0.92% 0.55% Monoprix 0.9 0.38% 0.28% TK Maxx 0.7 0.32% 0.51%
Watches of Switzerland 2.0 0.90% 0.20% Grand Vision 0.8 0.37% 0.16% JD Sports 0.6 0.25% 0.15%
Natl Amusements (UK) 1.9 0.83% 1.55% Happy Chic 0.8 0.33% 0.10% Staunton Sports 0.6 0.25% 0.19%
Total 27 12% 18% Total 13 6% 5% Total 10 4% 3%
1 As at 30 June 2020 46Additional disclosure: Managed portfolio
Valuation data (net initial & nominal equivalent yields)(1)
NIY (%) UK flagships France flagships Ireland flagships UK other Managed portfolio(2)
30 June 2021 6.7 4.3 4.9 5.3 5.5
31 Dec 2020 6.6 4.4 4.6 6.2 5.7
30 June 2020 5.9 4.3 4.6 5.9 5.4
Change 6m (pp) 0.1 -0.1 0.3 -0.9 -0.2
Change 12m (pp) 0.8 0.0 0.3 -0.6 0.1
NEY (%) UK flagships France flagships Ireland flagships UK other Managed portfolio(2)
30 June 2021 7.8 5.0 5.3 9.4 6.4
31 Dec 2020 7.3 4.9 5.0 9.0 6.3
30 June 2020 6.6 4.7 4.7 8.6 5.9
Change 6m (pp) 0.5 0.1 0.3 0.4 0.1
Change 12m (pp) 1.2 0.3 0.6 0.8 0.5
1
2
Yields as reported at period end, i.e. not like for like
Total portfolio for 31 December 2020 and 30 June 2020 include Retail Parks
47Additional disclosure: Managed portfolio
Valuation data (ERV)
ERV (£m) UK flagships France flagships Ireland flagships UK other Managed portfolio(2)
30 June 2021(1) 122.0 59.6 37.4 9.9 228.9
31 Dec 2020(1) 132.4 62.9 39.0 10.0 279.7
30 June 2020(1) 144.2 64.7 42.0 10.2 299.3
LfL change 6 months (%) -6.8 -0.3 -1.1 -3.5 -4.1
LfL change 12 months (%) -14.4 -1.0 -4.4 -5.3 -9.3
1
2
ERVs as reported at period end, i.e. not like for like
Total portfolio ERVs for 31 December 2020 and 30 June 2020 include Retail Parks
48Additional disclosure: Managed portfolio
Key disposals achieved 2019 – 2021 YTD
NIY Gross proceeds Buyer
(%) £m
2019:
Dallow Road, Luton 7.6 24 Private equity
Italie Deux, Paris (75%) 4.1 363 AXA
Abbotsinch, Paisley 7.8 67 Ashby Capital
St Oswald's Retail Park, Gloucester 8.5 54 Local authority
Parc Tawe, Swansea 4.7 22 Private investor
2020:
Abbey, Belfast 8.4 33 Slate Asset Management
SQY Ouest n/a 10 Société des Grands Magasins
Retention of exchange deposit for portfolio of retail parks n/a 21 Orion European Real Estate Fund V
VIA 6.5 277 APG
2021 YTD:
Brent South Shopping Park 6.2 22 London Borough of Barnet
Nicetoile 5.8 23 Allianz
Espace Saint Quentin 8.5 28 Allianz
Retail parks portfolio 8.6 330 Brookfield
Total 2019 – 2021 YTD(1) 1,288
1 Total annual gross proceeds (includes ancillary disposals): 2019 - £542m, 2020 - £343m, 2021 YTD (30 June 2021): £403m
49Additional disclosure: Managed portfolio
LTV methodology
30 June 2021 31 December 2020
With Value Fully proportionally consolidated With Value Fully proportionally consolidated
Retail net asset (£m) Retail net asset (£m)
Net debt value (£m) value (£m)
Managed portfolio 1,879 1,879 2,234 2,234
Value Retail - 690 - 689
Loan 1,879 2,569 2,234 2,923
Property values
Managed portfolio 3,596 3,596 4,414 4,414
Value Retail - 1,902 - 1,924
Value Retail net assets 1,130 - 1,154 -
Value 4,726 5,498 5,568 6,338
LTV 40% 47% 40% 46%
50Additional disclosure: Managed portfolio
Maintenance capex 2018- H1 2021: Flagships
H1 2020 2019 2018
2021
Service charge (maintenance)
Service charge income (£m) 24 55 69 73
Maintenance expenditure within service charge (£m) 3.5 13 13 13
Examples:
Painting, flooring upkeep, M&E: CCTV, wifi , IT systems maintenance
Capital expenditure
Gross rental income (£m) 102 229 282 306
Capital expenditure – no additional area (£m) 8 17 16 53
Yield on cost from capital expenditure – no additional area 0 0 3 6
(%)
Capital expenditure – no additional area: gross rental income (%) 8 7 7 17
Examples:
Income accretive: Repurposing and reconfiguration, recladding, CCTV upgrade, digital screens
Other (partly recoverable from tenants): Wayfinding projects, WC upgrades, LED relamping, seating upgrades, family rooms, smart metering
51Net Positive
Our Sustainability                   2021 Half year update
Vision:                              Operations remain affected by COVID-19 but strong sustainability platform has supported
                                     efficient operation and delivery of two key projects. We are continuing to focus on
To create retail destinations that   delivering against out Net Positive carbon, water, waste and social impact targets through
deliver net positive impacts         efficiencies and investment in technology and innovation projects and through our strong
                                     relationships with community organisations.
economically, socially and
environmentally
                                     Key projects delivered
Positive Places is our strategy
for making that happen               • the connection of Les Terrasses du Port to the Thassalia geothermal system
                                     • the successful launch of our sustainability linked bond (SLB)

                                     EPRA LFL Portfolio (unit)             H1 2021        H1 2019      % Change         2021
                                                                                                                       Target
                                     Energy demand (MWh)                       33,710        40,505          -17%           -8%

                                     Carbon emissions (mtCO2e)                  6,442          9,101        -29%           -17%

                                     Water demand (‘000m3)                        108           183          -41%           -7%

                                                                                                                                  53
Additional disclosure: Net Positive
Sustainability-linked bond
Issued in June 2021 and confirmed as being beyond business as usual and Paris aligned, our sustainability-linked bond (“SLB”) links ambitious Scope 1,2 and 3 targets to financing without restricting our use
of proceeds. This was the first SLB to be issued by a real estate company and reaffirms the strength of our sustainability strategy.
KPI 1 – Absolute Emissions KPI 2– Absolute Emissions
16,000 80,000 71,742
14,000 13,357 70,000
12,000 60,000
10,000 50,000
8,000 40,000
6,000 5,343
30,000 35,527
4,000 20,000
60% reduction versus 50% reduction versus
2,000 2019 Baseline 10,000 2019 Baseline
0 0
2019 2020 2021 2022 2023 2024 2025 2019 2020 2021 2022 2023 2024 2025
BAU Scope 1, 2 & selected Scope 3
KPI 1 - Hammerson Scope 1, 2 & selected Scope 3 targets BAU Scope 3 tenant emissions KPI 2 Hammerson Scope 3 tenant emissions targets SPT 2
Sustsainability Performance Target 1
Performance to date:
During H1 2021, Scope 1 and 2 emissions for this portfolio* have fallen by 10% v 2020 and 36% v 2019 baseline. These reductions are significantly influence by the closure of assets during the pandemic. However we are
continuing to invest in energy efficiency measures and our procurement strategy and expect to revert to a more normal downwards trend in 2022. Scope 3 emissions performance will be calculated at year end. However, 50
units have been fitted out in accordance with our energy efficiency standards in H1 2021 and environmental data sharing clauses included in new leases as standard.
If these targets are not met, an additional margin will be payable of 37.5 basis points per annum for the last year of the bond between June 2026 to the June 2027 maturity date for each of the two targets, 75 basis points in
total, payable at the final interest payment date.
Notes: Emissions forecasts are location based and reflect a Steady Progress Future Energy Scenario
BAU reflects only forecast grid carbon emissions reductions for GB, Ireland and France, provided by Aurora Energy Research reflecting an adapted Steady Progress Future 54
Energy Scenario. It excludes any corporate carbon reduction activities.
The portfolio includes all assets under Hammerson ownership during the reporting period at equity share. The same portfolio is reflected in each trajectoryValue Retail
55Additional disclosure: Value Retail
H1 2021 operational update
30 June 30 June Change Value Retail value creation (£m)
2021(1) 2020(1)
Brand sales (£m) 626 585 +7%
Footfall (m) 8.5 8.8 -3%
Sales density (£/m2)
1,200 9 year IRR - 18%
3.1 3.3 -4%
Like-for-like NRI (£m) 24.9 16.8 +48% 1,000
Occupancy (%) 95.3 94.7 +0.6%
800
950
600
1,107
400 (147)
280
(190)
200
214
0 (2)
NAV Jan-12 Capital invested Distributions - Distributions - Valuation uplift NAV Jun-21
operating refinancing
1
2
With the exception of like-for-like net rental income growth, figures reflect overall portfolio performance, not Hammerson’s ownership share
Premium outlets NAV as at 30 June 2021 includes liabilities in respect of distributions received in advance of £23m which will be repayable upon disposal of stakes in Value Retail
56Additional disclosure: Value Retail
Tiered European outlet market
Sales densities €/m2
€30,000+ International fashion and
luxury brands
€2,000–€10,000
Mainstream fashion brand outletsAdditional disclosure: Value Retail
Value Retail villages
Bicester Village, Oxford
GLA: 28,100m2
Boutiques: 163
La Roca Village, Barcelona
GLA: 25,900m2
Boutiques: 148
Las Rozas Village, Madrid
GLA: 16,600m2
Boutiques: 100
La Vallée Village, Paris
GLA: 21,600m2
Boutiques: 105
Maasmechelen Village, Brussels
GLA: 20,000m2
Boutiques: 100 Portfolio value
Fidenza Village, Milan
GLA: 21,100m2
Boutiques: 116
£1.9bn
Wertheim Village, Frankfurt
GLA: 21,200m2
Boutiques: 118
Ingolstadt Village, Munich
GLA: 21,000m2
Boutiques: 114
Kildare Village, Dublin
GLA: 16,200m2
Boutiques: 97
58Additional disclosure: Value Retail
Hammerson’s total investment in Value Retail
Holding companies 25%
equity
Las Rozas La Vallée Maasmechelen Wertheim Ingolstadt Kildare
Bicester Village La Roca Village Fidenza Village
Village Village Village Village Village Village
37 29 25 14 14 22 33 2 29
50 41 38 26 27 34 45 15 41
Village ownership
via LPs (%)
Total Village
ownership (%) (1)
1 Total Village ownership calculated as economic entitlement of directly held and indirectly held interests 59Additional disclosure: Value Retail
Absolute sales growth delivered through active management,
acquisitions and extensions
Sales and Sales Growth 2012 – 2021 (€m)(1)
3,500
+9%
+8%
3,000 +8%
+8%
2,500 +11%
+11%
+12%
2,000 -45%
+13%
1,500
1,000 +7%
500
0
2012 2013 2014 2015 2016 2017 2018 2019 2020 2021
H1 Sales H2 Sales
1 Figures have been restated at constant FX rates
60You can also read