AMERICAN EXPRESS OPEN INDEPENDENT RETAIL INDEX - THE A STUDY OF MARKET TRENDS IN MAJOR AMERICAN CITIES
←
→
Page content transcription
If your browser does not render page correctly, please read the page content below
THE
AMERICAN EXPRESS OPEN
INDEPENDENT RETAIL INDEX

               A STUDY OF MARKET TRENDS
                 IN MAJOR AMERICAN CITIES

                                OCTOBER 2011
The American Express OPEN Independent Retail Index

                                                                                  Table of Contents
INTRODUCTION ................................................................................................................................................................................. 2
ESSENTIAL FINDINGS ....................................................................................................................................................................... 2
   In the Nation ..................................................................................................................................................................................... 2
   In Cities and Neighborhoods ............................................................................................................................................................ 2
BACKGROUND TO THE STUDY ........................................................................................................................................................ 3
   Small Business Saturday .................................................................................................................................................................. 3
   Previous Civic Economics Studies.................................................................................................................................................... 3
   The Genesis of the OPEN Index....................................................................................................................................................... 3
METHODOLOGY................................................................................................................................................................................. 4
   Dataset ............................................................................................................................................................................................. 4
   Indexing............................................................................................................................................................................................ 5
THE OPEN INDEX NATIONALLY: DISCUSSION AND CHARTS ........................................................................................................ 6
THE OPEN INDEX AMONG STUDY CITIES: DISCUSSION AND CHARTS ..................................................................................... 12
A LOOK AT THE LOCALIZED ANALYSES ........................................................................................................................................ 22
   Locations of Successful Districts .................................................................................................................................................... 24
   Evolution of Successful Districts ..................................................................................................................................................... 26
   Sales Trends .................................................................................................................................................................................. 28
   Economic Benefits of Independent Business Districts .................................................................................................................... 29
CONCLUDING THOUGHTS .............................................................................................................................................................. 32
CONTACTS ....................................................................................................................................................................................... 33

                                                                                                                                                                                                   1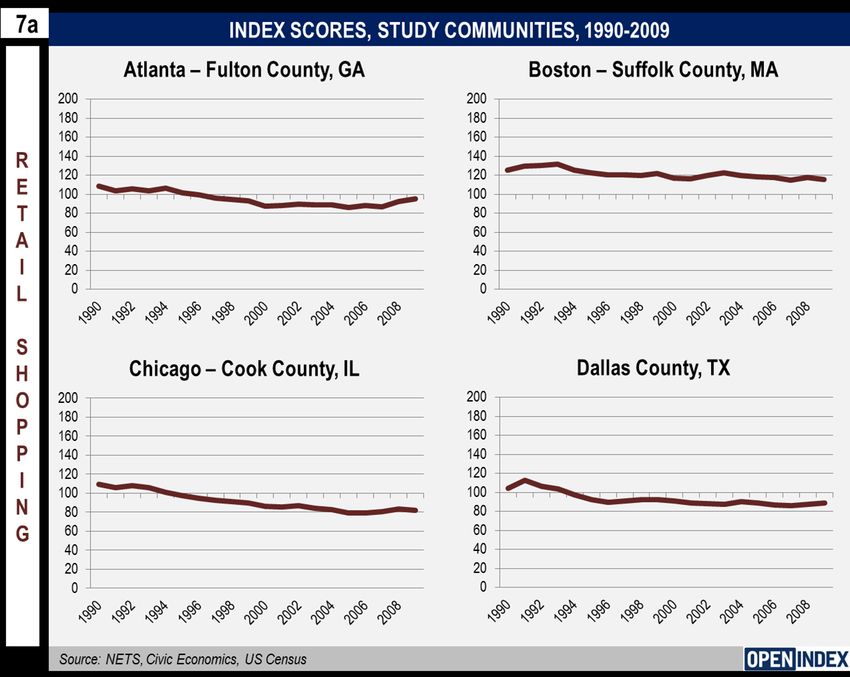
The American Express OPEN Independent Retail Index
INTRODUCTION
Civic Economics is pleased to present the American Express OPEN Independent Retail Index, a study of market trends in Retail
Shopping and Eating & Drinking nationwide and in 15 major American cities.
The Index is the first longitudinal market share study, charting the success of independent, local proprietors over a 20-year period,
from 1990 to 2009. The Index provides localized analysis of those trends in fifteen major cities, identifies local independent hot
spots, and reviews trends in those neighborhoods to identify both the source and the impact of those successes.
ESSENTIAL FINDINGS
In the Nation
Among Retail Shopping establishments at the national level, the market share captured by locally-owned independent
businesses declined from 59% in 1990 to 48% in 2009. For Eating & Drinking, independent market share declined from 71%
to 64% over the same period.
In Cities
In Cook County, Illinois (Chicago), independents lost 13% of the market in Retail Shopping. Other cities with striking losses in
independent retail market share include Minneapolis, San Francisco, and Washington. Boston independent retailers lost the
least market share, at 5%, followed closely by Atlanta and Miami at 6%.
Independent restaurants and bars lost smaller market shares across the board. In San Francisco, independent Eating &
Drinking establishments actually registered a small gain in market share during the study period.
In Neighborhoods
Among 27 independent dominated business districts studied, the average district employed over 1,800 workers in urban,
close in, or suburban neighborhoods.
Residential neighborhoods served by a successful independent business district gained, on average, 50% more in home
values than their citywide markets over the most recent 14 year period.
2
The American Express OPEN Independent Retail Index

BACKGROUND TO THE STUDY

Small Business Saturday

In 2010, American Express OPEN introduced Small Business Saturday, providing a counterpart to the well-known Black Friday and
Cyber Monday shopping events that occur over Thanksgiving weekend. OPEN supported Small Business Saturday with discounts,
advertising, social media, and charitable giving, and produced strong results and widespread consciousness of the benefits of
supporting small business. For 2011, OPEN has expanded those commitments and commissioned this study to (1) add to our
understanding of the context and impact of independent business and (2) establish a baseline for measuring success in the future.

Previous Civic Economics Studies

Since 2002, Civic Economics has conducted a series of studies of the impact of independent retailers, restaurateurs, and
wholesalers on their local economies. Studies in Austin, Chicago, San Francisco, Phoenix, Grand Rapids, and New Orleans have
consistently affirmed that independent storefront businesses generate greater local economic activity, based on both revenue and
shop size, than do their chain competitors. In 2010, Civic Economics worked with the American Booksellers Association to produce
the Indie City Index, which ranked every American metropolitan area based on the share of the retail market captured by
independents in 2009. These studies and others are available for download at www.CivicEconomics.com.

These studies have provided the analytical underpinning for a national movement to support independents, and many of the
organizations involved in those efforts at the local and national level have also endorsed Small Business Saturday.

The Genesis of the American Express OPEN Independent Retail Index

American Express OPEN began discussing with Civic Economics the prospect of producing a study in conjunction with the 2011
Small Business Saturday event to help further raise awareness about the importance of supporting independent, locally-owned
businesses. OPEN asked us to craft a study design that adds to the national understanding of the market forces impacting
independents, identifies locations and sectors in which independents have achieved unusual success, and identifies the impact of
those successes.

The Index is designed to meet those requirements by measuring independent market share in retail and restaurant sectors over a
20-year period, both at the national level and at the local level in 15 major American cities. At the local level, the Index drills down to
identify specific areas of each city that have nurtured particularly successful independent business communities, then seeks out the

                                                                                                                                      3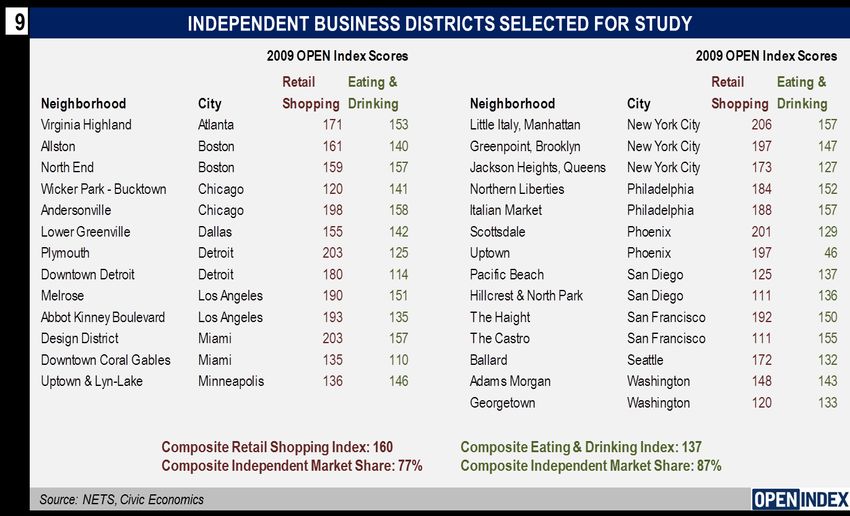
The American Express OPEN Independent Retail Index

impacts of these communities. Those localized studies are summarized here and provided in separate City Supplement documents
available at SmallBusinessSaturday.com.

METHODOLOGY

To construct the Index, Civic Economics designed a methodology that allows a thorough review of Retail Shopping and Eating &
Drinking activity over a 20-year period. The study is built upon the most comprehensive business dataset available, the National
Establishment Time-Series Database. NETS is built from the extensive business dataset compiled by Dun & Bradstreet (D&B), a
rolling list of businesses, including location, revenue, and employment, and related businesses. The Edmond Lowe Foundation and
Walls & Associates have constructed an extraordinary resource by compiling annual D&B snapshots into a longitudinal database
stretching back to 1990.

Dataset

For this study, Civic Economics procured from Walls & Associates a highly targeted
subset of NETS, comprised of 1.4 million establishments (an establishment is a single
storefront location) in most retail and food and beverage sectors. Each of those
businesses operated at least one year in at least one of the counties used to produce
a representative sample of the American retail marketplace. The sample was
comprised of 145 counties. Fifteen cities were identified in advance as the focus of
this study, including a total of 19 counties. The remaining counties were randomly
selected within six groups defined by population and metropolitan area status. To
produce a representative national sample for benchmarking purposes, Civic
Economics weighted county data twice: once within the population groups and again
among the population groups. The size of the sample, nearly 20% of the national
population, and provides a valid basis for analysis. The stratified weighting within the
sample allowed the development of a representative national benchmark.

For the 1.4 million establishments in the dataset, Civic Economics undertook a labor-
intensive review process to label each as either local or nonlocal. Locally-owned
businesses with multiple outlets confined to a metropolitan area or with few branches
elsewhere in the state were labeled local, as were cooperative retailers, authorized
retailers, and many charitable businesses.         D&B also includes non-employer

                                                                                                                           4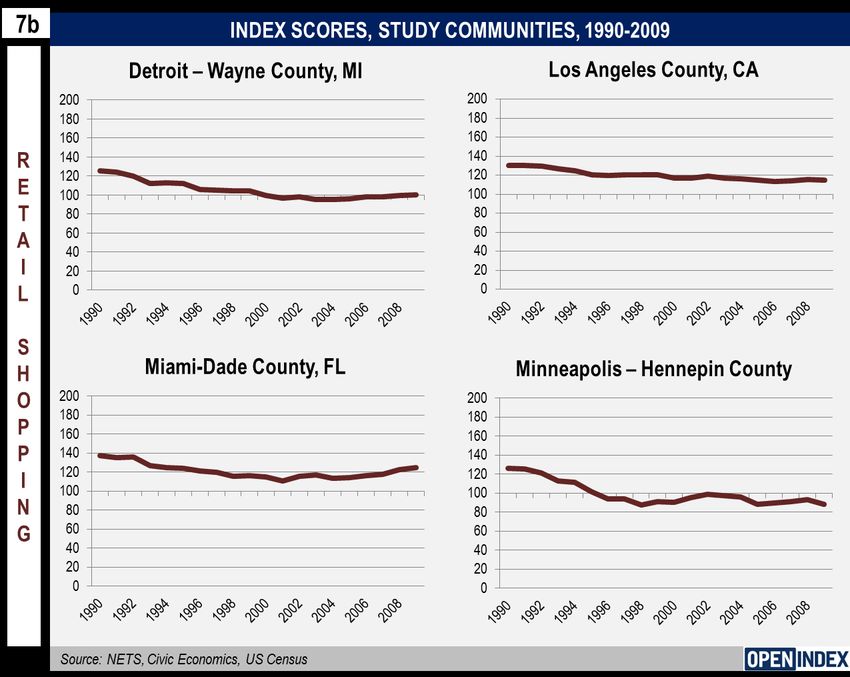
The American Express OPEN Independent Retail Index

establishments, in which only proprietors work, a class of business not included in standard Census data.

Roughly 90% of all businesses in the database were identified as independents.

Civic Economics further refined the data by identifying anomalous or clearly erroneous data points. Any large dataset will contain
errors, and NETS is no different. Our extensive review of the data convinces us that errors are random and generally typographical,
so in aggregate the data will reflect reality. For this study, though, Civic Economics isolated portions of the dataset by geographic
boundaries, lines of goods, and ownership status. Within those smaller sets, we identified erroneous sales, employment, or location
data wherever possible and incorporated corrections based on surrounding data points. With that in mind, the most useful way to
view this document, particularly at the local level, is to understand trends and comparisons over time. Precise sales and employment
figures are rarely given at this detailed level.

Indexing

The analyses described above allowed Civic Economics to quantify the market share captured by independents for each year and
each subsector in the study. For retail shopping overall, that market share declined from 59% in 1990 to 48% in 2009. For eating
and drinking, that market share declined from 71% to 64% over the same period. Because this study is concerned more with trends
than raw data, Civic Economics converted all market shares to an Index score based on 2009 outcomes. Therefore, an Index score
of 100 for Retail Shopping represents a 48% market share while 100 for Eating & Drinking represents a 64% market share. Charts 1
and 3 below demonstrate the simplicity of the conversion. Since 1990 the trend, as expected, is that independent businesses have
lost market share to national retailers. Therefore when examining the Index it is expected that, on average, Index scores will be
higher for 1990 and trend slowly downward toward 2009.

                                                                                                                                5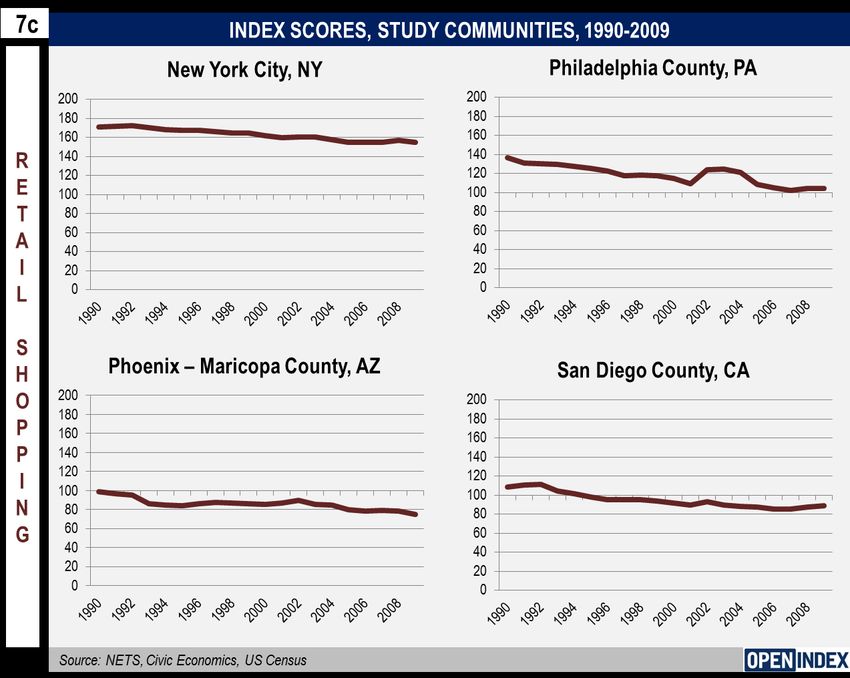
The American Express OPEN Independent Retail Index
THE OPEN INDEX NATIONALLY: DISCUSSION AND CHARTS
Charts 1 through 4 below present Index scores by sector for Retail Shopping and Eating & Drinking and subsectors within each
defined by lines of goods or level of service.
Retail Shopping Items of Note
In several retail subsectors, encouraging trends emerge. Grocery shopping, for example, has shown relatively stable Indexes
over the study period, including a modest uptick in the last decade. Clothing stores have also staged a healthy rebound in recent
years.
Furniture stores and the sector that includes sporting goods, books, music, and hobby shops have sustained high index scores
throughout the study period.
Building materials stores show the steepest and most consistent decline over the years, which is no surprise to followers of the
industry. The study period corresponds with the massive expansion of large format home centers as well as the acquisition by
national firms of countless local suppliers. However, it is noteworthy that, even in the face of such trends, independents ha ve
retained nearly half of the market.
The General Merchandise sector, which includes large discount stores and department stores, shows low and still-dropping Index
scores. The sector is dominated by a handful of major national players.
Eating & Drinking Items of Note
Full service dining establishments and bars have held onto their market shares while the decline in independent share was driven
by fast food restaurants. Over the last decade, even as chain restaurants have moved upmarket, full service independents have
retained strong support among dining consumers.
Among all sectors, the drinking places category produces the highest Index scores. It includes bars and taverns of all kinds, a
sector that seems remarkably immune to chain competition.
6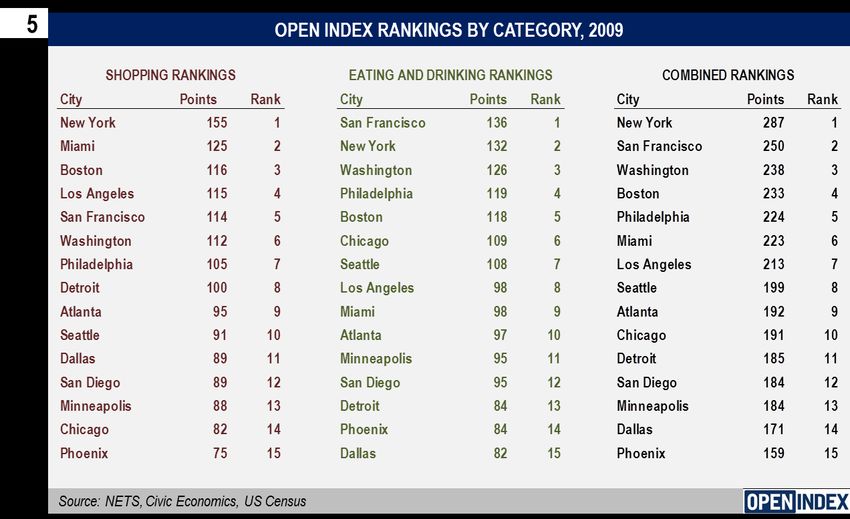
The American Express OPEN Independent Retail Index

                                                     7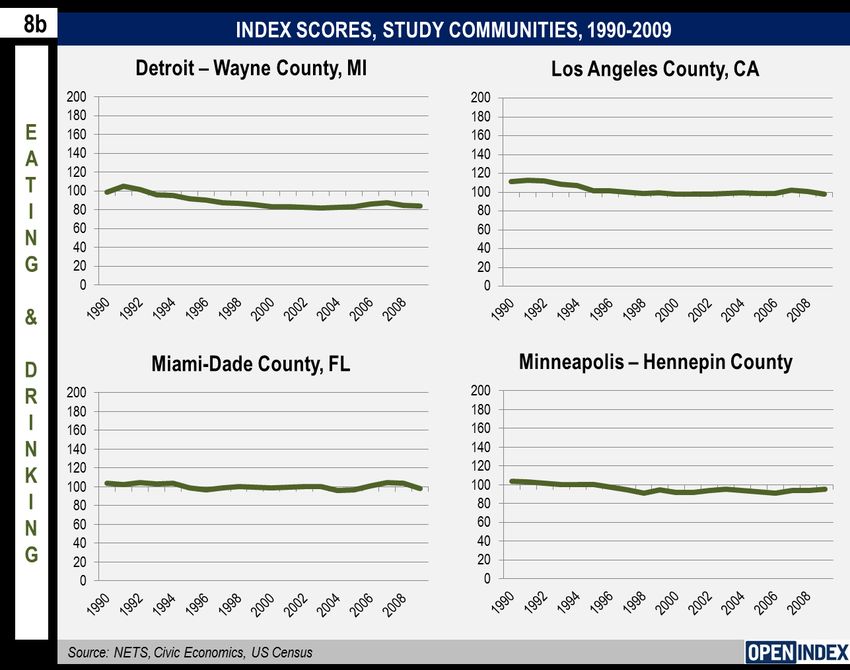
The American Express OPEN Independent Retail Index

                                                     8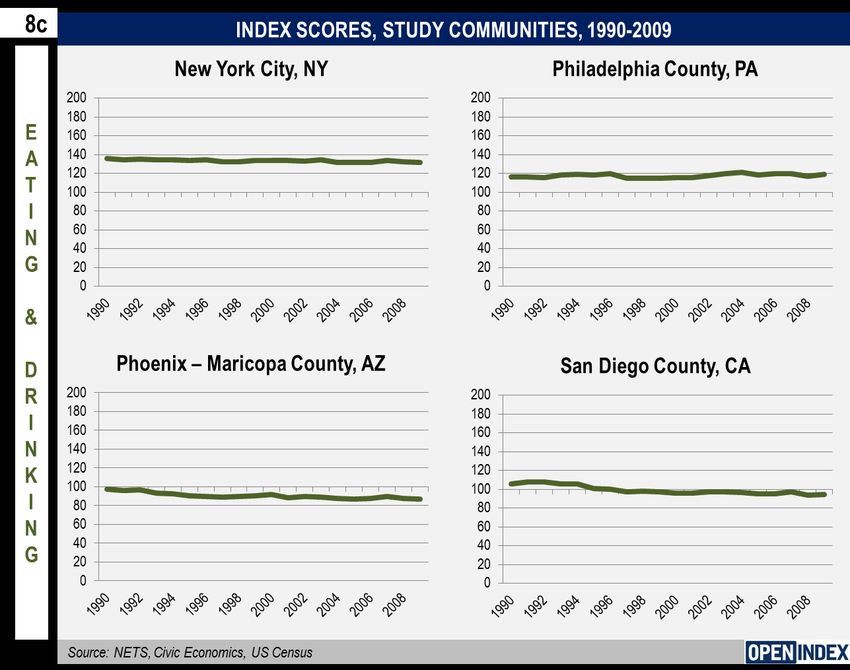
The American Express OPEN Independent Retail Index

                                                     9
The American Express OPEN Independent Retail Index
10The American Express OPEN Independent Retail Index
11The American Express OPEN Independent Retail Index
THE OPEN INDEX AMONG STUDY CITIES: DISCUSSION AND CHARTS
The charts above set the benchmark for evaluating the performance of the independent business community in the 15 cities selected
for further study. Chart 5 below shows the ranking of all study communities for Retail Shopping, Eating & Drinking, and a Co mbined
Ranking based on total index points.
12The American Express OPEN Independent Retail Index
Chart 6 below provides some context to the rankings by showing study cities in rank order with other variables. Population density at
the highest level is strongly correlated with high Index scores, though that connection disappears beyond the densest cities.
Interestingly, per capita income and retail spending are not strong predictors, demonstrating that cities of all kinds can successfully
nurture a vibrant local business community.
Charts 7 and 8 (on the following pages) show how the 15 study cities compare by Index score in the full Retail Shopping and Eating
& Drinking sectors. Further discussion of each city is provided in separate City Supplement documents.
13The American Express OPEN Independent Retail Index
14The American Express OPEN Independent Retail Index
15The American Express OPEN Independent Retail Index
16The American Express OPEN Independent Retail Index
17The American Express OPEN Independent Retail Index
18The American Express OPEN Independent Retail Index
19The American Express OPEN Independent Retail Index
20The American Express OPEN Independent Retail Index
21The American Express OPEN Independent Retail Index
A LOOK AT THE LOCALIZED ANALYSES
The Index has established national benchmarks for independent market shares in Retail Shopping, Eating & Drinking, and a number
of specialized segments within each. In addition, we have looked more deeply at the Indexes for each of 15 major American cities,
using urban core counties as the study area.
Civic Economics selected neighborhoods for closer analysis in a systematic way. We began with a map of the full study county, with
coloration to indicate the concentration of independent business activity in 2009, in both Retail Shopping and Eating & Drinking. In
each county, we scanned the map for discrete areas of intensity, identifying business districts or corridors with strong independent
revenues relative to the rest of the county. Upon identifying these areas, we consulted aerial images and business listings in Google
Earth to see that we had, indeed, found an identifiable district that would be generally recognized by residents of the city as a hub of
independent merchants. In each county, we sought one to three such locations and made those selections without regard for other
data points such as wealth, home values, or demographic factors. Where multiple districts appeared suitable, we exercised some
discretion to ensure a diverse sample of communities.
Ultimately, we identified 27 such districts for detailed study. In each case, we mapped the mix of business in five -year increments
and calculated annual sales and employment at both independents and chains. Chart 9 on the following page s hows the
neighborhood business districts, in alphabetical order by core city, studied along with 2009 Index scores for each.
Not only does each of these neighborhoods have something to tell us about the city in which it emerged, collectively these bu siness
districts and the entrepreneurs who have built them have something to tell us about the state of independent business in America.
Having studied independent business districts in various contexts over the years, Civic Economics would offer some observations
about this set of 27. Among them are places of wealth and poverty, but most are decidedly middle class. Hipsters and fashionistas
are well represented, of course, but so are tourists in shorts and parents with strollers. Some are shopping meccas while others
feature restaurants, but most achieve a balance between daytime and evening activity. Most, in fact, serve a diverse cross-section of
the community in which they are found. Indeed, the only consistent, unifying trait of these districts is the strength of the independent
business community.
22The American Express OPEN Independent Retail Index
23The American Express OPEN Independent Retail Index
Locations of Successful Districts
The business districts fall into three broad geographic classes: Urban, Close In, and Suburban as illustrated in Map A, below. The
broad range of successful districts studied demonstrates that local business owners can build a destination anywhere they find
affordable, accessible space and a customer base to be served. While some districts selected for study blur the lines between these
broad classes, all represent the ability of small business owners to adapt their environment to changing conditions.
Those in truly urban settings are typically imbedded in high density areas served by mass transit. The ones selected for study did
not emerge overnight. Rather, neighborhood storefronts that date back to the origins of the community have evolved in how they
serve the area. Many American cities have found in recent decades that they have a surfeit of commercial space in urban
neighborhoods, dating to times of denser population and limited mobility. With the emergence of supermarkets and shopping ma lls,
activity often declined in established pedestrian districts. Those blessed with the right mix of entrepreneurs, infrastructure, and
24The American Express OPEN Independent Retail Index
customers emerge to draw business from a wider area, sometimes becoming regional or even national destinations.
The Castro, for example, emerged decades ago as a center of alternative lifestyles in San Francisco. In the time since, the
neighborhood has maintained that character and diversified substantially. Northern Liberties, in Center City Philadelphia, represents
a more recently emerged urban district. Since the mid-1990’s, the neighborhood has been transformed completely into a prosperous
and popular choice for urban living as well as shopping and eating.
Many of these districts are best characterized as Close In. These typically evolved out of commercial strips developed in the years
preceding and following World War II, when developers erected low rise buildings close to the curb to serve the residents and
commuters in what was then suburbia. Even small American cities include corridors like these, which provide a powerful draw to
small businesses looking for low rents, automobile access, and a degree of character not found in new suburban shopping cente rs.
As with urban areas, the right mix of entrepreneurs, infrastructure, and customers can trigger tremendous growth in sales and
employment along formerly sleepy or even derelict strips.
Lower Greenville in Dallas, Andersonville in Chicago, and Virginia-Highland in Atlanta, among others, represent transformations of
this sort. In every case, that evolution has been associated with higher home values and improved job opportunities in central
locations.
Suburban business districts can take a variety of forms. In many cases, these arise in the downtown area of what was once a
geographically separate town. As suburban development approaches or engulfs these communities, the old downtown with its rigid
grid and older homes can be cut off from the new world around it. However, the infrastructure of mixed -use, often historic structures
remains. Where local officials preserve connections and support new business, these areas can flourish, providing a taste of city life
amidst the subdivisions, malls, and power centers.
Downtown Plymouth, Michigan, shown above, finds itself at the edge of suburbia yet maintains an attractive and distinct identity that
serves the needs of locals while drawing visitors from surrounding communities. The powerful economic engine of Downtown
Scottsdale, for another example, grew out of the pioneering galleries of Old Town to become a shopping and dining destination for
the region and its legions of tourists.
25The American Express OPEN Independent Retail Index
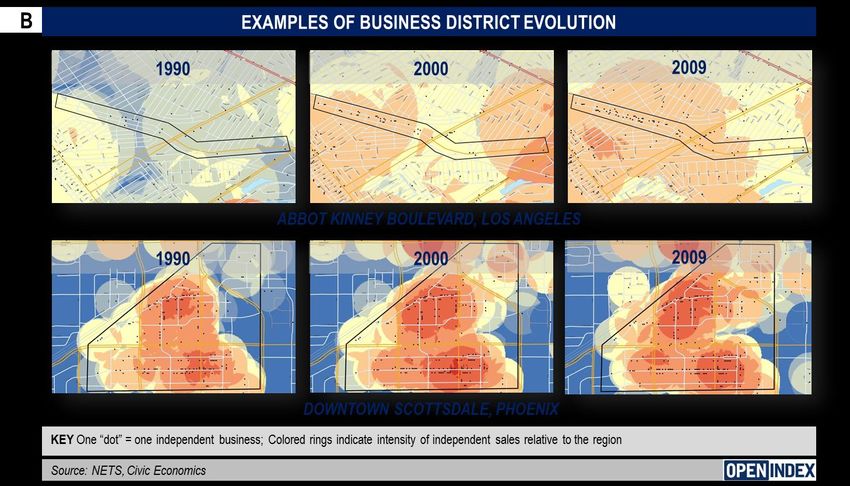
Evolution of Successful Districts
The evolution of the independent business community is as varied as the 27 neighborhoods studied here. In many cases, the district
was well established at the beginning of our study period in 1990. In others, the evolution began after that date, allowing a time -
lapse view of the emergence of a distinctive place. Map B below page depicts two good examples.
26The American Express OPEN Independent Retail Index
In 1990, the Venice neighborhood in the City of Los Angeles had a reputation that deterred all but the most adventurous visitors.
Few independent businesses operated beyond the famous seafront. The emergence of a thriving business district along Abbot
Kinney Boulevard began in the mid-1990’s, as businesses with an offbeat clientele began populating the western reaches. By 2009,
Abbot Kinney had become a regional destination both day and night, and homes in proximity to the business district appreciated
much faster than even the red-hot Los Angeles market. Even since the housing price reversal of 2008, the Venice area has lost far
less value than the rest of the city (down 22% from 2007 highs compared to 33% for the city), while continuing to add businesses and
jobs.
Downtown Scottsdale, Arizona, adjacent to the City of Phoenix in Maricopa County, was already a thriving business district in 1990.
Old Town, in particular, was well established. Even then, the shops and restaurants of the district employed 1,500 people and found
many of its customers among the well-heeled travelers of the world. The unique mix of independent and unusual stores has not lost
its drawing power. Today, though Maricopa County earns the lowest OPEN Index score among our study communities, Scottsdale’s
Retail Shopping Index of 201 makes it among the strongest independent business districts in America.
In some neighborhoods, evolution was more complex than simply growth to a plateau. In Atlanta’s Virginia-Highland and
Minneapolis’ Uptown, for example, early success in building a retail-driven district led to an increase in restaurant and bar activity
that, in these cases at least, appears to have displaced retail as storefronts became harder to secure. In other districts, early
success was established by independent businesses, who were then joined by a variety of chain stores and restaurants. In all of
these cases, though, independent growth continued alongside the newly arrived chain stores.
In the individual city reports released with the Index, more detailed five-year maps and annual sales and employment charts show
the power of momentum in successful districts. Sales typically continue to grow until neighborhood storefronts are saturated, limiting
opportunities for expansion and leading to a sales plateau. Among the 27 neighborhoods in the study, only a few suffered sustained
sales declines before the recent recession began in 2008, those that did typically saw a shift from Retail to Eating & Drinking or vice
versa. In the challenging market since then, many have even continued expanding the number of businesses, sales, and
employment.
27The American Express OPEN Independent Retail Index
Sales Trends
For each of the 27 neighborhoods selected for study, Civic Economics
analyzed business on an annual basis, chartings sales trends in Retail
Shopping and Eating & Drinking for both chains and locals (Chart 10).
Over the study period, sales at independent retail businesses in study
districts increased by 266%, which compares favorably to neighboring
chain gains of 176%. For restaurants and bars these gains were 224%
for independents and 198% for chains.
One complicating factor in these trends is the well-established market
dominance of large-format supermarkets, most of which are a part of
one national chain or another. These stores typically generate revenue
of $20-40 million, which certainly impacts the appearance of market
share bar charts used in this study. As many of these neighborhoods
grew in prominence, national supermarket chains chose to locate in
them, strongly impacting the Index score for a neighborhood. Chart 11
28The American Express OPEN Independent Retail Index
compares those charts with and without nationally based supermarkets in one San Diego business corridor. While independent sales
remain the same, chain sales fall dramatically when chain supermarkets are excluded from the analysis.
Economic Benefits of Independent Business Districts
To measure the economic benefits provided by a thriving independent business district, Civic Economics studied two questions in
each local business district analyzed. Chart 12 on page 32 presents the average outcomes of these two measures among all study
districts.
The first is whether the presence of the district produces healthy neighborhoods around it. We used changes in home values as a
proxy to determine the relative health of a neighborhood over time, since that one variable reflects the desirability of the
neighborhood relative to the broader market.
For each district, we identified one or two adjacent Zip Codes to encompass both the business district and nearby residences, then
used Zillow.com to download data on the median sales price of residential properties in those neighborhoods. In a few cases, gaps
in the data required us to use Zillow’s proprietary estimate of median home values, which interpolates periods of insufficient data. In
all cases, though, we were looking not at total value; the relative wealth of the neighborhood is irrelevant in this exercise . Instead we
looked at the change in value over time, alongside the growth of the independent business district.
With surprising consistency, we found that growth in a nearby independent business district was tightly associated with increased
home values in excess of the gains shown in the broader market (either city or county). Among the 27 business districts studied,
adjacent neighborhoods outgained their broader markets by 50% over the 14 years for which data was available.
At least two of the neighborhoods studied experienced steep and sudden value increases of a sort that might well cause hardship
and dislocation for existing residents of limited means. However, the general principle is that property values reflect the value home
buyers place on the amenities available in a given home.
The neighborhoods represented in this sample are richly varied across a number of variables. None are the wealthiest in the region;
many are more funky than chic; some are daytime destinations, others nighttime, but most offer a balance of shopping, dining, and
drinking establishments. The one constant across these neighborhoods, and the sole reason we selected them for study, is the
presence of an indie-driven business district.
The second question is how many jobs are created by the retail shops, restaurants, and bars of the district. Though a few study
districts are quite small, others are clearly employment drivers for the entire city or region in which they are found.
29The American Express OPEN Independent Retail Index
Study neighborhoods also consistently added jobs as sales increased. The shops, restaurants, and bars of the average study district
increased employment from 1,100 to over 1,800.
In our experience, when most people look at these districts they may see a collection of small storefronts that do not, individually,
employ large numbers of people. However, considering these clusters of storefronts collectively reveals a concentrated source of
employment opportunities.
In addition, these jobs are created not at the periphery of the city but in established neighborhoods. They are generally well served
by transit, built on a human scale, and a short, safe walk from residential blocks. These activities occur where the infrastructure
already exists.
Thriving independent business districts create tangible benefits in every city studied. They bring jobs to the people, revitalize entire
neighborhoods, and generate tax revenue where it is often most needed. Moreover, these districts require minimal investment and
support from the public sector.
30The American Express OPEN Independent Retail Index
31The American Express OPEN Independent Retail Index
CONCLUDING THOUGHTS
The American Express OPEN Independent Retail Index provides the first national, longitudinal study of market share trends for
independent businesses. While those shares have declined over the last twenty years, they have held up better than we suspect
most Americans realize. Mom and Pop are hardly a thing of the past. They still draw nearly half of all Retail Shopp ing business and
64% of Eating & Drinking business.
The Index has documented the rich variety of independent-dominated business districts in cities across America.
These business districts aren’t just places to shop or eat. They are community amenities that the market values highly. Just living
near one provides increases in property value well beyond the broader market. They are community employment centers, too,
bringing jobs into established neighborhoods where people live and transit works.
In the ten years since its establishment, Civic Economics has had the opportunity to work with independent businesses and their
associations from coast to coast. That experience has given us great faith in the creativity and adaptability of small business
proprietors to contribute mightily to local economies by reinvesting profits in the community, employing and purchasing goods and
services from their neighbors, and donating to locally-focused charities. The American Express OPEN Independent Retail Index
reinforces that faith by showing concrete examples of success in cities of all types.
32The American Express OPEN Independent Retail Index
CONTACTS
To learn more about the Index and Small Business Saturday, please visit SmallBusinessSaturday.com.
For Civic Economics: For American Express OPEN:
Dan Houston, Partner Rosa Alfonso, Vice President of Public Affairs
512.853.9044 212.640.1712
dhouston@civiceconomics.com rosa.m.alfonso@aexp.com
Civic Economics is an economic analysis and strategic American Express OPEN is the leading payment card issuer
planning consultancy with offices in Austin and Chicago. for small businesses in the United States and supports
Founded in 2002 by Matt Cunningham and Dan Houston, the business owners with products and services to help them run
firm has earned a national reputation for innovative and grow their businesses. This includes business charge and
approaches to economic development challenges. Learn credit cards that deliver purchasing power, flexibility, rewards,
more at www.CivicEconomics.com. savings on business services from an expanded lineup of
partners and online tools and services designed to help
improve profitability. Learn more at www.OPEN.com and
connect with us at openforum.com and twitter.com/openforum.
American Express is a global services company, providing
customers with access to products, insights and experiences
that enrich lives and build business success. Learn more at
www.americanexpress.com and connect with us on:
www.facebook.com/americanexpress,
www.twitter.com/americanexpress and
www.youtube.com/americanexpress.
33You can also read