Pollution Characteristics of Microplastics in Soils in Southeastern Suburbs of Baoding City, China - MDPI
←
→
Page content transcription
If your browser does not render page correctly, please read the page content below
International Journal of
           Environmental Research
           and Public Health

Article
Pollution Characteristics of Microplastics in Soils in
Southeastern Suburbs of Baoding City, China
Chuan Du 1,2 , Handong Liang 1,2, * , Zhanping Li 3, *                     and Jie Gong 1,2
 1    State Key Laboratory of Coal Resources and Safe Mining, Beijing 100083, China;
      dc13298312753@163.com (C.D.); fgr678@126.com (J.G.)
 2    College of Geoscience and Surveying Engineering, China University of Mining and Technology (Beijing),
      Beijing 100083, China
 3    Key Laboratory of Organic Optoelectronics and Molecular Engineering of Ministry of Education,
      Department of Chemistry, Tsinghua University, Beijing 100084, China
 *    Correspondence: hdl6688@cumtb.edu.cn (H.L.); dcaisxy@mail.tsinghua.edu.cn (Z.L.);
      Tel.: +86-010-6233-1029 (H.L. & Z.L.)

 Received: 19 November 2019; Accepted: 15 January 2020; Published: 29 January 2020

 Abstract: Microplastics (MPs) are emerging pollutants that exist in different environmental media.
 Because of their wide range and large potential environmental hazards, they have attracted widespread
 attention in recent years. At present, the research on MP is mostly concentrated on the water
 ecosystems, and the impact on soil ecosystems is less studied. In this study, 12 typical soil samples
 from southeastern suburbs of Baoding city were investigated and characterized by time-of-flight
 secondary ion mass spectrometry (TOF-SIMS) combined with mass high resolution mode and positive
 and negative ion imaging mode. Four types of MPs, poly (propylene) (PP), poly (vinyl chloride)
 (PVC), poly (ethylene terephthalate) (PET), and poly (amide 6) (PA6), were quickly identified, of
 which PET and PA6 accounted for the largest proportion of both up to 30.2%; the particle size of the
 obtained MPs ranged from 0 to 35 µm, of which the proportion of
Int. J. Environ. Res. Public Health 2020, 17, 845                                                  2 of 12

direct source of atmospheric suspension of MPs [15]. In freshwater ecosystems, Wang confirmed that
anthropogenic factors affect the abundance of MPs [16]. To assess the environmental risks associated
with MPs, different ecosystems should be studied.
      At present, there are several ways to identify MPs in soil. Vianello identified MPs from the
Venetian lagoon sediments of 1 mm or less by µFTIR, the most frequent size (93% of observed
MPs) was in the range 30–500 µm, and up to 70% of particles was erroneously identified as MPs
through FTIR analysis [2]. Sobhani implemented Raman to map MP towards their identification
and visualisation, with a lateral resolution down to 1 µm, but the technique of Raman spectroscopy
would be interrupted by the presence of color, additives and attached contaminants MPs [17]. SEM is
also used for identification of MPs, and provides high-magnification and clearer structural images
of MPs. Nevertheless, SEM detection takes a lot of time and is relatively expensive [18]. In addition,
Pyr-GC/MS has been also used to gain structural information of polymer by analyzing their thermal
degradation products. However, the materials analyzed by Pyr-GC/MS would be destructive [19].
Jungnickel used time-of-flight secondary ion mass spectrometry to identify PE in the ocean, which
can quickly perform mass spectrometry and imaging on MPs. The sample preparation steps are
simple, and the samples are less damaged [20]. Besides, Du used TOF-SIMS to characterize the MPs
found in farmlands and analyze their distribution characteristics [21]. Up to now, there have been
many method and index for environmental risk assessment of MP. Wilcox used species distribution
models, numerical plastic modelling, and ingestion rates across a diverse range of marine species
with different life history traits, to undertake a risk assessment for the Mediterranean Sea region [22].
Schuyler used vertebrate organisms to obtain the first empirical estimate of the relationship between
plastic ingestion and death [23]. Based on the chemical composition of plastic polymers, Lithner
incorporated additives, chemical hazards of monomers, polymers, and polymers, and developed a
hazard grading model for plastic polymers to evaluate the impact of hazards on human health and
biology [24]. The southeastern suburbs of Baoding city are located in the central functional area of
the Beijing-Tianjin-Hebei coordinated development. The study area is an important manufacturing
base in northern China, and it is a typical urban-rural integrated area represented by small processing
enterprises. The northern part of the study area is 162 km away from Beijing, 130 km away from Tianjin,
and 187 km away from Shijiazhuang in the north. The soil types are mainly fluvo-aquic soil and moist
soil, and the soil texture is mainly sandy loam and loam. Most of the county is rural, which accounts
for more than 80%, and the main land use type is farmland. The study area is known as the North
China Shoe Capital and has more than 1000 shoe processing and manufacturing workshops. These
small workshops not only consume a lot of energy, but also produce a large number of industrial waste
and toxic gases. At the same time, the area also includes plastic processing and down industries. The
processing of plastic products consumes a lot of resin and produces a large amount of industrial waste,
most of which is discharged into nearby farmland and rivers. In this study, time-of-flight secondary
ion mass spectrometry (TOF-SIMS) was used to characterize the MPs in urban-rural integration area
soils of northern China, and its distribution characteristics were analyzed. Meanwhile, the risk scoring
method of plastic polymers created by Lithner was adopted to evaluate the environmental risk of the
MPs. We hoped that this study can assist policy formulation of MP pollution in terrestrial soils by
providing preliminary data on MPs assessment.

2. Materials and Methods

2.1. Sample Collection
     The study area was located near Baoding City in Hebei Province, northern China (38◦ 700 –38◦ 960 N,
115◦ 670 –116◦ 130E). According to the different urban functional areas, 12 typical areas were selected
(Table 1). Soil samples at a depth of about 10 cm from the surface were collected using a stainless steel
sampling shovel. At least five soil samples (within 100 m2 ) were collected at each sampling point; the
samples were mixed and homogenized into a composite sample, wrapped with aluminum foil, put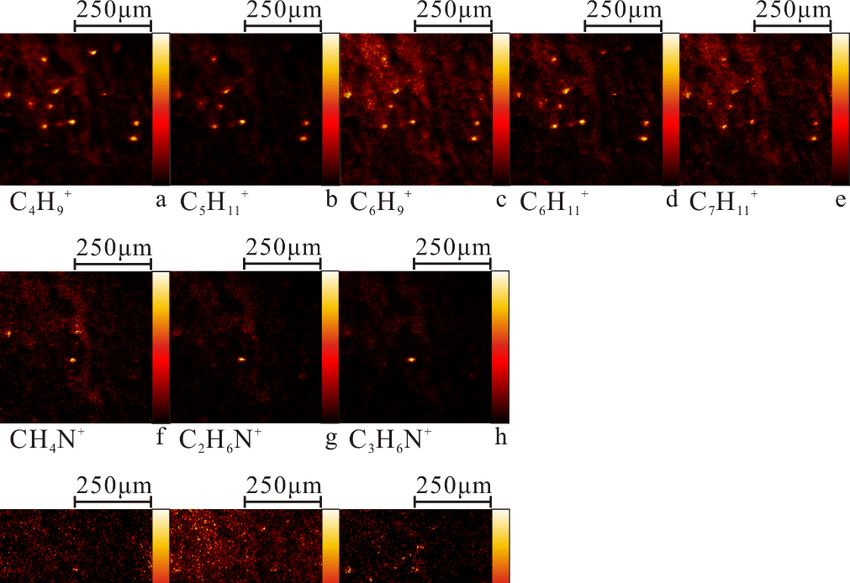
Int. J. Environ. Res. Public Health 2020, 17, 845                                                              3 of 12

into a sampling bag, brought back to the laboratory, placed in a clean and light-proof place, dried, and
preserved at low temperature.

                              Table 1. Location of sampling points and soil utilization type.

              Site Number           Latitude and Longitude         Elevation           Soil Utilization Type
                                          115.829121◦ E,
                   XA1                                               11 m                 Industrial Park
                                          38.793376◦ N
                                          115.667520◦ E,
                   XA2                                                4m                        Factory
                                          38.737593◦ N
                                          115.967873◦ E,
                   XA3                                               14 m                   Forest Land
                                          38.737334◦ N
                                          116.129161◦ E,
                   XA4                                               14 m                Residential Area
                                          38.922821◦ N
                                          115.967832◦ E,
                   XA5                                               11 m                       Factory
                                          38.774490◦ N
                                          115.667495◦ E,
                   XA6                                               22 m                       Farmland
                                          38.792877◦ N
                                          115.921591◦ E,
                   XA7                                                9m                        Factory
                                          38.700302◦ N
                                          115.852379◦ E,
                   XA8                                                7m                 Residential Area
                                          38.792931◦ N
                                          115.713766◦ E,
                   XA9                                                7m                        Farmland
                                          38.848288◦ N
                                          116.105875◦ E,
                   XA10                                               4m                        Farmland
                                          38.903642◦ N
                                          115.760000◦ E,
                   XA11                                              11 m                       Factory
                                          38.922257◦ N
                                          115.898340◦ E,
                   XA12                                               5m                        Farmland
                                          38.957338◦ N

2.2. Sample Pretreatment
     At present, there are few detection methods for MPs with a particle size of 1–20 µm, and the
maximum scanning area of TOF-SIMS is 500 µm2 . The large particle size is not conducive to imaging
characterization. It is considered that TOF-SIMS is suitable for detecting MPs smaller than 35 µm.
After air drying, the soil samples were screened using a 35 µm sieve, and the preliminary separation
samples (about 100 g) were obtained. About 1 g (dry weight) was weighed for MPs extraction. In total,
4 mL of 30% H2 O2 solution was added, then added to 10 mL ultrapure water, and the samples were
sealed. The sample was then incubated at 60 ◦ C constant temperature water bath for 6 h to remove
natural organic matter, and the sample was left for 1 h to ensure aggregates dispersed in the sample.
After standing for 24 h, a small amount of supernatant liquid was absorbed on the silicon chip by a
liquid transfer gun, and then, the sample was put into a fume hood to dry naturally for 24 h. Before
the experiment, the samples were stored in Petri dishes and kept away from light. According to this
method, 12 soil samples were collected to be processed in turn.

2.3. TOF-SIMS
     TOF-SIMS analysis was carried out on a TOF-SIMS 5 (ION-TOF GmbH, Münster, Germany),
equipped with a Bi liquid metal ion gun (LMIG). TOF-SIMS spectra and images were acquired using
a 30 keV Bi3 ++ LMIG. The Bi3 ++ current was 0.8 pA (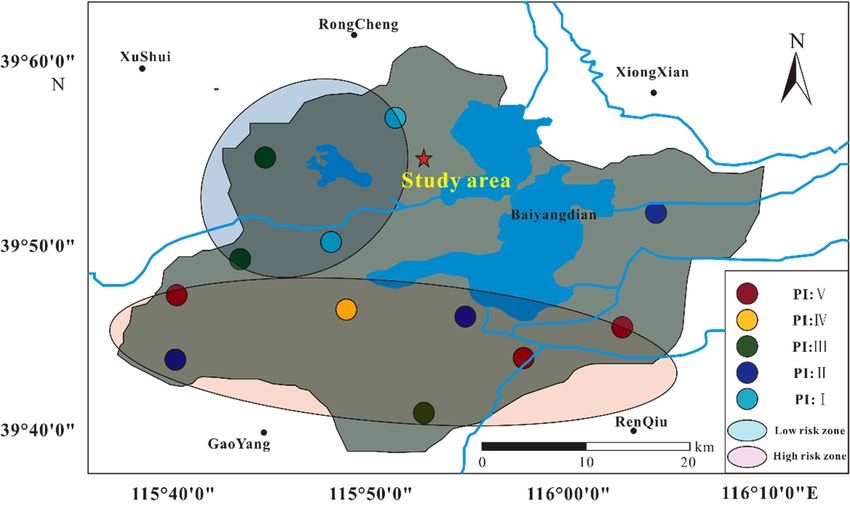
Int. J. Environ. Res. Public Health 2020, 17, 845                                                                                           4 of 12

2.4. Standard Sample Analysis
      TOF-SIMS analyzed six common MPs standard samples, including poly (ethylene) (PE), poly
(propylene) (PP), poly (styrene) (PS), poly (vinyl chloride) (PVC), poly (amide 6) (PA6) and poly
(ethylene terephthalate) (PET) [16,18,20,25–29]. PE pellets, PP pellets, PS pellets, PVC pellets, PA6 and
PET pellets (about 30 µm) were bought from Sigma-Aldrich (Milwaukee, WI, USA). For ion detection,
standard samples of PE, PP, PS, PVC, PET, and PA6 were first tested, and then, the mass spectra of
each standard sample were compared. However, only the typical fragments of PA6, PET, PVC, and PP
could be distinguished from each other (Table 2). Therefore, these four MPs were considered suitable
for identification in fresh soil samples.

                       Table 2. Typical fragment ions of four microplastic MP standard samples.

           Polymer Type             Characteristic Peak Mass (m/z)                       Typical Fragment Ion Composition
                  PP              57.074, 71.091, 81.103, 83.134, 95.137              C4 H9 + , C5 H11 + , C6 H9 + , C6 H11 + , C7 H11 +
                 PA6                      30.036, 44.051, 56.068                              CH4 N+ , C2 H6 N+ , C3 H6 N+
                 PET                   104.014, 142.075, 149.006                           C7 H4 O+ , C7 H10 O3 + , C8 H5 O3 +
                 PVC                     83.978, 125.050, 151.79                             C4 HCl+ , C7 H6 Cl+ , C9 H8 Cl+

2.5. Risk Assessment
     In this study, the chemical composition and relative abundance of MPs were considered to assess
the potential risk of MPs in surface soil of the study area. Following Lithner et al. the chemical toxicities
of MP polymers were used as an important indicator for assessing their ecological hazards. Therefore,
the hazard score of Lithner’s plastic polymers and the type of polymers used to evaluate the risk of
MPs were used in this study (Table 3) [24]. The formula is as follows:
                                                                     X
                                                             H=             Pn × Sn                                                            (1)

where H is the calculated polymer risk index of MPs, Pn is the percentage of different types of MPs
collected at each sampling point, and Sn is Lithner’s score for a polymer compound consisting of
MP particles.

                               Table 3. Polymer information for MPs detected in this study.

      Polymer Type             Monomer                  Density (g/cm3 )                  Main Application                        Fraction
                                                                                   Agricultural film, bottle, food
            PP                 Propylene                   0.85–0.94                                                                  1
                                                                                           packaging etc.
           PA6               Caprolactam                      1.13             Bearings, automotive applications, etc.                50
                                                                                  Food and drug packaging film,
                           Terephthalic acid
           PET                                             1.33–1.38               packaging bottle, automobile                        -
                          and ethylene glycol
                                                                                          application, etc.
           PVC              Vinyl chloride                    1.41                   Pipe, cable insulation, etc.                  10,551
      PET lacks ecological toxicity data, therefore its hazard score cannot be determined. The value for the score of each
      polymer is taken from Lithner [24].

    This study provides a classification standard of risk level of MPs (Table 4), which can initially be
used to understand the risk level of MP pollution in the study area and also to provide support for risk
management of MP pollution in soil [30,31].

                                     Table 4. Risk rating criteria for MP contamination.

             Value of Polymer Index            2500
             Risk category (PI)                     I                  II              III                IV                V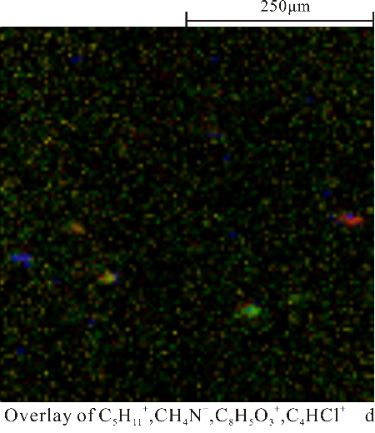
Int. J. Environ. Res. Public Health 2020, 17, 845                                                                5 of 12

2.6. Data Analysis
    Using the respective peak lists as described above the raw data sets were further processed
using ION-TOF Surface Lab 6.6. Particle counting and size measurement was executed with Nano
Measurer 1.2.

3. Results and Discussion

3.1. TOF-SIMS Analysis
     Taking XA1 sample as an example, the typical fragments of four MPs were analyzed by ion mass
spectrometry, and the representative data of PP, PVC, PET, and PA6 were collected with imaging
information. Accordingly, the characteristic ions of MPs in were obtained (Figure 1). In addition, the
characteristic ions of clay minerals such as Na+ , Al+ , Si+ and Ca+ were also detected on the surface of
     Int. J. Environ. Res. Public Health 2020, 17, x FOR PEER REVIEW                          5 of 13
MPs (Figure 2o–r).

                                           Figure1.1.Positive
                                         Figure                ion spectra
                                                      Positive ion  spectraobtained
                                                                            obtained XA1.
                                                                                    XA1.

           The color shading presented by the ion imaging mass spectrometry indicates a change in the
      magnitude of the ion count values at different sites and is a reflection of the change in the
      concentration distribution of specific ion composition in the 500 μm × 500 μm microzone (Figure 2).
      The characteristic ions corresponding to PP, PVC, PET, and PA6 were all present as single particles
      with certain morphologies in the target region, and the relative signal intensity was high. The trend
      of changes differed among the characteristic ions of all MPs, thus denoting that the characteristic ions
      of these four MPs can be distinguished from each other. To a large extent, this information also shows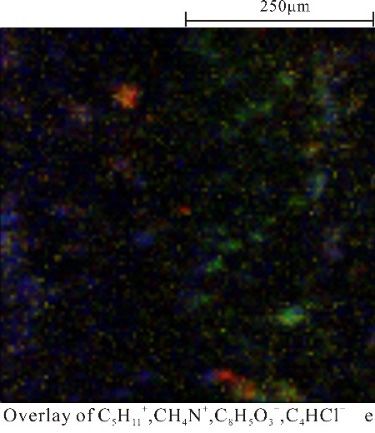
Int. J. Environ. Res. Public Health 2020, 17, x FOR PEER REVIEW 6 of 13
Int. J. Environ.
m/zRes. Public(CH
= 30.034 Health 2020, 17, 845
4N+) (Figure 2f), m/z = 149.027 (C8H5O3+) (Figure 2k), and m/z = 83.982 (C4HCl+) (Figure
6 of 12
2l), respectively.
Figure 2. Time-of-flight
Figure 2. Time-of-flight secondarysecondary ion mass
ion mass spectrometry(ToF-SIMS)
spectrometry (ToF-SIMS) maps
mapsof of
some characteristic
some characteristic ions
ions of MPs in XA1 (a-e) PP; (f-h) PA6; (i-k) PET; (l-n) PVC.
of MPs in XA1 (a–e) PP; (f–h) PA6; (i–k) PET; (l–n) PVC.
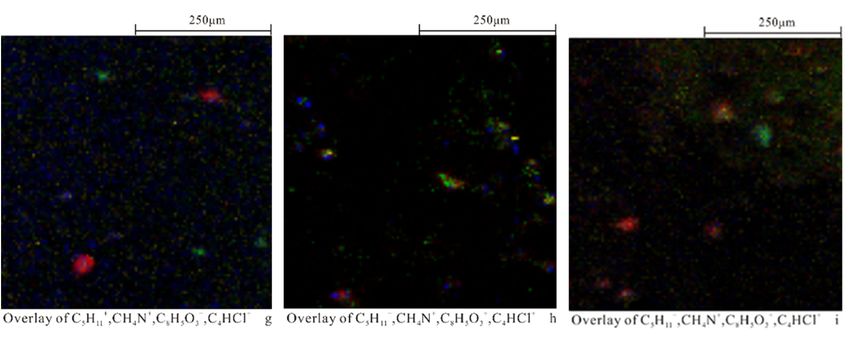
Figure 3a displays the overlay ion images using the most characteristic ions of the four polymers,
The color
C5H11+ shading
(PP) in red,presented
CH4N+ (PA6) byin the ion
green, imaging
C8H 5O3+ (PET)mass spectrometry
in blue, indicates
and C4HCl+ (PVC) in yellow.aThus,
change in the
magnitudethe ofdistributions
the ion count values
of the at different
four types of MPs in sites andarea
the target is aand
reflection of the change
the morphological in theofconcentration
information the
individual MPs could be clearly observed. These results show that TOF-SIMS analysis can
distribution of specific ion composition in the 500 µm × 500 µm microzone (Figure 2). The characteristic distinguish
different types of MPs in soil. Similar results can also be obtained for the main characteristic ions for
ions corresponding to PP, PVC, PET, and PA6 were all present as single particles with certain
XA2–XA12 sites by ion superposition plots (Figure 3b–l).
morphologies in the target region, and the relative signal intensity was high. The trend of changes
differed among the characteristic ions of all MPs, thus denoting that the characteristic ions of these
four MPs can be distinguished from each other. To a large extent, this information also shows that
most of the MPs in farmland soil in this area are single polymers. C4 H9 + , C5 H11 + , C6 H9 + , C6 H11 + , and
C7 H11 + are all characteristic ions of PP and have similar light and dark changes in the lower left quarter
(Figure 2a–e), but C5 H11 + can distinguish PP from other polymers and substrates more effectively than
other characteristic ions. It is clear that m/z = 71.083 (Figure 2b) for (C5 H11 + ) as the main characteristic
ion of PP. Similarly, the main characteristic ion of PA6, PET, and PVC should be m/z = 30.034 (CH4 N+ )
(Figure 2f), m/z = 149.027 (C8 H5 O3 + ) (Figure 2k), and m/z = 83.982 (C4 HCl+ ) (Figure 2l), respectively.
Figure 3a displays the overlay ion images using the most characteristic ions of the four polymers,
C5 H11 + (PP) in red, CH4 N+ (PA6) in green, C8 H5 O3 + (PET) in blue, and C4 HCl+ (PVC) in yellow. Thus,
the distributions of the four types of MPs in the target area and the morphological information of the
individual MPs could be clearly observed. These results show that TOF-SIMS analysis can distinguish
different types of MPs in soil. Similar results can also be obtained for the main characteristic ions for
XA2–XA12 sites by ion superposition plots (Figure 3b–l).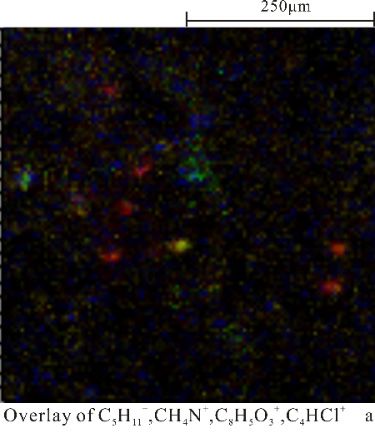
Int. J. Environ. Res. Public Health 2020, 17, 845                                                                       7 of 12
      Int. J. Environ. Res. Public Health 2020, 17, x FOR PEER REVIEW                                            7 of 13

      Figure  3. Ion-imaging
           Figure               superimposed
                    3. Ion-imaging superimposedimages
                                                  images of
                                                          of four MPs(a)
                                                             four MPs   (a)XA1;
                                                                            XA1;(b)(b) XA2;
                                                                                    XA2; (c) (c)
                                                                                             XA3;XA3; (d) XA4;
                                                                                                  (d) XA4;       (e) XA5;
                                                                                                           (e) XA5;
      (f) XA6;  (g) XA7;   (h) XA8; (i) XA9; (j) XA10; (k)   XA11; (l) XA12;  500   µm  × 500   µm, 128 ×  128
           (f) XA6; (g) XA7; (h) XA8; (i) XA9; (j) XA10; (k) XA11; (l) XA12; 500 μm × 500 μm, 128 × 128 pixel.  pixel.

3.2. Type,  Particle
      3.2. Type,     Size,Size,
                 Particle   Abundance  and
                                Abundance andDistribution
                                              Distribution of
                                                           of MPs
                                                              MPs
     The The
          particle sizesize
              particle   and  quantity
                            and  quantityinformation    of the
                                           information of  thefour
                                                                fourtypes
                                                                     typesofof MPs
                                                                             MPs      in soil
                                                                                  in soil  cancan  be obtained
                                                                                               be obtained  by by
usingusing
      Nano Nano  Measurer
            Measurer     1.21.2 software
                             software   totodeal
                                             dealwith
                                                 with the
                                                      the superposition
                                                           superpositionmap.
                                                                           map.In In
                                                                                  thisthis
                                                                                       study, a stainless-steel
                                                                                           study, a stainless-steel
     screen
screen withwith  a pore
            a pore       diameter
                     diameter   of of
                                   3535µmμmwas
                                             wasused
                                                  used for
                                                       for the
                                                           the preliminary
                                                               preliminary separation,
                                                                             separation,so the particle
                                                                                            so the      size of
                                                                                                    particle size of
the MPs obtained ranged from 0 to 35 µm. The overall particle size distribution is shown in Figure 4b.
More than 49% of the total MP particles were smaller than 15 µm; 26.4% and 23.3% were in the range
of 0–10 µm and 10–15 µm, respectively. Very few MPs larger than 25 µm were observed, accounting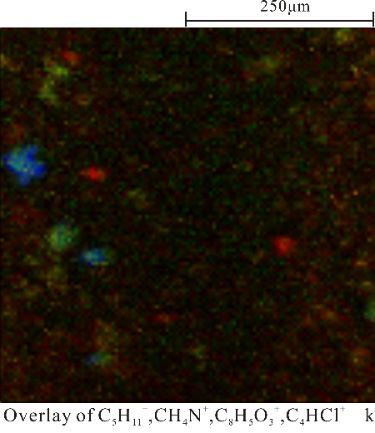
Int. J. Environ. Res. Public Health 2020, 17, 845 8 of 12
Int. J. Environ. Res. Public Health 2020, 17, x FOR PEER REVIEW 8 of 13
the MPs obtained ranged from 0 to 35 μm. The overall particle size distribution is shown in Figure
for only
4b. 9.3%
Moreof the49%
than totalofMP
the concentrations.
total MP particlesThe proportion
were smaller thanof MPs
15 μm; with different
26.4% particle
and 23.3% weresize ranges
in the
in therange
studyofarea µm > µm ≈ 15–20 µm > 20–25 µm >
0–10 μm and 10–15 μm, respectively. Very few MPs larger than 25 μm were observed,with
is 0–10 10–15 25–35 µm. This is consistent
the results of most
accounting studies
for only 9.3%which stateMP
of the total that the relative abundance
concentrations. The proportion of MPs
of MPs decreases withparticle
with different increasing
particle
sizesize. Because
ranges in the of the area
study ubiquity
is 0–10ofμm
MPs smaller
> 10–15 μmthan 25 µm
≈ 15–20 μm and theirμm
> 20–25 potential
> 25–35 environmental
μm. This is
consistent
significance overwith the size
large results
MPs, of most
many studies
studieswhich
havestate that the
focused onrelative
MPs with abundance
particleofsizes
MPs below
decreases
25 µm,
with increasing particle size. Because of the ubiquity of MPs smaller than 25
such as in the mangrove wetlands of Singapore, where the particle size range of MPs is mainly below μm and their potential
20 µmenvironmental
[32]. There were significance
significant overdifferences
large size MPs, many size
in particle studies have focused
distribution of MPson MPs
among withthe
particle
sampling
sizes below 25 μm, such as in the mangrove wetlands of Singapore, where the particle size range of
sites. The MPs at XA1, XA5, XA7, XA8, XA9, and XA10 were mainly lower than 15 µm probably
MPs is mainly below 20 μm [32]. There were significant differences in particle size distribution of
because the land use types of these sampling areas are mostly farmlands. In the past few decades,
MPs among the sampling sites. The MPs at XA1, XA5, XA7, XA8, XA9, and XA10 were mainly lower
sewagethansludge
15 μmisprobably
usuallybecause
recycled theto useuse
land astypes
fertilizer in farmland
of these soil. are
sampling areas The plastic
mostly concentrations
farmlands. In the in
sludge were −1
past fewassayed
decades, in the range
sewage sludgeofis1500 to 24,000
usually recycleditems
to usekg [33–36].in Sewage
as fertilizer farmlandsludge treated
soil. The plastic by a
sewage treatment plant usually has a high abundance of MPs and a small particle
concentrations in sludge were assayed in the range of 1500 to 24,000 items kg [33–36]. Sewage sludge
−1 size (µm level). At
the same time, there are a large number of plastic microbeads in pesticides
treated by a sewage treatment plant usually has a high abundance of MPs and a small particle size and fertilizers, namely,
(μm level).
the original MPs.AtThrough
the same decades
time, there of are a large number
agricultural of plastic
activities, a large microbeads
number of in MPs
pesticides
with and
smaller
fertilizers,
particle sizes havenamely, the originalinMPs.
accumulated ThroughPlastic
the region. decadesproducts
of agricultural
in soilactivities,
are easier a large number of into
to decompose
MPs with
MPs with smaller
smaller particle
particle size sizes havethe
under accumulated
effects of in the region. Plastic
agricultural products
activities, in soil are
ultraviolet easier to and
radiation,
decompose into MPs with smaller particle size under the effects of agricultural activities, ultraviolet
microbial decomposition [37–39]. However, the MPs at XA2, XA3, XA4, and XA11 were mainly larger
radiation, and microbial decomposition [37–39]. However, the MPs at XA2, XA3, XA4, and XA11
than 20 µm. This may be because the MPs in these areas are less affected by external disturbances, and
were mainly larger than 20 μm. This may be because the MPs in these areas are less affected by
the MPs discharged
external in theand
disturbances, environment are accumulated
the MPs discharged continuously,
in the environment making further
are accumulated degradation
continuously,
more making
difficult.
further degradation more difficult.
Figure 4. Particle size, type and abundance of MPs in soil. (a) Particle size composition and relative
Figure 4. Particle size, type and abundance of MPs in soil. (a) Particle size composition and relative
content of MPs in soil; (b) Composition and relative content of MPs types in soils; (c) Particle size
content of MPs in soil; (b) Composition and relative content of MPs types in soils; (c) Particle size
composition of different
composition types
of different of MPs
types in in
of MPs the soil.
the soil.
The abundance of different types of MPs is different (Figure 4b). In general, the main types of
MPs in this area are PA6 and PET, which account for more than 30% of the detected MPs, followed by
PP, which accounts for 23.3%, and PVC, which accounts for 16.3%. Thus, the main MPs in the soil in
this area are PA6 and PET. There are many small workshops in this area, most of which develop the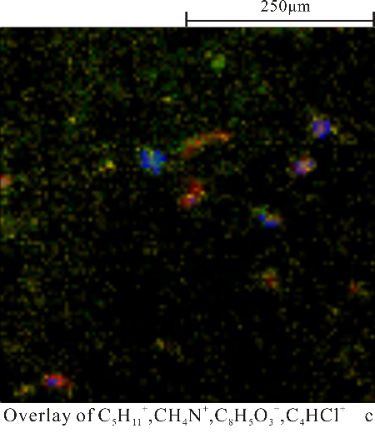
Int. J. Environ. Res. Public Health 2020, 17, 845                                                                    9 of 12

down industry of shoes and clothing, and PA6, as one of the main raw materials of shoes and clothing
production, produces a large amount of plastic waste in the processing and production processes. The
non-ferrous metal industries are a local pillar industry, and related supporting industries such as pipe
processing, automotive parts, hardware products, and other enterprises. Related industries in the
non-ferrous metals industry, such as auto parts factories and electronic device factories, require a large
amount of PET powder in the production process, and some PET waste will be directly discharged
into the nearby soil, even with the rainwater runoff and soil sedimentation MPs will be discharged to
Farther areas [40]. Therefore, PA6 and PET are the most common in the soil of this area.
     Comprehensive analysis of the type and particle size of MPs shows that the particle size
composition of different types of MPs is quite different (Figure 4c). PET and PVC have a higher
abundance in particle sizes less than 15 µm, PA6 has a higher proportion in the 15–20 µm MPs, and PP
has a uniform distribution in each particle size distribution range. Due to the poor toughness of PET, it
exhibits certain brittleness and poor alkali resistance, so its properties in the soil are unstable and it is
more likely to be broken and decomposed. Smaller MPs (µm grade) are easy to adsorb POPs (such as
organochlorine pesticides, polycyclic aromatic hydrocarbons, and their derivatives) in soil and are
more likely to enter biological tissues and even cells [6,41,42]. Therefore, in the future, more attention
should be paid to these MPs with higher abundance and finer particles.

3.3. Chemical Risk Assessment of MP
     According to the risk index (PI) of chemical characteristics of MP, the study area is facing serious
MP pollution. The classification of MP pollution risk index is shown in Table 4. MP risks that cannot
be ignored have been found in different urban functional areas of the study area (Figure 5). The high
chemical risk index in some areas is due to the presence of MPs (such as PVC) with high hazard
scores [30,31]. It can be seen from the figure that the risk level of MP pollution in the northern part of
the study area is low, while the risk level of MP in the southern part of the study is relatively high,
which is related to the distribution of urban functional areas in the study area. The northern functional
area is the central urban area and commercial area and is away from the garbage treatment plant.
Plastic waste that is closer can be processed centrally, so this area is less polluted by MPs. The southern
and eastern regions are non-ferrous metal industrial parks and small workshops. During production
and processing, a large amount of plastic waste is generated and most of it is discharged directly into
the environment without treatment. Therefore, the risk level from MPs in the southern and eastern
regions
      Int. is  relatively
           J. Environ.       high.
                       Res. Public Health 2020, 17, x FOR PEER REVIEW                           10 of 13

      Figure 5. Risk
           Figure 5. degree of MPs
                     Risk degree of in
                                    MPstheinstudy  area. area.
                                              the study  Different  colorscolors
                                                               Different    represent different
                                                                                 represent      polymer
                                                                                           different     risk risk
                                                                                                     polymer  indexes.
            indexes.

            Different from other refractory organic pollutants, the distribution of MPs in soil is uneven.
       Particle size and chemical composition of MPs are important factors affecting their distribution. More
       than 80% of the MPs studies here have similar shape characteristics, so they can be used to compare
       the risk of MPs in different regions. Some studies have also used similar risk assessment methods in
       the MP risk assessment of Shanghai river sediments and Yangtze River Estuary waters, which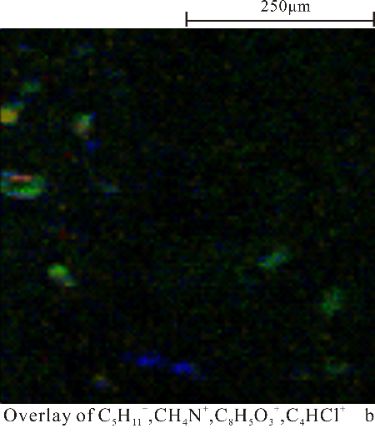
Int. J. Environ. Res. Public Health 2020, 17, 845                                                            10 of 12

      Different from other refractory organic pollutants, the distribution of MPs in soil is uneven.
Particle size and chemical composition of MPs are important factors affecting their distribution. More
than 80% of the MPs studies here have similar shape characteristics, so they can be used to compare
the risk of MPs in different regions. Some studies have also used similar risk assessment methods in
the MP risk assessment of Shanghai river sediments and Yangtze River Estuary waters, which showed
that high chemical toxicity can result in a high environmental risk of MPs [30].
      In view of the chemical properties of MPs, it is believed that polymers are inert and often do not
pose environmental risks to the soil environment [43]. However, plastic is not a single polymer, and
unreacted monomers and other additives exist in plastics that are released into the environment as
plastics decompose, posing a threat to ecosystems and human health. Polymers in MPs may also pose
a threat to the environment. PVC is the most hazardous polymer and one of the most widely used
plastic raw materials, with a global production of about 38.5 million tons [24]. Once PVC enters the
soil, it releases carcinogenic monomers and other additives such as plasticizers, stabilizers, pigments,
thus seriously affecting soil microorganisms and plants. At the same time, MPs also can adsorb POPs
and transfer them to aquatic and terrestrial organisms, resulting in the absorption and storage of POPs
in organisms to produce a complex ecological effect [44,45].
      To date, MP contamination of terrestrial soils has not been part of environmental risk assessment.
With the increasingly serious problem of MP pollution, the analysis of its distribution characteristics
will help to better assess the environmental risk of MP, while gradually improved risk assessment
methods and indicators will help to fully understand its impact on the ecological environment and on
human health [30,46].

4. Conclusions
      In this study, four kinds of MPs (PP, PVC, PET, PA6) in the surface soil of Baoding Suburbs were
characterized by TOF-SIMS, and their pollution risks were preliminarily assessed. Twelve surface soil
samples from various functional areas contained different degrees of MPs. The particle size of MPs in
this area is mainly between 0 and 10 µm, and PA6 and PET account for the highest proportion. PVC is
an important source of high pollution risk for MPs. According to the chemical risk assessment index
for MP, non-ferrous metal industrial parks and small workshops were identified as the most polluted
areas, reaching the highest risk level of V. Meanwhile, this study shows that the risk level of MP
pollution is closely related to human production activities, and the region should be closely monitored.
At the same time, MP evaluation indicators still need to be increased, which is the basis of future risk
assessment. It is suggested that the academic circles should carry out the work on environmental risks
of MPs as soon as possible to help control MPs pollution.

Author Contributions: Conceptualization, H.L. and C.D.; methodology, H.L., Z.L. and C.D.; software, C.D.;
validation, Z.L. and C.D.; formal analysis, C.D.; investigation, J.G.; resources, H.L., Z.L. and J.G.; data curation,
C.D.; writing—original draft preparation, C.D.; writing—review and editing, H.L. and Z.L.; visualization, C.D.;
project administration, H.L. and Z.L. All authors have read and agreed to the published version of the manuscript.
Funding: This work was supported by the National Nature Science Foundation of China (Nos. 41772157
and 41371449).
Acknowledgments: Thanks to Fang Qiao, Du Jingzhou, Du Hongwei, Yuan Huijie, and Sun Xiaoyao for their
support for this research.
Conflicts of Interest: The authors declare no conflict of interest.

References
1.    Wagner, M.; Scherer, C.; Alvarez-Muñoz, D. Microplastics in freshwater ecosystems: What we know and
      what we need to know. Environ. Sci. Eur. 2014, 26, 12. [CrossRef]
2.    Van, C.L.; Vanreusel, A.; Mees, J. Microplastic pollution in deep-sea sediments. Environ. Pollut. 2013, 182,
      495–499.
Int. J. Environ. Res. Public Health 2020, 17, 845 11 of 12
3. Arthur, C.; Baker, J.E.; Bamford, H.A. Proceedings of the International Research Workshop on the Occurrence,
Effects, and Fate of Microplastic Marine Debris; University of Washington Tacoma: Tacoma, WA, USA, 2009.
4. Zhang, K.; Su, J.; Xiong, X. Microplastic pollution of lakeshore sediments from remote lakes in Tibet plateau,
China. Environ. Pollut. 2016, 219, 450–455. [CrossRef] [PubMed]
5. Rocha, S.T.; Duarte, A.C. A critical overview of the analytical approaches to the occurrence, the fate and the
behavior of microplastics in the environment. Trends Anal. Chem. 2015, 65, 47–53. [CrossRef]
6. Andrady, A.L. Microplastics in the marine environment. Mar. Pollut. Bull. 2011, 62, 1596–1605. [CrossRef]
[PubMed]
7. Ivar do Sul, J.A.; Costa, M.F. The present and future of microplastic pollution in the marine environment.
Environ. Pollut. 2014, 185, 352–364. [CrossRef] [PubMed]
8. Van, C.L.; Devriese, L.; Galgani, F. Microplastics in sediments: A review of techniques, occurrence and effects.
Mar. Environ. Res. 2015, 111, 5–17.
9. Thompson, R.C.; Olsen, Y.; Mitchell, R.P. Lost at sea: Where is all the plastic? Science 2004, 304, 838. [CrossRef]
10. Hirai, H.; Takada, H.; Ogata, Y. Organic micropollutants in marine plastics debris from the open ocean and
remote and urban beaches. Mar. Pollut. Bull. 2011, 62, 1683–1692. [CrossRef]
11. Law, K.L.; Morét-Ferguson, S.E.; Goodwin, D.S. Distribution of surface plastic debris in the eastern Pacific
Ocean from an 11-year data set. Environ. Sci. Technol. 2014, 48, 4732–4738. [CrossRef]
12. Liu, M.; Lu, S.; Song, Y. Microplastic and mesoplastic pollution in farmland soils in suburbs of Shanghai,
China. Environ. Pollut. 2018, 242, 855–862. [CrossRef] [PubMed]
13. Zhang, G.S.; Liu, Y.F. The distribution of microplastics in soil aggregate fractions in southwestern China.
Sci. Total Environ. 2018, 642, 12–20. [CrossRef] [PubMed]
14. He, D.; Luo, Y.; Lu, S. Microplastics in soils: Analytical methods, pollution characteristics and ecological
risks. Trends Anal. Chem. 2018, 109, 163–172. [CrossRef]
15. Dris, R.; Gasperi, J.; Saad, M. Synthetic fibers in atmospheric fallout: A source of microplastics in the
environment? Mar. Pollut. Bull. 2016, 104, 290–293. [CrossRef] [PubMed]
16. Wang, W.; Ndungu, A.W.; Li, Z. Microplastics pollution in inland freshwaters of China: A case study in
urban surface waters of Wuhan, China. Sci. Total Environ. 2017, 575, 1369–1374. [CrossRef] [PubMed]
17. Sobhani, Z.; Al, A.M.; Naidu, R. Identification and visualisation of microplastics by Raman mapping.
Anal. Chim. Acta. 2019, 1077, 191–199. [CrossRef] [PubMed]
18. Zhou, Q.; Zhang, H.; Fu, C. The distribution and morphology of microplastics in coastal soils adjacent to the
Bohai Sea and the Yellow Sea. Geoderma 2018, 322, 201–208. [CrossRef]
19. Fries, E.; Dekiff, J.H.; Willmeyer, J. Identification of polymer types and additives in marine microplastic
particles using pyrolysis-GC/MS and scanning electron microscopy. Environ. Sci-Proc. Imp. 2013, 15,
1949–1956. [CrossRef]
20. Jungnickel, H.; Pund, R.; Tentschert, J. Time-of-flight secondary ion mass spectrometry (ToF-SIMS)-based
analysis and imaging of polyethylene microplastics formation during sea surf simulation. Sci. Total Environ.
2016, 563, 261–266. [CrossRef]
21. Du, C.; Liang, H.D.; Li, Z.P.; Gong, J. ToF-SIMS characterization of microplastics in soils. Surf. Interface Anal.
2020. [CrossRef]
22. Wilcox, C.; Van Sebille, E.; Hardesty, B.D. Threat of plastic pollution to seabirds is global, pervasive, and
increasing. Proc. Natl. Acad. Sci. USA 2015, 112, 11899–11904. [CrossRef] [PubMed]
23. Schuyler, Q.A.; Wilcox, C.; Townsend, K.A. Risk analysis reveals global hotspots for marine debris ingestion
by sea turtles. Glob. Chang. Biol. 2016, 22, 567–576. [CrossRef] [PubMed]
24. Lithner, D.; Larsson, Å.; Dave, G. Environmental and health hazard ranking and assessment of plastic
polymers based on chemical composition. Sci. Total Environ. 2011, 409, 3309–3324. [CrossRef] [PubMed]
25. Geyer, R.; Jambeck, J.R.; Law, K.L. Production, use, and fate of all plastics ever made. Sci. Adv. 2017, 3,
e1700782. [CrossRef] [PubMed]
26. Elert, A.M.; Becker, R.; Duemichen, E. Comparison of different methods for MP detection: What can we
learn from them, and why asking the right question before measurements matters? Environ. Pollut. 2017,
231, 1256–1264. [CrossRef]
27. Bond, T.; Ferrandiz-Mas, V.; Felipe-Sotelo, M. The occurrence and degradation of aquatic plastic litter based
on polymer physicochemical properties: A review. Environ. Sci. Technol. 2018, 48, 685–722. [CrossRef]Int. J. Environ. Res. Public Health 2020, 17, 845 12 of 12
28. David, J.; Weissmannová, H.D.; Steinmetz, Z. Introducing a soil universal model method (SUMM) and
its application for qualitative and quantitative determination of poly (ethylene), poly (styrene), poly
(vinyl chloride) and poly (ethylene terephthalate) microplastics in a model soil. Chemosphere 2019, 225,
810–819. [CrossRef]
29. Yuan, W.; Liu, X.; Wang, W. Microplastic abundance, distribution and composition in water, sediments, and
wild fish from Poyang Lake, China. Ecotoxicol. Environ. Saf. 2019, 170, 180–187. [CrossRef]
30. Peng, G.; Xu, P.; Zhu, B. Microplastics in freshwater river sediments in Shanghai, China: A case study of risk
assessment in mega-cities. Environ. Pollut. 2018, 234, 448–456. [CrossRef]
31. Xu, P.; Peng, G.; Su, L. Microplastic risk assessment in surface waters: A case study in the Changjiang Estuary,
China. Mar. Pollut. Bull. 2018, 133, 647–654. [CrossRef]
32. Nor, N.H.M.; Obbard, J.P. Microplastics in Singapore’s coastal mangrove ecosystems. Mar. Pollut. Bull. 2014,
79, 278–283. [PubMed]
33. Zubris, K.A.V.; Richards, B.K. Synthetic fibers as an indicator of land application of sludge. Environ. Pollut.
2005, 138, 201–211. [CrossRef] [PubMed]
34. Fischer, E.K.; Paglialonga, L.; Czech, E. Microplastic pollution in lakes and lake shoreline sediments—A
case study on Lake Bolsena and Lake Chiusi (central Italy). Environ Pollut. 2016, 213, 648–657. [CrossRef]
[PubMed]
35. Mintenig, S.M.; Int-Veen, I.; Löder, M.G.J. Identification of microplastic in effluents of waste water treatment
plants using focal plane array-based micro-Fourier-transform infrared imaging. Water Res. 2017, 108, 365–372.
[CrossRef]
36. Mahon, A.M.; O’Connell, B.; Healy, M.G. Microplastics in sewage sludge: Effects of treatment. Environ. Sci.
Technol. 2016, 51, 810–818. [CrossRef]
37. Tang, G.; Liu, M.; Zhou, Q. Microplastics and polycyclic aromatic hydrocarbons (PAHs) in Xiamen coastal
areas: Implications for anthropogenic impacts. Sci. Total Environ. 2018, 634, 811–820. [CrossRef]
38. Cai, M.; He, H.; Liu, M. Lost but can’t be neglected: Huge quantities of small microplastics hide in the
South China Sea. Sci. Total Environ. 2018, 633, 1206–1216. [CrossRef]
39. Tiwari, M.; Rathod, T.D.; Ajmal, P.Y. Distribution and characterization of microplastics in beach sand from
three different Indian coastal environments. Mar. Pollut. Bull. 2019, 140, 262–273. [CrossRef]
40. Bläsing, M.; Amelung, W. Plastics in soil: Analytical methods and possible sources. Sci. Total Environ. 2018,
612, 422–435. [CrossRef]
41. Remy, F.; Collard, F.; Gilbert, B. When microplastic is not plastic: The ingestion of artificial cellulose fibers by
macrofauna living in seagrass macrophytodetritus. Environ. Sci. Technol. 2015, 49, 11158–11166. [CrossRef]
42. Zettler, E.R.; Mincer, T.J.; Amaral-Zettler, L.A. Life in the “plastisphere”: Microbial communities on plastic
marine debris. Environ. Sci. Technol. 2013, 47, 7137–7146. [CrossRef] [PubMed]
43. Matlack, A.S. Introduction to Green Chemistry; Marcel Dekker Inc.: New York, NY, USA, 2001.
44. Pedà, C.; Caccamo, L.; Fossi, M.C. Intestinal alterations in European sea bass Dicentrarchus labrax (Linnaeus,
1758) exposed to microplastics: Preliminary results. Environ. Pollut. 2016, 212, 251–256. [CrossRef] [PubMed]
45. Canesi, L.; Ciacci, C.; Bergami, E. Evidence for immunomodulation and apoptotic processes induced by
cationic polystyrene nanoparticles in the hemocytes of the marine bivalve Mytilus. Mar. Environ. Res. 2015,
111, 34–40. [CrossRef] [PubMed]
46. Koelmans, A.A.; Besseling, E.; Foekema, E. Risks of plastic debris: Unravelling fact, opinion, perception, and
belie. Environ. Sci. Technol. 2017, 51, 11513–11519. [CrossRef]
© 2020 by the authors. Licensee MDPI, Basel, Switzerland. This article is an open access
article distributed under the terms and conditions of the Creative Commons Attribution
(CC BY) license (http://creativecommons.org/licenses/by/4.0/).You can also read