QUANTITATIVE AND QUALITATIVE FACTORS FOR PSPS DECISION-MAKING
←
→
Page content transcription
If your browser does not render page correctly, please read the page content below
QUANTITATIVE AND QUALITATIVE FACTORS
                                        FOR PSPS DECISION-MAKING
                                        May 2021; First Revision August 31, 2021

As the severity and frequency of wildfires in California continues to grow,1 the state’s utilities, including
Southern California Edison, have implemented Public Safety Power Shutoffs (PSPS) to reduce the risk
of electrical infrastructure igniting a significant wildfire. SCE’s core objective is to keep customers safely
energized, which is why PSPS remains a tool of last resort. We forecast with as much granularity as
possible and then work to reduce the number of customers impacted.

Customer impacts are reduced by de-energizing
only when necessary, based on real-time weather
reporting; isolating only those circuits that present
                                                                                REDUCING THE NEED FOR
significant risk; moving customers between circuits                             PUBLIC SAFETY POWER
(sectionalization) and turning off specific segments                            SHUTOFFS
while keeping other segments of the same circuit                                Concurrent with the work that SCE is doing
energized (segmentation).                                                       to reduce the number of customer impacts
                                                                                from PSPS, we are increasing grid resiliency
We use preset thresholds for dangerous wind                                     in high fire risk areas through grid hardening
speeds, low humidity and dry fuels as the basis of                              measures. The more resilient grid (described
our decision-making. These thresholds are set for                               in our Wildfire Mitigation Plan) will help reduce
each of the circuits in high fire risk areas (HFRAs)                            the risk of utility equipment sparking significant
and are continuously reviewed to calibrate the risk                             wildfires and the need for PSPS.
of significant events against the potential for harm
to customers from the loss of power.                                            Since 2018, SCE has replaced more than
                                                                                2,000 circuit miles of bare wire with covered
In 2021, based on an examination of 26 years of                                 conductor, with additional miles in progress.
historical fire activity, SCE updated its thresholds                            Covered conductor should prevent ignitions
for all but one fire climate zone within our service                            associated with objects or vegetation
area.                                                                           contacting power lines or conductor-to-
                                                                                conductor contact.
Simultaneously, grid hardening efforts, including
replacing bare wire with covered conductor (see                                 Additional grid hardening activities since 2018
box, right), are reducing ignition risk and thereby                             include the installation of 100 sectionalizing
allowing SCE to raise thresholds on many of the                                 devices, more than 7,500 fire-resistant poles
circuits most frequently impacted in the 2019 and                               and more than 13,000 fast-acting fuses.
2020 fire seasons.*

* For simplicity, we are referring to the last fire season as the “2020 fire season” although it includes the PSPS event from
Jan. 12 to 21, 2021.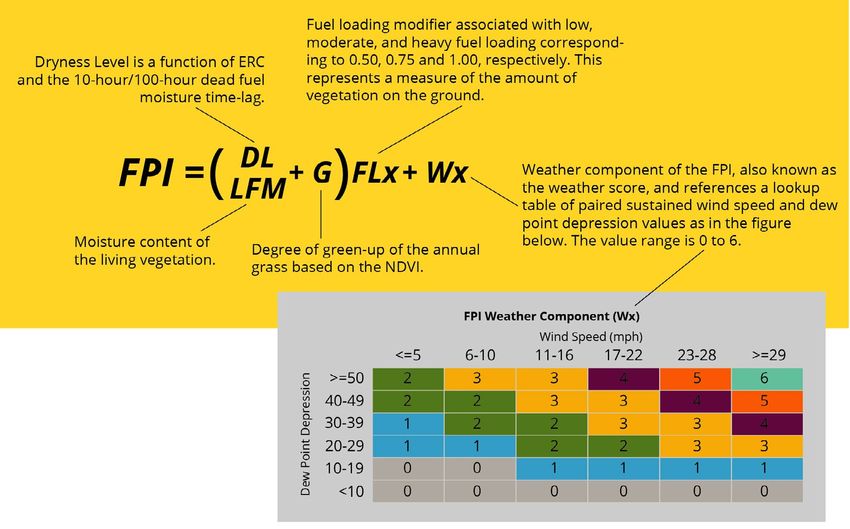
Quantitative and Qualitative Factors for PSPS Decision Making

DECISION-MAKING
PSPS decisions are based on quantitative analyses while accounting for qualitative factors such as societal and
emergency management impacts.

SCE makes PSPS decisions predominantly at the distribution grid level. Decision-making for transmission-level
de-energization is not covered in this paper.

THRESHOLDS
All circuits have an activation threshold, defined by the Fire Potential Index (FPI) and the wind speed
at which they are considered at risk. Activation thresholds are computed for each circuit for the season.
For each PSPS event, every circuit also has a de-energization threshold. De-energization thresholds
are determined separately for each circuit to prioritize circuits for de-energization based on the specific
risks of the event. This is particularly important for large events where many circuits must be evaluated
simultaneously. The baseline activation thresholds for each of the high fire risk area circuits are included in
the online appendix.

            SCE PSPS TERMINOLOGY
            Consequence score: Used to quantify risk in decision-making

            Incident commanders: All decision-making in PSPS events is authorized by an
            incident commander, who represents the company and undergoes continuous
            training in PSPS response.

            Incident Management Team: SCE follows principles of the National Incident
            Management System and components of the Standardized Emergency
            Management System during PSPS events. This includes using an Incident
            Management Team structure to execute PSPS events.

            In-Event Risk Calculation: A decision-making tool that assesses and compares
            potential public safety risk (PSPS risk) and the benefit of de-energization (wildfire
            risk) 24 hours out from the start of the period of concern.

            In scope: Circuits at risk are deemed to be in scope when they are at risk for
            reaching event risk thresholds.

            Monitored circuit list: Circuits in scope are listed and prioritized and each circuit
            has a specific time range for which it is forecasted to be of concern.

            Period of concern: The forecasted period, including start and end time, as
            measured in three-hour time blocks.

            REST Service (Representational state transfer): A software architecture we use
            to share GIS maps with public agencies.

        2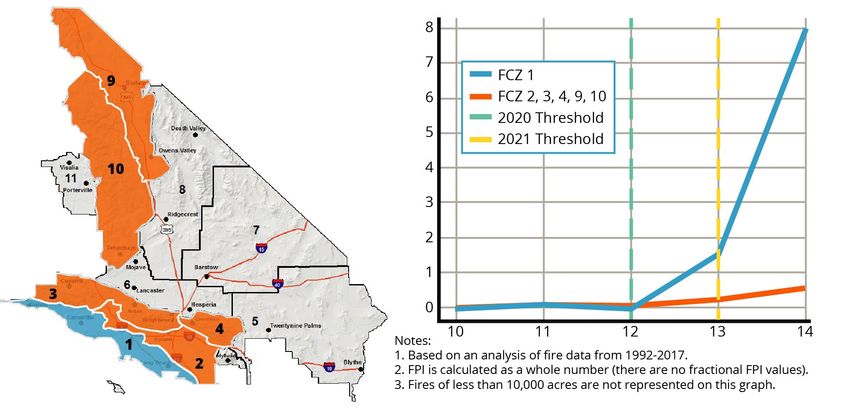
FIRE POTENTIAL INDEX
FPI estimates the likelihood of a spark turning into a major wildfire. FPI uses a whole-number scale with a
range from 1 to 17 and are categorized as normal (1-11), elevated (12-14) and extreme (15+). Historical FPI and
state and federal fire data shows that the most severe fires in terms of number of acres damaged occur at the
higher levels of FPI (FPI is calculated using the following inputs (Figure 1):

• Wind speed—Sustained wind velocity at 6 meters above ground level.

• Dew point depression—The dryness of the air as represented by the difference between air temperature
  and dew point temperature at 2 meters above ground level.

• Energy release component (ERC)—“The available energy (BTU) per unit area (square foot) within the
  flaming front at the head of a fire … reflects the contribution of all live and dead fuels to potential fire
  intensity.”2

• 10-hour dead fuel moisture—A measure of the amount of moisture in ¼-inch diameter dead fuels, such
  as small twigs and sticks.

• 100-hour dead fuel moisture—A measure of the amount of moisture in 1-to 3-inch diameter dead fuels,
  i.e., dead, woody material such as small branches.

• Live fuel moisture—A measure of the amount of moisture in living vegetation.

• Normalized Difference Vegetation Index (NDVI)—“… used to quantify vegetation greenness and is
  useful in understanding vegetation density and assessing changes in plant health.”3

                                                                                  Figure 1: Fire Potential Index Equation4

                                                                                                         3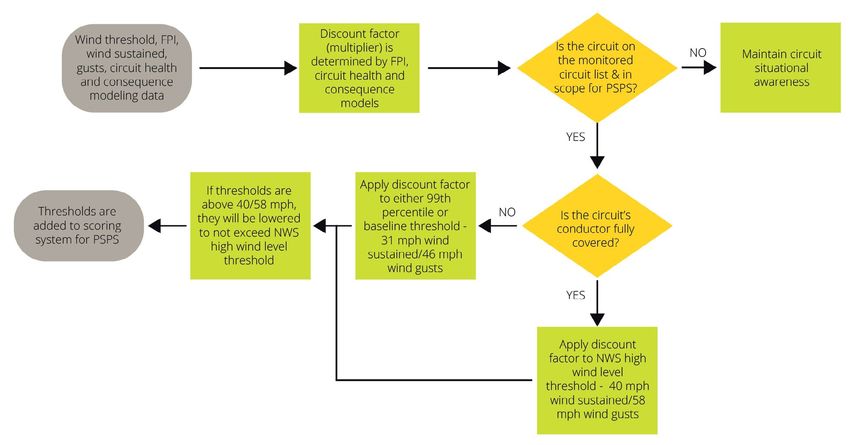
Quantitative and Qualitative Factors for PSPS Decision Making

The variables used to generate the FPI score come from the Weather Research and Forecasting (WRF) model5,
which has been customized for SCE to replicate our specific geography and weather conditions. Individual
components of the FPI score are forecast hourly for each 2 km by 2 km grid cell. The model is run twice
a day and provides an hourly forecast for five days forward. The forecasts associated with each of the FPI
components for each grid cell are then summarized by circuit for three-hour intervals.

The forecasted FPI is further refined and calibrated by integrating model guidance from multiple public
sources such as sampling from fire agencies and proprietary data. These refined FPI values are used to
determine which circuits are forecast to breach PSPS thresholds during the event, and the values are
recorded on SCE’s monitored circuit list. In many cases, SCE’s meteorologists and operations experts further
refine these initial estimated FPI values in real time during the period of concern, based on actual weather
observations.

Previously, SCE set the activation threshold at the FPI of 12. Starting on September 1, 2021, SCE has set the
FPI at 13 for most areas and most events based on a risk analysis of historical fire data.6 Exceptions in which
the FPI threshold will continue to be set at 12 include:

• Fire Climate Zone 1 (FCZ1) (Coastal region) — The threshold for FCZ1 is staying at 12 because
  probability calculations indicated a significantly higher ignition risk factor at an FPI threshold of 13 for this
  FCZ than for the other FCZs (2, 3, 4, 9, and 10). (Figure 2)

• Geographic Area Coordination Center (GACC) preparedness level of 4 or 5 — The GACC coordinates
  multiple federal and state agencies to track and manage regional fire resources. It provides a daily
  fire preparedness level on a score of 1-5. A high score signals that there could be resource issues in
  responding to a fire.

• Circuits located in an active Fire Science Area of Concern (AOC) — AOCs are areas within FCZs that
  are at high risk for fire with significant community impact. This designation is based on factors that are
  common to FPI as well as egress, fire history, and fire consequence. Further details about AOCs can be
  found in SCE’s Wildfire Mitigation Plan.7

                             Figure 2: The
                             probability of wind-driven
                             fires of 10,000+ acres at
                             FPI 12 and 13, based on
                             backcast FPI calculations.

         4
WIND SPEED
SCE considers the lower of the National Weather Service’s (NWS) wind advisory levels (defined as
31 mph sustained wind speed and 46 mph gust wind speed) or the 99th percentile of historical
wind speeds to set activation thresholds for each circuit. The wind advisory level is chosen
because debris or vegetation is likely to become airborne as described by the Beaufort Wind
Scale,8 while a circuit’s 99th percentile wind speeds represent extreme and unusual wind activity
for the area.* There are a handful of circuits that have legacy thresholds below the NWS advisory
level because they have a history of local circuit outages at lower wind speeds.

CALCULATING DE-ENERGIZATION THRESHOLDS
De-energization thresholds account for circuit health, including any outstanding maintenance
and issues identified through patrols,9 and are also informed by a consequence score for
each specific high fire risk area. The consequence score estimates the impact of an ignition on
communities. The higher the score, the greater the risk to a particular location from wildfires.
SCE’s process for calculating de-energization thresholds is outlined in Figure 3 below.

    Figure 3: De-Energization
    Threshold Flowchart

If actual conditions suggest more risk, or in large-scale events when many circuits are under
consideration for shutoffs, the de-energization thresholds may be lowered (discounted),
meaning power on a circuit will be turned off at lower wind speeds. This step prioritizes the
circuits that represent the highest risk to be evaluated for de-energization before circuits at
lower risk.

Conversely, de-energization thresholds are raised for segments or circuits that have had covered
conductor installed. The de-energization threshold for segments with covered conductor is
40 mph sustained/58 mph gusts which aligns with the National Weather Service high wind
warning level for windspeeds at which infrastructure damage may occur. Other factors, such as
maintenance issues, could lower the thresholds for specific events.

*
    top 1% each year, based on 10 years of data

        Southern California Edison, August 2021                                                    5
Quantitative and Qualitative Factors for PSPS Decision Making
TOOLS AND TECHNOLOGIES
To better inform PSPS decision-making, SCE has invested in tools, technologies and practices to improve
forecasting. In 2020, two super computers produced twice-daily, high-resolution weather and fuel modeling
forecasts for the more than 1,100 distribution circuits in SCE’s high fire risk areas. (Two additional super
computers and machine learning technology will improve forecasting accuracy in 2021.) The models resolve
the complex flows that occur in California’s mountainous topography.
PRE-PLANNING (PRIOR TO WILDFIRE SEASON)
PSPS preparedness activities take place year-round. Pre-planning work includes establishing circuit-specific
FPI and wind speed thresholds for activation, reviewing circuits for fuel risk and developing process and tool
enhancements, such as updating circuit switching plans for circuits in high fire risk areas.
CIRCUIT SEGMENT REVIEWS
We use an exception review process to remove circuit segments from consideration for PSPS when the
wildfire risk is temporarily or permanently abated. An example would be a portion of a circuit traversing a
recent burn scar where there is little or no vegetation remaining to pose an ignition risk. Circuit segment
exceptions are identified when SCE begins preparing detailed designs for grid hardening activities or through
specific feedback received from the field. This process is further informed by field teams who have current
knowledge of changing conditions in specific areas.
A review team composed of SCE experts from PSPS operations, fire science and risk management
evaluates each circuit segment’s unique characteristics (e.g., construction type, outage history) and location
characteristics (e.g., fuel quantity, fuel type, fuel dryness, fuel age and history of fires in the area) to assess the
fire risks associated with that segment. Through the circuit exception review process, SCE has removed more
than 31,000 customers on 26 circuits from consideration for PSPS in 2020 that had been at risk in 2019. We
are continuing to review circuits to further reduce PSPS impacts as part of our PSPS Action Plan for 2021.
SWITCHING PLAN DEVELOPMENT
Every circuit in SCE’s high fire risk area has ties to other circuits. This provides flexibility to potentially
isolate customers from high fire risk areas to minimize customer impacts to the smallest extent possible.
SCE develops switching plans to determine whether circuit segments could be transferred using field
isolation devices. Individual circuits could have one or more switching plans to account for different weather
conditions. These switching plans are used for all circuits under consideration in an event and customers can
be switched both before and during events. Switching plans can be used in some situations to remove critical
infrastructure from circuits under consideration for shutoff.
The switching plans include mapping the location of isolation devices, associated weather stations, mapping
of any underground circuit sections and description of areas of the circuit where circuit exceptions may
be applied where the conditions are not conducive to a fire start (e.g., area has covered conductor, paved
roadways or no vegetation).
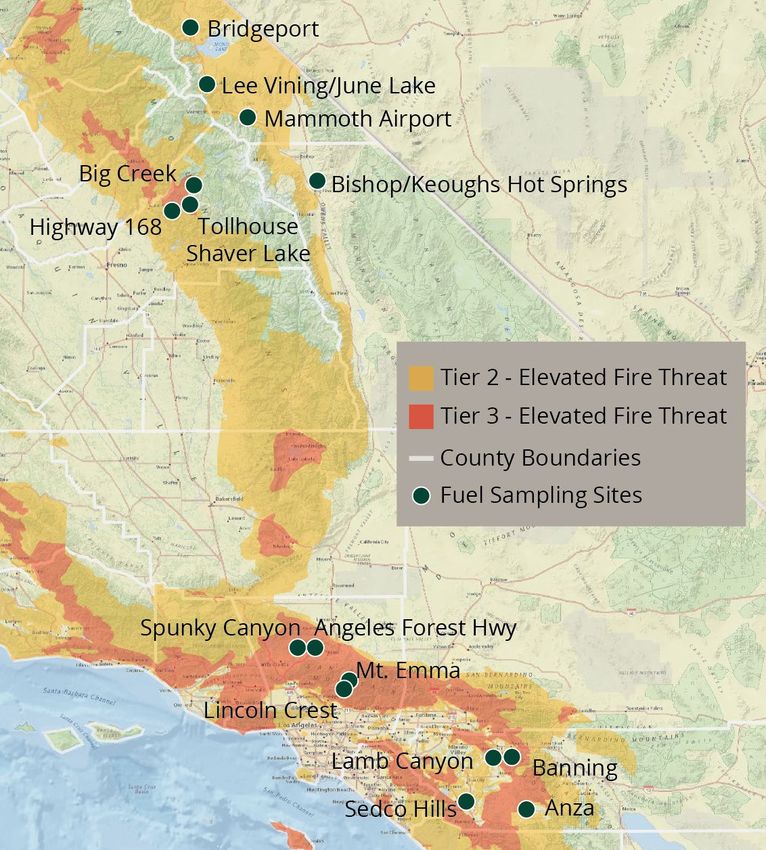
6FUEL MOISTURE ANALYSIS
Live fuel moisture observations
are obtained biweekly, year-round
(weather permitting) to determine
inputs for FPI calculations. Fifteen
sites are sampled in four fire-
prone geographic areas: the
eastern Sierra (along Highway
395), the western Sierra, northern
Los Angeles County and the
Inland Empire (Figure 4).
Samples of native vegetation from
each of the 15 sites are weighed, Figure 4:
SCE’s 15 Fuel Sampling Sites
dried and then weighed again
to determine the vegetation’s
moisture content. This field
research targets the areas that
have the greatest fire potential.
The data from this fuel sampling
program is used to develop and
train machine-learning models to
estimate live fuel moisture, which
serves as one of the inputs into
the FPI. SCE also uses the data
to calibrate FPI by improving the
accuracy of the high-resolution
weather and fuel modeling output
from weather vendor American Digital Systems.
Dead fuel moisture factors into the dryness level in the FPI in both 10-hour and 100-hour measures. It is
calculated twice daily using the field sample data and a series of mathematical algorithms that account for
precipitation as well as the diurnal variability that occurs with temperature and relative humidity.
EVENT PLANNING (FOUR TO FIVE DAYS PRIOR TO POTENTIAL
SHUTOFF)
At five days before potential weather events, the meteorologists and fire science team can review the
first model run of twice-daily weather and fuel forecasts from SCE’s super computers to determine if
established thresholds are expected to be breached.
No customers are notified at this point, given the uncertainty of longer-range forecasting.
IMT ACTIVATION (ONE TO THREE DAYS PRIOR TO EXPECTED
SHUTOFF)
If forecasts predict that thresholds will be breached within one to three days, the team facilitates a forecast
weather call to activate the IMT under the authorization of the incident commander.
The meteorologists produce a monitored circuit list and an associated period of concern table. The table
includes a specific forecast start and end time for each circuit, broken down in three-hour time blocks.
7Quantitative and Qualitative Factors for PSPS Decision Making
Additional quantitative and qualitative factors are monitored in real time once circuits are identified.
As the event gets closer, the initial monitored circuit list and period of concern table are validated by the
meteorologists and the fire science team. They improve the raw model using forecasting experience, other
weather models and pattern recognition.
The Advanced Circuit Evaluation (ACE) team — a team of SCE engineers and analysts — develops individual
de-energization thresholds for each circuit segment for the event based on the pre-assigned activation
thresholds. The team assesses circuit conditions and identifies any potential issues that need to be resolved.*
EVENT MANAGEMENT PLANNING
The IMT, under the incident commander, makes staffing and resource decisions (See Complexity Factors,
Table 1) and develops a unique event management plan. The plan details the de-energization thresholds and
cadence of decision-making based on the complexity of the event and situational information. Managing to
the plan allows the PSPS team sufficient time to process simultaneous de-energizations when multiple circuits
might approach de-energization thresholds in parallel. For small scale events (up to 30 circuits in scope and
limited complexity), an event management plan allows us the flexibility to make individual segment decisions
as late as possible.
Table 1: Complexity Factors
Criteria Impacts
Number of distribution Increased number of customer and public safety partner notifications
circuits in scope (primary requires coordination to ensure alignment between functional groups.
circuits)
Sub-transmission circuits De-energizing sub-transmission circuits could potentially create significant
in scope customer impacts and local SCE-system reliability issues.
Transmission circuits in Potential for significant customer impacts and reliability issues.
scope
Significant number of 1. Requires additional staffing to support higher volume of individual
circuits forecasted to de-energization decisions at the circuit segment level.
exceed de-energization 2. Stresses resource availability to manage restoration in the field.
thresholds
Large number of counties/ Increases resource needs. Overextends customer care resources.
large geographic spread
Large customer count Increases demand on customer care resources.
Customer demographics A high number of access and functional needs customers and/or critical
infrastructure providers increases level of support provided by SCE.
Complex/concurrent Intersecting impacts such as fires, extreme heat or wind-related outages
incidents require increased coordination with public safety partners.
Multi-day events Multi-day events are a significant burden on impacted customers. Providing
temporary relief requires planning and significant resources in the field.
Number of circuits close Risk of additional circuits that could potentially come into scope and rapidly.
to (below) MCL criteria
threshold
*
There is a small subset of circuits with 99th percentile wind speed values that are significantly higher than the NWS wind advisory cap. In
instances where wind speeds are forecast to exceed the activation threshold but are not expected to come within proximity of the 99th
percentile value, the incident commander may elect not to activate the PSPS protocol. We may dispatch field crews to observe the circuits
for possible debris fly-ins but may not activate PSPS due to the low probability of reaching de-energization threshold values.
8PRE-PATROLS IN THE FIELD
Where possible, every circuit in scope is patrolled before the arrival of the forecasted weather, unless it was
already patrolled within the previous seven days. Crews visually inspect the entire length of each circuit to find
any imminent hazards that require immediate remediation and provide additional up-to-date intelligence on
field conditions. If maintenance concerns are discovered on a circuit in scope, repairs are expedited
(if possible) before the impending wind event.
COORDINATION
SCE meets with local governments, the emergency
management community and first responders to
inform them about the event, including the location of “The wildfire risks that are
circuits in scope in their jurisdictions, and to discuss reduced through PSPS must
any public safety concerns that should be taken into be balanced against the
account.
potential public safety risks
Situational awareness notifications are sent to local and that are introduced by a
county jurisdictions, public safety partners and critical temporary loss of power.
infrastructure providers starting at three days out.
SCE maintains transparent
CUSTOMER NOTIFICATIONS coordination with
Customer notifications begin 24-48 hours ahead of the emergency management
forecasted weather event. Because these notifications
are based on two-day-ahead forecasting at the
officials and other public
circuit level, they lack the precision of later, in-event safety partners leading up
notifications, which will be based on real-time weather to and during PSPS events.”
readings at the segment level. They also do not reflect
in-event efforts to sectionalize circuits to reduce
customer de-energizations.
IN-EVENT RISK CALCULATION
A new in-event calculator provides an event-based quantitative comparison of risk scores to inform de-
energization decision making. The PSPS risk and the benefit of de-energization (wildfire risk) are modeled
independently and provided to incident commanders 24 hours in advance of the period of concern. This
calculator is also documented in the post-event reports required by Resolution ESRB-8.
IN-EVENT DECISION-MAKING
Three to six hours before the winds are forecasted to meet de-energization thresholds, the PSPS IMT moves
from forecasting to real-time weather monitoring, using SCE’s 1,050 field weather stations and other public
weather stations. Every 10 minutes, SCE weather station readings are updated for each circuit. Meteorologists
compare the forecast conditions to the actual conditions to identify trends that could suggest whether wind
speeds are increasing or decreasing.
LIVE FIELD OBSERVATIONS
Live field observers are stationed at every circuit in scope, at least two hours before the forecasted start of
the event (when feasible). Observers are trained SCE employees who monitor circuits for any possible signs
of failure and for environmental conditions that could accelerate the need to turn off power, such as potential
for damage from wind gusts, airborne vegetation or other flying debris. Field crews also use handheld
weather stations to provide field condition readings to supplement information from fixed weather stations.
9Quantitative and Qualitative Factors for PSPS Decision Making
ACE TEAM DECISION-MAKING PROCESS
The ACE team activates circuit switching plans to reduce the number of customers who lose power.
In-event data is gathered on a master database populated with the de-energization threshold of each circuit
segment and auto-populated every 10 minutes with updated wind speeds from circuit-specific weather
stations. Field input is provided to the team in real time to inform decisions. As a circuit, or segment of a
circuit approaches its de-energization threshold, this team will recommend shutoffs. The incident commander
will review each unique recommendation and validate using additional data, such as field reports, if necessary,
before approving the decision.
IMMINENT DE-ENERGIZATION NOTIFICATIONS
In addition to other notification requirements, CPUC guidelines require notifying all customers one to
four hours in advance of power shutoffs, if possible. Predicting when this window will occur in advance of
changing weather conditions can be challenging. Notifying customers too early may result in over-notification:
customers may receive a warning of de-energization but not lose power if wind speeds do not reach
forecasted conditions. Conversely, waiting until wind speeds pick up significantly can result in missing this
window and not providing customers advance notice before a power shutoff. For the 2021 fire season, we
continue to refine the timing and content of our notifications to be more effective.
ADDRESSING PUBLIC SAFETY CONCERNS
The wildfire risks that are reduced through PSPS must be balanced against the potential public safety risks
that are introduced by a temporary loss of power. SCE maintains transparent coordination with emergency
management officials and other public safety partners leading up to and during PSPS events. The PSPS
team considers how best to manage de-energizations that may impact public safety and determines if any
mitigating actions can be taken to reduce the associated risk. Mitigating actions may include sectionalizing
lines to minimize the amount of the line that is de-energized or temporarily providing a backup generation
source to a critical facility.
Information is provided to public safety partners through a notification sequence managed by the liaison
officers and enhanced by access to REST service maps. Starting in June 2021, an online public safety partner
portal will provide these partners with enhanced and simplified access to information. Public safety partners
have been consulted on the development of the new public safety partner portal.
Requests to delay de-energization or re-energize circuits are addressed on a case-by-case basis. Potential
reasons to delay the de-energization of a circuit could include the need to power water pumps for fire
suppression, evacuations in progress and critical facilities that are not equipped with sufficient backup
generation.* These requests may come from fire agencies or from other emergency management agencies
during an event. The incident commander has the final authority to determine a response for SCE.
PATROL AND RE-ENERGIZATION
The ACE team continues to monitor all circuits that are de-energized and watches for winds to decrease
below thresholds, which will trigger patrol for reenergization. For multiday events, with gaps of even a few
hours, field crews will attempt to restore customers before the second period of concern begins, even if this
will require a repeat de-energization.
In most cases, field crews are standing by for patrol, which is typically accomplished within eight hours (for
more than 90% of circuits). Some circuits will require foot or helicopter patrol. If possible, customers on
difficult-to-patrol circuits are switched to more accessible circuits for restoration, so that circuits with no
customers on them will be the last in line for restoration.
*
Many critical infrastructure customers are required by law or industry standard to have back-up generation in place to sustain critical
operations during a power outage, regardless of outage type. Other customers not required to have back-up generation are encouraged to
consider adding this capability to meet critical needs that require electricity during a power outage.
10NEXT STEPS FOR PSPS DECISION-MAKING
Lessons learned, customer feedback and the 2021 PSPS Action Plan are informing SCE’s plans for improving
decision-making to better serve our customers and our communities for the 2021 fire season. SCE will:
• Use fire spread predictions to estimate how large fires may grow and what their subsequent impact on
nearby communities may be. Following evaluation, we will incorporate these estimations to clarify the
PSPS geographic coverage to reflect true fire weather conditions more accurately.
• Improve in-house forecasting capabilities to reduce the variance between the customers who are
notified of potential de-energization and the customers who are actually de-energized due to the onset
of increased fire danger conditions, as well as the number of customers who lose power without prior
notification.
• Acquire more computing power to increase resolution of weather and fire potential predictions. This will
include doubling the forecast resolution from 2 km to 1 km, which will allow for more precise weather and
fuels forecasts.
These improvements should result in adjustments to the activation and de-energization thresholds, resulting
in fewer customers losing power because of PSPS. Grid hardening efforts should also reduce the number of
customers who experience a PSPS outage assuming the same weather conditions as 2020.
11Quantitative and Qualitative Factors for PSPS Decision Making
REFERENCES
1. Cal Fire. 2020. “Top 20 Largest California Wildfires.” ca.gov. Nov. 3. Accessed April 14, 2021.
https://www.fire.ca.gov/stats-events/.
Cal Fire. 2020. “Top 20 Most Destructive California Wildfires.” ca.gov. Nov. 3. Accessed April 14, 2021.
https://www.fire.ca.gov/media/t1rdhizr/top20_destruction.pdf.
2. U.S. Department of Agriculture. n.d. “Energy Release Component (ERC) Fact Sheet.” Forest Service.
Accessed April 14, 2021. https://www.fs.usda.gov/Internet/FSE_DOCUMENTS/stelprdb5339121.pdf.
3. U.S. Department of the Interior. n.d. Landsat Normalized Difference Vegetation Index. Accessed April 14,
2021. https://www.usgs.gov/core-science-systems/nli/landsat/landsat-normalized-difference-vegetation-
index?qt-science_support_page_related_con=0#qt-science_support_page_related_con.
4. Fire Potential Index adapted from San Diego Gas & Electric (https://www.sdge.com/sites/default/files/
regulatory/SDGE_Fire_Prevention_Plan_2018.pdf, pages 25-27) and modified to serve SCE’s needs,
including the insertion of the Live Fuel Moisture variable.
5. National Center for Atmospheric Research. 2021. WRF - Weather Research & Forecasting Model.
Accessed April 14, 2021. https://www.mmm.ucar.edu/weather-research-and-forecasting-model.
6. Short, Karen C. 2017. Spatial wildfire occurrence data for the United States, 1992-2015 [FPA_
FOD_20170508]. 4th Edition. Fort Collins, CO: Forest Service Research Data Archive.
https://doi.org/10.2737/RDS-2013-0009.4 Supplemented with 2016-2017 ignition data supplied directly
by CalFIRE via email.
7. Southern California Edison. 2021. 2021 Wildfire Mitigation Plan Update. February 5. Accessed August
26,2021. https://www.sce.com/sites/default/files/AEM/Wildfire%20Mitigation%20Plan/2021/SCE%20
2021%20WMP%20Update.pdf.
8. National Weather Service. 2013. Beaufort Wind Scale. March 5. Accessed April 14, 2021.
https://www.wpc.ncep.noaa.gov/html/beaufort.shtml.
9. California Public Utilities Commission. 2017. General Order 95 Rule 18. Dec. 21. Accessed April 14, 2021.
https://docs.cpuc.ca.gov/PublishedDocs/Published/G000/M215/K830/215830213.PDF.
Online appendix (including May 2021 draft) is
available at SCE.com/PSPSDecisionmakingAppendices
12You can also read