TSUNAMI HAZARD AND RISK IN NEW SOUTH WALES - Supplementary Document to the NSW State Tsunami Plan - NSW SES
←
→
Page content transcription
If your browser does not render page correctly, please read the page content below
TSUNAMI HAZARD AND RISK
  IN NEW SOUTH WALES

  Supplementary Document to the NSW State Tsunami Plan

                          July 2018
CONTENTS
TSUNAMI HAZARD AND RISK IN NEW SOUTH WALES ............. 1
CONTENTS .......................................................................................................... 2
TABLES ............................................................................................................... 3
FIGURES ............................................................................................................. 3
INTRODUCTION ...................................................................................... 4
1.1 WHAT IS A TSUNAMI? ........................................................................................ 4
1.2 TSUNAMI GENERATION ...................................................................................... 5
1.3 CONSEQUENCES OF TSUNAMI ........................................................................... 5
TSUNAMI HAZARD ................................................................................. 6
2.1 NSW TSUNAMI SOURCES ................................................................................... 6
2.2 EARTHQUAKE SOURCES...................................................................................... 6
2.3 VOLCANO SOURCES............................................................................................ 7
2.4 LANDSLIDE SOURCES (LAND AND SUBMARINE)................................................. 7
2.5 METEORITE SOURCES ......................................................................................... 8
2.6 TSUNAMI HISTORY ............................................................................................. 8
2.7 TSUNAMI HAZARD ASSESSMENT ....................................................................... 9
TSUNAMI RISK AND VULNERABILITY......................................................10
3.1 TSUNAMI RISK ..................................................................................................10
3.2 TSUNAMI COMMUNITY VULNERABILITY ..........................................................11
3.3 WARNING AND ARRIVAL TIMES .......................................................................14
ABBREVIATIONS ............................................................................................... 15
GLOSSARY ........................................................................................................ 16
REFERENCES ..................................................................................................... 18
July 2018 Tsunami Hazard and Risk in NSW Page 2TABLES
Table 1: Number of addresses (GURAS) located within modelled tsunami inundation extents (13). .. 11
Table 2: Examples of land and marine based assets and users vulnerable to tsunami. ....................... 12
Table 3: Possible Vulnerable Population in NSW (2011 census) within 1km of coast and below the
10m contour height (AHD). ...................................................................................................... 13
Table 4: Summary List of Modelled Tsunami Scenario Arrival Times (13) ............................................ 14
FIGURES
Figure 1. Location of Plate Boundaries and Subduction Zones (supplied by Geoscience Australia) ...... 7
July 2018 Tsunami Hazard and Risk in NSW Page 3INTRODUCTION
1.1 WHAT IS A TSUNAMI?
A tsunami is a series of ocean waves generated by a sudden displacement of large
volumes of water.
The name, tsunami, comes from Japanese meaning “harbour wave”. In Japanese
tsunami is both a singular and plural word.
Wave type: Tsunami waves involve movement of all water from the seabed to the
surface and differ to wind waves which only move the surface of the water (3). It is
this volume of water under the surface, moving as part of a tsunami that generates
larger force and subsequent damage.
Arrival: Natural warning signs of an approaching tsunami may be provided by:
a. Ground shaking – this may be felt prior to a tsunami due to an earthquake
b. Ocean withdraw – depending on the direction the sea floor moves during the
earthquake, the sea may appear to retreat from the coastline before returning
with the first crest of a tsunami
c. Roaring sounds – noise may be heard with tsunami wave arrival (2).
Behaviour: Tsunami usually involve multiple waves. The first wave may not be the
largest. Tsunami can wrap around headlands or islands and damage coasts which
do not directly face the tsunami wave. Tsunami impacting on harbours and bays can
create damaging wave activity and currents (1).
Inundation and Run-up: Tsunami inundation is dependent on the configuration of
the coastline, the shape of the ocean floor, reflection of waves, tides and wind
waves. Narrow bays, inlets and estuaries may cause funneling effects that increase
the inundation area. The combination of these factors means that the inundation
produced by a tsunami can vary greatly from place to place over a short distance. It
also means that predicting the extent of inundation is very difficult. Run-up is
defined as the highest point (maximum elevation) that becomes inundated by the
tsunami (1).
Speed and Height: Tsunami speed is dependent on water depth and wave period.
In deep water and in the open ocean, tsunami waves can reach speeds of 900
kilometres per hour (3). Heights of tsunami waves in deep water are only slight and
may go unnoticed by marine vessels. Tsunami waves increase in size and reduce
speed as they approach the shore (known as shoaling). The first wave in the series
may not be the largest (1).
Wave length: Tsunami waves are characterised by their long wave length, which
may be up to hundreds of kilometres between waves (or the wave crests) (3).
Wave period: Wave period (or time between wave crests) is dependent upon the
mode of propagation (relative velocity and magnitude of the disturbance, the water
depth in which the wave is generated and the volume of water displaced by the
event generating the waves). The wave period usually lasts between a few minutes
to a few hours (1) (3).
July 2018 Tsunami Hazard and Risk in NSW Page 41.2 TSUNAMI GENERATION
Tsunami may be caused by any one or combination of the following:
a. Vertical movement of the sea floor as a result of a large earthquake.
b. Sub-marine or coastal volcanic eruptions.
c. Meteor impacts.
d. Coastal landslides and slumps, either land-based or sub-marine (1).
Earthquakes are the most common cause of tsunami (3). However, not all
earthquakes generate tsunami. To generate a tsunami, the fault where the
earthquake occurs must be underneath or near the ocean, and the earthquake must
cause significant vertical movement of the sea floor over a large area. The most
destructive tsunamis are generated from large, shallow earthquakes which usually
occur in areas of tectonic plate subduction. . (1)
Tsunami can be classified as either, local, regional or distant, depending on the
distance of their generation from the coastline (1).
a. Local tsunamis (near-field) are generated close to the affected coast by
submarine or coastal landslides. Time between generation and arrival at the
coast can be around 15-20 minutes for submarine landslides, or as little as five
minutes for coastal landslides. Hence it is unlikely that areas at the initial point
of impact would receive any effective warning other than environmental
signals, such as strong ground shaking or drawdown at the coastline. In
Australia, no local tsunami have been observed since European settlement.
Evidence indicating the existence of previous submarine landslides has been
found on the continental shelf offshore of the NSW coast.
b. Regional tsunamis are those generated within the south west Pacific.
Potential regional tsunami sources are located in subduction zones along the
Indian-Australian and Pacific tectonic plate boundary which runs through
Macquarie Island, New Zealand, Tonga, Vanuatu, Papua New Guinea, the
Solomon Islands and the Kermadec Islands (1000 km northeast of Auckland).
From these locations travel time to the NSW coast is in the order of several
hours.
c. Distant tsunamis (far-field) are generated far away from the affected
coastline. NSW may be affected by tsunami generated in subduction zones as
far away as North America, South America and Asia or in divergent tectonic
plate boundaries located between Australia and Antarctica. Travel time to the
NSW coast is in the order of several hours to days.
1.3 CONSEQUENCES OF TSUNAMI
Destruction from tsunami is the direct result of: inundation, waves, erosion and
debris impact on coastal structures. Floatation and drag forces can move buildings
and over-turn vehicles. Tsunami associated wave forces can demolish buildings.
Considerable damage is also caused by debris, including boats, up-rooted
vegetation, structural materials, cars and other vehicles that are swept along by the
force of the water. Even small tsunami can generate currents strong enough to
July 2018 Tsunami Hazard and Risk in NSW Page 5cause damage to boats and associated facilities. Destructive waves may continue
for a number of hours and several days may pass before the sea returns to its normal
state (1).
The consequences of tsunami can include:
a. Loss of life, particularly drowning;
b. Property damage or destruction (including vessels, buildings and vehicles);
c. Infrastructure damage, particularly marinas, moorings, ports and coastal
infrastructure such as beach access, but also land-based infrastructure such
as roads, downed power and telephone lines;
d. Isolation of properties or vehicles due to road closures;
e. Economic losses (for example impacts to maritime industries, local
businesses, tourism and agricultural damages);
f. Destruction of the natural environment, particularly in the coastal zone and
the marine environment, and the generation of large volumes of waste that
is potentially hazardous; and
g. Indirect effects such as disruption to community activities and ongoing
psychological issues. The broader community can be affected by
infrastructure damage, disruption of essential services and disruption to
transport and shipping routes.
TSUNAMI HAZARD
2.1 NSW TSUNAMI SOURCES
Tsunami are known to be generated by vertical movement of the sea floor as a
result of a large earthquake; sub-marine or coastal volcanic eruptions; meteor
impacts; or coastal landslides and slumps, either land-based or sub-marine (1).
2.2 EARTHQUAKE SOURCES
The majority of tsunami are caused by earthquake-induced movement of the
seafloor typically along subduction zones of tectonic plate boundaries. This includes
the world’s largest tsunami caused by the 1960 Chile earthquake (moment
magnitude, Mw, 9.5), the 1964 Alaska earthquake (Mw 9.2), the Sumatra–Andaman
Islands earthquake of 26 December 2004 (Mw 9.1) and the Japan earthquake of 11
March 2011 (Mw 9.0). Smaller earthquakes can cause significant tsunami as well,
however their impact tends to be more localised (4) (5).
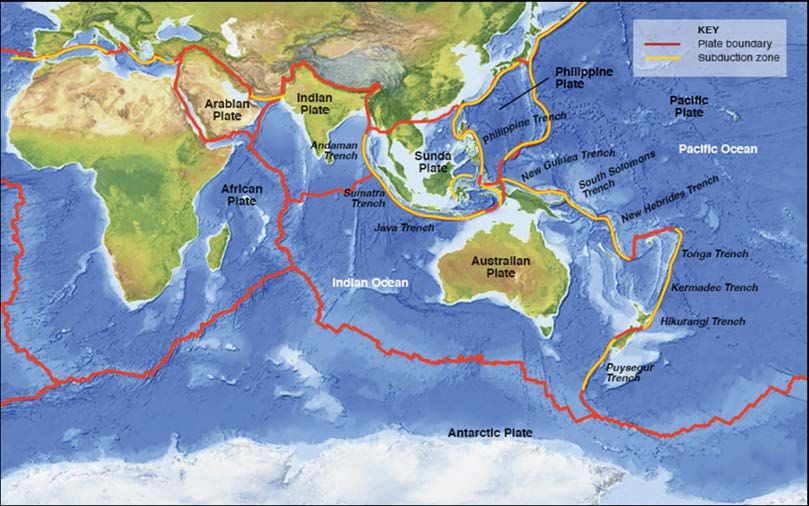
At average recurrence intervals (ARIs) of above 500 years (unlikely events) only a
few potential earthquake sources contribute to the tsunami hazard in NSW. These
sources include the regional plate boundaries of the New Hebrides (Vanuatu),
Kermadec and Puysegur (New Zealand) trenches. This is because only a few sources
can generate tsunami having a large near shore wave amplitude. At an ARI of less
than 100 years (possible events) however, many potential sources contribute to the
July 2018 Tsunami Hazard and Risk in NSW Page 6tsunami hazard in NSW. These include both regional and distant plate boundaries
and include the regional subduction zones off New Hebrides (Vanuatu), Kermadec
and Puysegur, as well as distant sources off Peru, Chile and Indonesia (5).
Figure 1. Location of Plate Boundaries and Subduction Zones (supplied by Geoscience Australia)
2.3 VOLCANO SOURCES
There are at least five active volcanoes capable of generating a tsunami that could
affect Australia. However, the Krakatau eruption, in Indonesia, of 26–27 August
1883 is the only documented eruption to have generated a tsunami that affected
Australia and is recorded in the NSW record. It caused 36,000 deaths in Indonesia
and generated a tsunami in the Indian Ocean that was more extensive than the 2004
Indian Ocean tsunami (5).
2.4 LANDSLIDE SOURCES (LAND AND SUBMARINE)
Submarine landslides are also a source for tsunami although their effects tend to be
more localised. It is worth noting however, that major submarine landslides (e.g. in
Hawaii) can generate giant tsunami that could devastate coastal regions thousands
of kilometres away. Off the NSW coast numerous submarine landslide scars can be
seen on the continental slope, with several significant ones lying adjacent to Sydney
(5).
One of the largest landslides occurred off Bulli (near Wollongong) and was 10km
wide and 20km long and is considered large enough to have generated a significant
local tsunami (5). Clarke et al. (2014) examined morphologic characterisation of five
distinct, eastern Australian upper continental slope submarine landslides and
modelled their tsunami hazard (6). Their analysis suggests that the reoccurrence of
July 2018 Tsunami Hazard and Risk in NSW Page 7submarine landslides with similar characteristics to those in the recent past would
be expected to generate tsunami with a run-up of up to 5m and inundation
distances of up to 1km (5).
2.5 METEORITE SOURCES
Tsunami can also be generated by meteorite impact on the ocean, and although
there are no known examples during human history, there is geological evidence of
ocean impacts from meteorites. For example, there is evidence to suggest that a
1km or larger object, the Eltanin asteroid, impacted the Southern Ocean about 2.15
million years ago (5).
Modelling done in 2000, extrapolated to NSW suggests the return period for a
meteorite-generated tsunami with a wave amplitude of 1m at a water depth of 15m
is approximately one thousand years (unlikely). However, several other recent
studies suggest this may be too frequent and an ARI for an event this size may be
more likely to be around 10,000 years (rare) (5).
2.6 TSUNAMI HISTORY
The NSW coast has experienced some 44 tsunami since European settlement, many
which have been too small to produce noticeable effects. Since 2007 four tsunami
events have been observed to impact NSW including tsunamis originating from
earthquakes off the Solomon Islands, New Zealand, Chile and Japan (7).
The maximum run-up for a historical tsunami was 1.71m at Eden which was
generated from the Chilean earthquake in 1960 (8). Damage was limited primarily
to vessel moorings, although the oyster industry did suffer some losses. There were
two unconfirmed reports of minor injury and some reports of people having to flee
beaches and tidal rock shelves, indicating that the tsunami did create a risk to life
along the coast of NSW (8).
Historic records indicate that the Black Sunday event of February 1938 at Bondi
produced a number of large waves in quick succession. Reports at the time showed
around 250 people required assistance with 35 near drownings and 5 fatalities (9).
Waves were also reported on adjacent beaches and as far north as Newcastle. There
is a suggestion that this event may have been a tsunami generated by a localised
submarine landslide, however this has not been verified. (2)
Geological studies (5) also suggest tsunami impact along the NSW coast with seven
events documented with the oldest event dated at 105,000 years ago and reported
to have been generated by submarine sediment slides off Lanai, Hawaii. The six
youngest paleo-tsunami events all occurred during the Holocene (10,000 years ago).
The causes of these other six events are unknown. The maximum run-up for a
paleo-tsunami is reported at possibly as much as 130 m above sea level at Steamers
Beach, Jervis Bay, NSW, while another event is reported to have inundated the coast
to distances of 10 km inland. Some scientists have begun to question the evidence
reported for these events. Most recently, one of the key sites for a paleo-mega
tsunami deposit has been re-examined (at Minnamurra Point, Kiama, NSW), finding
that the proposed tsunami deposited sediments were an in-situ soil horizon. Further
July 2018 Tsunami Hazard and Risk in NSW Page 8work is required to examine the paleo-tsunami record in order to check the
accuracy of the paleo-tsunami record (5).
2.7 TSUNAMI HAZARD ASSESSMENT
In 2008 Geoscience Australia completed an Offshore Probabilistic Tsunami Hazard
Assessment (OPTHA). The OPTHA estimated the likelihood of a tsunami wave of a
given height occurring at offshore locations (100m water depth). Results indicated
that the highest offshore hazard is in the northwest of Western Australia (WA).
Offshore hazard on the eastern and northern coasts of Australia is significantly less
than the northwest of WA (2). NSW is considered to have a moderate hazard and is
fairly similar along the entire coast for a 2000 year (unlikely) ARI (10).
The OPTHA was followed up with the Nearshore Tsunami Hazard Assessment
(NTHA) in 2009, which reported on the nearshore (20m water depth) hazard for
States and Territories.
The results for New South Wales indicate that:
a. Tsunami amplification is similar along the entire coast;
b. Except for Sydney and Nowra, all communities had increased wave heights for
all modelled events;
c. On average tsunami wave heights at the 20m water depth are twice that at
the 100m water depth. (11)
July 2018 Tsunami Hazard and Risk in NSW Page 9TSUNAMI RISK AND VULNERABILITY
3.1 TSUNAMI RISK
Geoscience Australia has undertaken detailed tsunami inundation modelling for
Batemans Bay and a number of sites in the Gosford area.
The NSW State Emergency Service and Office of Environment and Heritage have
commissioned additional studies to build on the tsunami understanding for NSW.
These include:
a. Development of Information for a Tsunami Risk Assessment of the NSW Coast
2008 (12); and
b. NSW Tsunami Inundation Modelling and Risk Assessment 2013 (report,
figures, appendix) (13),
The report on Development of Information for a Tsunami Risk Assessment of the
NSW Coast 2008 summarised knowledge on tsunami sources and history and
provided a general assessment of tsunami risk on the NSW coast. In addition the
study identified NSW as having moderate tsunami hazard level and suggested sites
for future inundation modelling based on a broad-based risk assessment
methodology incorporating offshore hazard levels, coastline shape and elevation-
based address data (10) (15).
Key findings of the NSW Tsunami Inundation Modelling and Risk Assessment 2013
(13):
a. NSW coast has a medium exposure to tsunami (local and regional context).
b. Calibrations found that the modelling reasonably simulates historical tsunami
and replicates inundation extremely well.
c. Tides were not found to influence wave shoaling (the increase in height as the
tsunami approaches the shore) but do affect wave crest levels and run-up.
d. Embayment (coastal bay) shape was found to have less influence than it was
previously though to.
e. Land inundation becomes significant, particularly at the (unlikely) 1,000 to
2,000 year ARI level (and greater).
f. There was potential of inundation and exposure of people and property even
at the lowest ARIs examined (likely 200 year ARI) particularly at Swansea.
g. Low lying estuary foreshores are more vulnerable.
h. Further research is required (including further investigation of tsunami
impacts in estuarine areas).
The NSW Tsunami Inundation Modelling and Risk Assessment 2013 study (13)
produced inundation modelling for five sites identified as being potentially more
vulnerable to tsunami:
a. Swansea / Lake Macquarie,
b. Manly,
July 2018 Tsunami Hazard and Risk in NSW Page 10c. Botany Bay / Cronulla / Kurnell,
d. Wollongong / Port Kembla and
e. Merimbula.
However there may be other areas of the NSW coast at similar risk, as this study
was based on prioritisation from an earlier study.
Table 1: Number of addresses (GURAS) located within modelled tsunami inundation extents (13).
GURAS is the NSW Geo-coded Urban and Rural Address System which may contain multiple points for
cadastral land parcels (eg. for multi-storey buildings).
Post Code
2281 2095 2231 2230 2500 2505 2548 2549
ARI Reference
Port
Swansea Manly Kurnell Cronulla Wollongong Merimbula Pambula
Kembla
200 428 100 68 386 0 3 80 1
500 1158 262 97 476 0 4 369 1
1000 2121 479 236 625 12 7 465 1
2000 2974 1867 321 836 74 7 667 4
5000 3956 4686 485 1884 259 7 738 5
10000 4271 8515 556 2630 943 8 1179 8
The Bureau have compared potential tsunami warnings issued by the Joint
Australian Tsunami Warning Centre (JATWC) against the inundation modelling
results, with particular focus on the JATWC’s pre-defined warning threshold levels.
The results have indicated that the thresholds used by the JATWC warning scheme
are in general set conservatively and they should not be modified on the basis of
these results (5).
Whilst historical impact of tsunami inundation in NSW has been relatively minor,
and generally restricted to marine based events, the modelling of selected
earthquake-generated events indicates the potential for land inundation,
particularly at high (unlikely) return periods. Low lying populated communities
around estuary foreshores are particularly at risk, although results also indicate
there is potential for inundation of open coast sites at very high (rare) return periods
(5).
3.2 TSUNAMI COMMUNITY VULNERABILITY
Tsunami vulnerability is greatest between Wollongong and Newcastle, due to the
high population density in this area. Vulnerability is also likely to be greatest during
the summer months, especially during the school holiday period from December
through to the end of January (1).
Both marine and land based assets and populations are vulnerable to tsunami. It is
likely that all significant tsunami will affect marine based assets and populations,
whilst larger tsunami will cause damage to land based assets and populations. The
JATWC warnings are based on land or marine threats.
July 2018 Tsunami Hazard and Risk in NSW Page 11Table 2: Examples of land and marine based assets and users vulnerable to tsunami.
Marine Based Assets and Users Land Based Assets and Users
• Boats and their crew in shallow water • People and property in caravan parks and camping
• Beach users, including swimmers, surfers, areas in low-lying coastal areas or on floodplains in
sunbathers, and fishers tidal river areas
• Divers and snorkelers • Coastal infrastructure including roads, bridges,
• Aquaculture industries power, water, gas, sewerage and
• Submarine power, telecommunications, fuel telecommunications
and water supply lines • Residential, commercial and industrial buildings
• People and facilities in ports, harbours and and their occupants in low-lying coastal areas or
marinas on floodplains in tidal river areas
• Sewerage outfalls • Motorists and vehicles on low-lying coastal roads
• Low-lying coastal farmland including animals and
crops
• Institutions such as schools and hospitals located
in low-lying coastal areas
• Walkers in coastal parks and reserves
July 2018 Tsunami Hazard and Risk in NSW Page 12Table 3: Possible Vulnerable Population in NSW (2011 census) within 1km of coast and below the 10m contour height (AHD).
Total Dwellings No Vehicle Schools / School Age Public / Aged Care / Age >= Caravan Park
Population at Dwelling Childcare Children (Pre to Private Nursing 85 / Camping
Centres High School) Hospitals Homes Grounds
Northern Rivers 23649 9526 675 24 3565 2 6 570 33
Mid North Coast 29395 12436 1215 17 4225 0 0 814 60
Hunter 46818 19112 2165 25 6257 3 6 1541 48
Lord Howe Island 360 129 22 0 36 1 0 8 0
Metropolitan 104616 42796 8570 84 10434 1 4 2284 9
Illawarra 38588 15649 2132 26 5402 0 6 1119 48
South Coast 10767 4436 358 10 1505 0 1 489 47
NSW Total 254193 104084 15137 186 31424 7 23 6825 245
Note: Figures quoted are approximate. The modelling used for these figures does not extend 10km upstream in coastal estuaries and rivers. There may be additional
areas impacted that are adjacent to tidal rivers or estuaries further than 1km from the coast.
July 2018 Tsunami Hazard and Risk in NSW Page 133.3 WARNING AND ARRIVAL TIMES
Tsunami warning and arrival times are dependent on both proximity and source as
discussed in Part 8. Examples include:
• Local Sources – Travel time from a local source could be within minutes.
• Regional Sources - Travel time from regional sources to the NSW coast
varies but is in the order of several hours.
• Distant Sources - Travel time from distant sources to the NSW coast varies
but is in the order of several hours to days.
Lord Howe Island will have shorter warning time than the NSW coast for tsunami
generated closer to the island than the NSW coast (1).
The following table lists arrival times for five modelled sites in NSW.
Table 4: Summary List of Modelled Tsunami Scenario Arrival Times (13)
Tsunami Arrival Time (hours:mins)
Average Reoccurrence Site
SOURCE TIDE
Interval (ARI) Lake Manly Botany Wollongong Merimbula
Macquarie Bay Port Kembla
200 (possible*) Kermadec HAT 04:37 04:36 04:36 04:41 04:46
(1000km NE of NZ)
200 New Hebrides HAT 03:50 03:54 03:56 04:14 04:18
200 Puysegur, NZ HAT 02:40 02:38 02:34 02:31 02:27
200 South Chile HAT 14:04 14:02 14:00 13:57 13:41
200 Tonga HAT 05:15 05:21 05:23 05:40 05:48
500 (unlikely) Kermadec HAT 04:35 04:33 04:34 04:39 04:44
500 New Hebrides HAT 03:46 03:49 03:51 04:00 04:15
500 Puysegur HAT 02:31 02:31 02:31 02:27 02:20
500 Tonga HAT 05:09 05:10 05:10 05:17 05:32
1000 (unlikely) Kermadec HAT 04:33 04:32 04:34 04:38 04:43
1000 New Hebrides HAT 03:44 03:48 03:50 03:57 04:12
1000 Puysegur HAT 02:29 02:29 02:28 02:27 02:19
2000 (unlikely) Kermadec HAT 04:32 04:31 04:33 04:37 04:42
2000 New Hebrides HAT 03:43 03:46 03:48 03:56 04:11
2000 Puysegur HAT 02:29 02:27 02:27 02:26 02:18
2000 Kermadec MSL 04:32 04:31 04:33 04:37 04:42
2000 New Hebrides MSL 03:43 03:46 03:48 03:56 04:11
2000 Puysegur MSL 02:29 02:27 02:27 02:26 02:18
5000 (rare) New Hebrides HAT 03:42 03:44 03:47 03:54 04:10
5000 Puysegur HAT 02:28 02:27 02:26 02:26 02:17
5000 New Hebrides MSL 03:42 03:44 03:47 03:54 04:10
5000 Puysegur MSL 02:28 02:27 02:26 02:26 02:17
10000 (very rare) New Hebrides HAT 03:40 03:43 03:46 03:52 04:09
10000 Puysegur HAT 02:28 02:26 02:26 02:25 02:17
* Likelihood levels are from the National Emergency Risk Assessment Guidelines (14)
HAT = Highest Astronomical Tide, MSL = Mean Sea Level.
July 2018 Tsunami Hazard and Risk in NSW Page 14ABBREVIATIONS AEP Annual Exceedance Probability AHD Australian Height Datum ALERT Automated Local Evaluation in Real Time ARI Average Recurrence Interval ATAG Australian Tsunami Advisory Group ATWS Australian Tsunami Warning System Bureau Australian Government Bureau of Meteorology EA Emergency Alert GA Geoscience Australia HAT Highest Astronomical Tide JATWC Joint Australian Tsunami Warning Centre MSL Mean Sea Level NSW SES New South Wales State Emergency Service PSTN Public Switched Telephone Network PTWC Pacific Tsunami Warning Centre SEWS Standard Emergency Warning Signal UHF Ultra High Frequency July 2018 Tsunami Hazard and Risk in NSW Page 15
GLOSSARY
 Average Recurrence Interval (ARI). Relates to the probability of occurrence of a design event.

 Australian Tsunami Advisory Group (ATAG). An advisory committee of the Australian-New
          Zealand Emergency Management Committee, which deals with national tsunami
          issues, including the implementation of the Australian Tsunami Warning System
          (ATWS).

 Bore.      A travelling wave with an abrupt vertical front or wall of water. Under certain
            conditions, the leading edge of a tsunami wave may form a bore as it approaches
            and runs onshore. A bore may also be formed when a tsunami wave enters a river
            channel, and may travel upstream penetrating to a greater distance inland than it
            would otherwise across a coastal plain without a river channel.

 Community Resilience. Communities and individuals harnessing local resources and expertise
       to help themselves in an emergency, in a way that complements the response of the
       emergency services. Resilient communities are better able to withstand a crisis event
       and have an enhanced ability to recover from residual impacts.

 Distant tsunami. A tsunami generated from a distant source, generally outside the south-
          west pacific region. This type of tsunami may also be referred to as ‘far field tsunami’.

 Deep Ocean Tsunami Buoys (Deep Ocean Tsunameter). A tsunami detection instrument
        capable of detecting tsunami in the deep ocean.

 Effective Warning Time. The time likely to be available after a tsunami warning is issued and
          in which people at-risk can take action to leave an at-risk area or find a safe refuge.

 Emergency Alert. A national telephony based alerting system available for use by emergency
        service agencies to send SMS and voice messages to landlines and/or mobile
        telephones (by billing address and/or location) in times of emergency.

 Highest Astronomical Tide, HAT. This is the highest tide level predicted, based on any
         combination of astronomical conditions.

 Local Tsunami. A tsunami that is generated close to the areas it floods, for example the 1998
          PNG tsunami. This type of tsunami may also be referred to as ‘near-field’ tsunami.

 Mean Sea Level. The average of the sea surface over a long period, or the average level which
        would exist in the absence of tides.

 Moment Magnitude (Mw). A measure of the energy release by an earthquake. There are a
       number of different scales for measuring the magnitude. The Moment Magnitude is

July 2018                             Tsunami Hazard and Risk in NSW                      Page 16
based on the size and characteristics of the fault rupture, and can be determined
from long-period seismic waves. (15)
National Tsunami No Threat Bulletin. Notification that there is no tsunami threat to the
Australian mainland or islands after an undersea earthquake has occurred.
National Tsunami Warning Summary. Provides a national summary of all Tsunami Warnings,
Tsunami Watches and cancellations issued by the Bureau of Meteorology.
Paleo-tsunami. A tsunami that occurred prior to the existence of historical records.
Regional Tsunami. Tsunami generated within the South West Pacific Region.
Run-up. The maximum vertical height for locations on land, above mean sea level, that the
sea attains during a tsunami (measured in metres).
Subduction Zone. The place where two tectonic plates come together, one being pushed
below the other.
Tidal Wave. A common term for tsunami used in older literature, historical descriptions and
popular accounts. Tides, caused by the gravitational attractions of the sun and moon,
may increase or decrease the impact of a tsunami, but have nothing to do with their
generation or propagation. However, most tsunami (initially) give the appearance of
a fast rising or fast-ebbing tide as they approach shore, and only rarely appear as a
near vertical wall of water.
Travel Time. Time that it takes the tsunami to travel from its source to a particular location
that it floods.
Tsunami. A series of ocean waves with very long wavelengths (typically hundreds of
kilometres) caused by disturbances of the ocean such as earthquakes, landslide,
volcanic eruptions, explosions, meteorites. The word ‘tsunami’ is Japanese for
‘harbour wave’. (16)
Wave Amplitude. This is quoted as half the wave height. It should be recognised that tsunami
waves are typically not symmetrical. (15)
Wave Height. The vertical distance between the trough and the crest of a wave.
Wave Length. The mean horizontal distance between successive crests or troughs of a wave
pattern. (15)
Wave Period. The time taken for a one wavelength to pass a given point. (15).
July 2018 Tsunami Hazard and Risk in NSW Page 17REFERENCES 1. NSW State Emergency Service. Tsunami Emergency Sub-Plan. 2008. 2. Bureau of Meteorology. Tsunami Frequently Asked Questions. Bureau of Meteorology. [Online] 2014. [Cited: 07 23, 2014.] 3. Attorney-General's Department. Tsunami Emergency Planning in Australia. s.l. : Attorney- General's Department, 2010. 4. USGS. Earthquakes. USGS. [Online] [Cited: August 12, 2013.] http://earthquake.usgs.gov/earthquake/eqinthenews/2011/usc0001xgp. 5. Progress Towards an Understanding of Tsunami Risk in NSW. Andrews, F., Beadle, C., Davies, B., Frazer, A., Garber, S., Greenslade, D., Hanslow, D., Horspool, N., Kuster, N., Opper, S., and Treloar, D. 2013. 6. Morphology of Australia’s Eastern Continental Slope and Related Tsunami Hazard. Samantha Clarke, Thomas Hubble, David Airey, Phyllis Yu, Ron Boyd,. s.l. : Springer International Publishing Switzerland 2014, 2014. 7. Bureau of Meteorology. Records of Tsunamis affecting Australia. [Online] [Cited: 07 18, 2014.] 8. NSW State Emergency Service. Measurements and Impacts of the Chilean Tsunami of May 1960 in NSW Australia. 2009. 9. Waverley Library. Waverley Library Black Sunday. Waverely Library. [Online] [Cited: 07 18, 2014.] 10. Burbidge, D., Mleczko,R., Thomas, C., Cumminis,P., Nielsen, O., Dhu, T. A Probabilistic Tsunami Hazard Assessment for Australia. Geoscience Australia Professional Opinion No.2008/04. 2008. 11. A Nearshore Tsunami Hazard Assessment for Australia. Geoscience Australia Professional Opinion. No.2009/06. Fountain, L, Van Putten, K., Griffin, J., Hingee, M., Wilson, R., Burbidge. 2009. 12. Risk Frontiers, Macquarie University. Development of Information for a Tsunami Risk Assessment of the NSW Coast. 2008. 13. Cardno Pty Ltd. NSW Tsunami Inundation Modelling and Risk Assessment. 2013. 14. National Emergency Management Committee. National Emergency Risk Management Guidelines. 2010. 15. Bureau of Meteorology. Bureau of Meteorology Glossary of Terms. Australian Government Bureau of Meteorology. [Online] Bureau of Meteorology. [Cited: 07 14, 2014.] 16. —. Tsunami Facts and Information. Australian Government Bureau of Meteorology. [Online] Bureau of Meteorology. [Cited: 07 14, 2014.] July 2018 Tsunami Hazard and Risk in NSW Page 18
You can also read