Calamos Global Convertible Capabilities - JULY 2020 - Calamos Investments

Page created by Mary Perry
 
CONTINUE READING
Calamos Global Convertible Capabilities - JULY 2020 - Calamos Investments
JULY 2020

Calamos Global Convertible Capabilities

NOT FDIC INSURED | MAY LOSE VALUE | NO BANK GUARANTEE
This document does not constitute an offer or solicitation to invest in the Fund. It is directed only at professional/sophisticated investors and it is for their use and information. This document should not be shown or given to
retail investors. Any entity responsible for forwarding this material to other parties takes responsibility for ensuring compliance with the financial promotion rules. This presentation is for investment professional use only
and is not intended for further distribution or dissemination. The opinions referenced are as of the date of publication and are subject to change due to changes in market or economic conditions and may not necessarily
come to pass.
Calamos Global Convertible Capabilities - JULY 2020 - Calamos Investments
CALAMOS GLOBAL CONVERTIBLE CAPABILITIES

Introduction
Calamos Global Convertible Capabilities - JULY 2020 - Calamos Investments
CALAMOS GLOBAL CONVERTIBLE CAPABILITIES

Calamos Firm Overview

  Calamos Overview
                                                                                                                       Key Features
    •      Multi-disciplined, global asset manager
                                                                                                                       •     Active – Global – Growth
    •      Headquartered in Chicago-metro area, offices in New
           York, San Francisco, Milwaukee and the Miami area                                                           •     Pioneer in convertible, liquid alternative
                                                                                                                             and fundamental low-volatility strategies
    •      Founded in 1977
                                                                                                                       •     Unique blend of quantitative and
    •      AUM of U.S. $26.5 billion, including $10.8 billion in                                                             qualitative investment processes
           convertible assets
                                                                                                                       •     Comprehensive analysis of idiosyncratic
    •      Institutional Assets† of U.S. $13.9 billion                                                                       risk factors, including ESG-related
                                                                                                                             principles (UN PRI signatory)
    •      311 employees*, 74 investment professionals
                                                                                                                       •     Team of teams platform and product set,
                                                                                                                             integrated through Co-CIO-led
   Assets By Category (in USD, Millions)                                                                                     investment committee and institutional-
                                                                                                                             quality infrastructure
   •      Alternatives                                                       $10,406 M
   •      Lower-Volatility Equity/Risk Managed                                 $3,268 M
   •      Convertibles                                                         $2,494 M
   •      Fixed Income                                                         $4,299 M
   •      Growth Equity                                                        $2,810 M

Data as of June 30, 2020.
† Institutional Assets include institutional share classes of open-end funds as well as assets managed for institutions.
* Total represents full-time employees of the operating subsidiaries of Calamos Asset Management, Inc. Part-time employees and consultants are excluded.                  3
033059 0620Q IO
Calamos Global Convertible Capabilities - JULY 2020 - Calamos Investments
CALAMOS GLOBAL CONVERTIBLE CAPABILITIES

Calamos: A Pioneer in Convertible Investing

Calamos has been using convertibles since the 1970s seeking to manage risk and returns

                                                                                              1996
                                                                                              Launches global
                                                                                              lower-volatility
                                                                     1988
                                                                                              equity strategy
                                                                   John P.
  John P. Calamos, Sr.                                       Calamos, Sr.     1990                               2002
  develops proprietary                                      publishes first   Launches one of the first          Launches the first of seven                    2020
  convertible bond                                                book on     liquid alternative mutual          multi-asset convertible                        Today Calamos manages
  strategy to potentially                                     convertible     funds, leveraging our              closed-end funds, which total                  $10.8 billion in total
  manage risk                                                   securities    convertible expertise              $7.4 billion AUM today                         convertible assets

                  1970s                                1980s                             1990s                           2000s                         2010s-2020s
                        1977                                                            1994                                    2007
           John P. Calamos,                                1985
                                                                                        Launches global             Launch of Dublin-
           Sr. establishes an                 Launches one of
                                                                                        convertible strategy      domiciled UCITS for
            investment firm                the first convertible
                                                                                                                   non-U.S. investors
                                             mutual funds that
                                                                                                     1998
                           1979                has nearly $948                                                                          2008
                                                                                                   John P.
           Inception of Calamos                    million AUM                                                                          Launches a risk-
                                                                                              Calamos, Sr.
            Convertible strategy                                                                 publishes                              managed emerging
                                                                                             second book                                markets equity strategy
                                                                                            on convertible                              that utilizes convertibles
                                                                                                 securities

As of 6/30/20. See appendix for discussion of "lower-volatility“.                                                                                                                 4
033059 0620Q IO
CALAMOS GLOBAL CONVERTIBLE CAPABILITIES

2020 Refinitiv Lipper Fund Award

.
Calamos Global Convertible Fund – Class A U.S. $ Accumulating
Winner of the Refinitiv Lipper Fund Award for 10-Year Risk-Adjusted performance in the Bond Convertibles Global Category

 The Refinitiv Lipper Fund Award received is for risk-adjusted performance for the 10-year period among 24 funds in the United Kingdom in the Bond Convertibles Global category as of 12/31/19. The Refinitiv Lipper Fund
 Awards, granted annually, highlight funds and fund companies that have excelled in delivering consistently strong risk-adjusted performance relative to their peers. The Refinitiv Lipper Fund Awards are based on the Lipper
 Leader for Consistent Return rating, which is a risk-adjusted performance measure calculated over 36, 60 and 120 months. The fund with the highest Lipper Leader for Consistent Return (Effective Return) value in each eligible
 classification wins the Refinitiv Lipper Fund Award. For more information, see lipperfundawards.com. Although Refinitiv Lipper makes reasonable efforts to ensure the accuracy and reliability of the data contained herein, the
 accuracy is not guaranteed by Refinitiv Lipper. Used with permission by Refinitiv Lipper.                                                                                                                                        5
033059 0620Q IO
CALAMOS GLOBAL CONVERTIBLE CAPABILITIES

Overview of Convertible Securities
CALAMOS GLOBAL CONVERTIBLE CAPABILITIES

Summary

                                                                                  Convertibles have historically:

                                                                                                                                                                                          Enhanced
                                                                                                                                                                                      opportunities for
                       Performed well in                                   Helped to mitigate                                       Outperformed
                                                                                                                                                                                      investors to tailor
                         rising equity                                      downside during                                          bonds when
                                                                                                                                                                                     the risk and reward
                            markets                                            declines                                           interest rates rise
                                                                                                                                                                                      characteristics of
                                                                                                                                                                                       their portfolios

Convertible Securities Risk: The value of a convertible security is influenced by changes in interest rates, with investment value declining as interest rates increase and increasing as interest rates decline. The credit
standing of the issuer and other factors also may have an effect on the convertible security’s investment value.                                                                                                               7
033059 0620Q IO
CALAMOS GLOBAL CONVERTIBLE CAPABILITIES

Defining Convertible Securities

Is a convertible fixed income or equity?
• Technically a debt instrument, with attributes of a bond or preferred stock:
     interest payment/dividend and bond maturity date

•     Most often issued as senior debt and subject to credit default risk

•     One important difference: It can be exchanged (converted) into a specific
      number of shares of common stock, at the option of the holder

Why do companies issue convertibles?
• Convertibles are an alternative capital structure option

•     Cost: Lowers cost of both debt and equity

•     Capital structure consideration
       o Less restrictive covenants
       o Ability to refinance when debt spreads are high
       o Serial offerings allow growth while controlling debt/equity ratio

•     Monetize volatility of equities

                                                                                                                       8
033059 0620Q IO
CALAMOS GLOBAL CONVERTIBLE CAPABILITIES

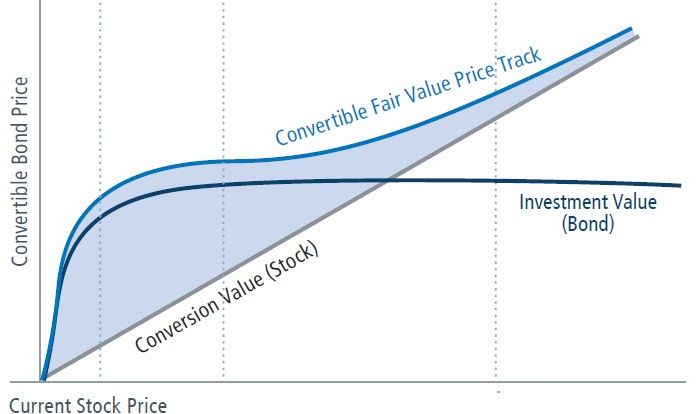
Because of Hybrid Characteristics, Actively Managed Convertibles May Offer Many Potential Benefits

                                                                     UPSIDE OPPORTUNITY
                                                    When the underlying stock rises, convertibles
                                                   may capture a portion of the capital appreciation

                                                                                                                             DOWNSIDE RISK MITIGATION POTENTIAL
                                                                                                                            If the underlying stock price drops, convertibles
                                                                                                                                provide consistent income and other fixed
                                                                                                                           income characteristics (e.g., principal repayment)

                         Reduced vulnerability to rising rates.
                         Equity characteristics make convertibles less sensitive to rising interest rates than Treasury bonds and investment grade credits.

                         Enhanced capital appreciation potential.
                         Potential for greater total return than traditional fixed-income asset classes.

                         Equity upside participation.
                         Convertibles can participate in the advance of their underlying stocks (due to conversion feature).

                         Potential downside risk mitigation.
                         Convertibles offer lower-volatility equity participation, as bond characteristics provide a floor when equities move downward.

                         Diversification.
                         The performance of convertibles does not correlate directly to either the stock or bond market, so the addition of convertibles to
                         a portfolio may reduce overall volatility

                  Convertible securities are subject to default risk. See appendix for discussion of "lower-volatility“.                                                        9
033059 0620Q IO
CALAMOS GLOBAL CONVERTIBLE CAPABILITIES

Convertibles Demand Experienced Active Management
                             Yield
                                                     Total Return Alternatives                         Equity Alternatives
                         Alternatives
                                                              Hybrid                                         Equity
                        Fixed income                                                                                                                        Yield Alternatives:
                                                          characteristics                                characteristics
                       characteristics                                                                                                                      Exhibit more fixed income
                                                                                                                                                            characteristics and lower levels of
                                                                                                                                                            equity sensitivity.

                                                                                                                                                            Total Return Alternatives:
                                                                                                                                                            Offer a favorable balance of equity and
                                                                                                                                                            fixed‐income characteristics.

                                                                                                                                                            Equity Alternatives:
                                                                                                                                                            Exhibit higher levels of equity
                                                                                                                                                            sensitivity.

  US Convertible Market Composition
                                                                                                                                                        Convertibles are complex and active
    Mar 2000                  19%                                    28%                                          53%                                   management is key. Their attributes may
                                                                                                                                                        differ considerably and a specific
    Feb 2009                  67%                                    21%                                          12%                                   convertible may be more equity-like at
    Jun 2020                  22%                                    46%                                          32%                                   certain periods and more fixed-income-
                                                                                                                                                        like in others.
  Active management does not guarantee investment returns and does not eliminate the risk of loss. A convertible bond is at a "distressed" valuation when it is worth significantly less than the theoretical value of a
  similar non-convertible bond and is highly sensitive to changes in the underlying equity price. A convertible bond has "fixed income characteristics" when it is valued at about the same level as a similar non-
  convertible bond and is not as sensitive to the underlying equity. A convertible bond has "hybrid characteristics" when it has fixed income characteristics as previously explained but is becoming increasingly
  sensitive to changes in the underlying equity price. "Equity characteristics" represents a convertible bond that is highly sensitive to movements in the underlying equity. Percentages shown represent the
  proportion of convertible bonds in the ICE BofA, All U.S. Convertibles Index (VXA0) that fall into each classification. Totals may not equal 100% due to rounding. Source: ICE BofA, All U.S. Convertibles Index (VXA0).
  Data as of June 30, 2020.                                                                                                                                                                                         10
033059 0620Q IO
CALAMOS GLOBAL CONVERTIBLE CAPABILITIES

Opportunities in the Global Convertible Market
                                                                                                        A convertible bond is at a "distressed" valuation when it is worth
                         Yield                                                                          significantly less than the theoretical value of a similar non-
                                            Total Return Alternatives    Equity Alternatives            convertible bond and is highly sensitive to changes in the
                     Alternatives
                                                     Hybrid             Equity characteristics          underlying equity price. A convertible bond has "fixed income
                    Fixed income                                                                        characteristics" when it is valued at about the same level as a
                                                 characteristics
                   characteristics                                                                      similar non-convertible bond and is not as sensitive to the
                                                                                                        underlying equity. A convertible bond has "hybrid characteristics"
                                                                                                        when it has fixed income characteristics as previously explained
                                                                                                        but is becoming increasingly sensitive to changes in the underlying
                                                                                                        equity price. "Equity characteristics" represents a convertible bond
                                                                                                        that is highly sensitive to movements in the underlying equity.
                                                                                                        Percentages shown represent the proportion of convertible bonds
                                                                                                        in VXA0, VE00, VASI, VJEU and CONV that fall into each
                                                                                                        classification. Totals may not equal 100% due to rounding. Source:
                                                                                                        ICE BofA Research.

Regional Convertible Market Composition as of June 30, 2020

     US                  22%                            46%                      32%                    Employing a global convertible
                                                                                                        strategy is crucial to access
     Europe              59%                            31%                      10%
                                                                                                        opportunities across different
     Asia                43%                            28%                      29%                    regions of the global
     Japan               77%                            17%                       6%                    convertible market.
     Global
                         33%                            39%                      29%
     Market                                                                                                                                                           11
033059 0620Q IO
CALAMOS GLOBAL CONVERTIBLE CAPABILITIES

Adding Convertibles to Either Stock or Bond Portfolios May Lead to A More Efficient Frontier
           Hypothetical Illustration
           Efficient Frontier: U.S. Stocks, Bonds and Convertibles

                                                                                                                                                 Including Converts                   Excluding Converts
                                  17%

                                  15%

                                                                                                                                                                                              100% Stocks
                                                                                                                                 100% Converts
Annualized Average Total Return

                                  13%
                                                                                               85% Converts, 15% Bonds
                                                                                                                                                           85% Stocks, 15% Bonds
           RETURN

                                                                           70% Converts, 30% Bonds
                                  11%                                                                                              70% Stocks, 30% Bonds

                                                         55% Converts, 45% Bonds
                                                                                                           55% Stocks, 45% Bonds
                                  9%          40% Converts, 60% Bonds

                                         25% Converts, 75%                    40% Stocks, 60% Bonds
                                              Bonds
                                  7%
                                                             25% Stocks, 75% Bonds

                                  5%
                                        3%                        5%                      7%                       9%                         11%                          13%                            15%
                                                                                                             RISK
                                                                                                 Annualized Standard Deviation

Source: BofA Global Research, ICE Data Indices, LLC. The data shown is for illustrative purposes only and is not intended to represent or predict the performance of any investment. The risk and returns shown for Convertibles,
Stocks and Bonds are represented by the standard deviation and the annualized returns from January 2009 to June 30, 2020 for the ICE BofA All Traditional Convertibles Index (V0A0), S&P 500 Index and the ICE BofA Corporate &
Government Master Index, respectively. Indexes are unmanaged, do not entail fees or expenses and are not available for direct investment.                                                                                      12
033059 0620Q IO
CALAMOS GLOBAL CONVERTIBLE CAPABILITIES

Global Convertibles Have A Low Correlation to Traditional Bonds

Correlations versus traditional asset classes

Global convertibles                                                                    1.00
Refinitiv Global Convertible Bond

U.S. government bonds                                                                  -0.33
Bloomberg Barclays U.S. Government

U.S. aggregate bonds                                                                   0.05
Bloomberg Barclays U.S. Aggregate Bond

Ex-U.S. government bonds                                                               0.35
ICE BofA Global Government-ex-U.S.

Latin American government bonds                                                        0.61
JP Morgan GBI-EM Latin America

Emerging market bonds                                                                  0.67
JP Morgan Global Emerging Markets Bond

Emerging market equities                                                               0.83
MSCI Emerging Markets

U.S. high yield bonds                                                                  0.85
Credit Suisse High Yield Index

U.S. equities                                                                          0.88
S&P 500

Global developed market equities                                                       0.93
MSCI World

Source: Morningstar. Data as of 10/1/10 (earliest common inception date) to 6/30/20.                                               13
033059 0620Q IO
CALAMOS GLOBAL CONVERTIBLE CAPABILITIES

Historically, Convertibles Have Been More Resilient to Rising Rates than Bonds

Using the 10-year U.S. Treasury as an example, over the past 25 years there have been 11 occasions where the
yield increased by more than 100 bps

Returns in Rising Interest Rate Environments
                                                               Oct 93-      Jan 96-      Oct 98-      Nov 01-      Jun 03-      Jun 05-      Dec 08-      Oct 10-       Jul 12-      Jul 16-      Sep 17-
                                                               Nov 94       Jun 96       Jan 00       Apr 02       Jun 04       Jun 06       Jun 09       Feb 11        Dec 13       Dec 16       Nov 18

                              Yield Increase (bps)              286          150           263          122          176          134          187          134          157          123          119
  During these
                              Convertibles
  periods of                  ICE BofA All U.S.                -2.28%      11.97%       68.85%        2.29%        11.49%       9.46%        24.68%       11.63%       35.49%        7.58%        9.12%
  rising rates,               Convertibles Index
  convertibles
  outperformed                Stocks                            2.22        11.42        46.59         3.07         14.66        6.71          9.41        14.89        42.09         8.65        16.41
  equities 4                  S&P 500 Index
  times and                   Bonds
  bonds 11                    Bloomberg Barclays U.S.           -5.15        -4.08        -3.38        -3.09        -3.64        -1.49        -2.08        -3.94        -2.14        -4.88         -3.26
  times                       Govt/Credit Index

Performance data quoted represents past performance, which is no guarantee of future results. Current performance may be lower or higher than the performance quoted. Indexes are unmanaged,
do not reflect fees or expenses and are not available for direct investment. The ICE BofA All U.S. Convertibles Index is a measure of the U.S. convertible market. The S&P 500 Index is a measure of the
U.S. stock market. The Bloomberg Barclays U.S. Govt/Credit Index is comprised of long-term government and investment grade corporate debt securities. Source: Morningstar Direct and Bloomberg.
Most recent data as of 6/30/20. Rising rate environment periods from troughs to peak from October 1993 to November 2018.                                                                                 14
033059 0620Q IO                                                                                                                                                                                             14
CALAMOS GLOBAL CONVERTIBLE CAPABILITIES

Convertibles Outperformed High Yield In Rising Rate Environments

    When interest rates rose more than 100 bps                                                                              When interest rates rose more than 50 bps
    Average returns of the 11 periods when U.S. interest rates rose more                                                    Average returns of the 15 periods when U.S. interest rates rose more
    than 100 basis points since 1993                                                                                        than 50 basis points since 2006

     20
                                                                                                                             20

     18               17.30                                                                                                  18
                                                                     16.01
     16                                                                                                                      16

     14                                                                                                                      14

     12                                                                                                                      12
%                                                                                                                       %
     10                                                                                                                      10
                                            7.94
       8                                                                                                                      8

       6                                                                                                                      6                                                                 5.67
                                                                                                                                             5.17

       4                                                                                                                      4                                       3.18

       2                                                                                                                      2

       0                                                                                                                      0
                  ICE BofA               ICE BofA                  S&P 500                                                               ICE BofA                   ICE BofA                 S&P 500
            All U.S. Convertibles         U.S. HY                                                                                  All U.S. Convertibles             U.S. HY

Performance data quoted represents past performance, which is no guarantee of future results. Current performance may be lower or higher than the performance quoted. Indexes are unmanaged, do not reflect fees or
expenses and are not available for direct investment. Source: Morningstar. Data shown is cumulative. Rising rate environment periods from troughs to peak through May 2018. Most recent data available as of 6/30/20.
                                                                                                                                                                                                                        15
    033059 0620Q IO
CALAMOS GLOBAL CONVERTIBLE CAPABILITIES

Despite Volatility, Global Convertible Issuance Has Been Strong in 2020
•        Convertible markets are often among the first to reopen after periods of market stress, and we have seen this trend hold
         this year.
•        Globally, companies have issued $92 bil, led by the U.S. at $67 bil—a record for 1H calendar year issuance.
•        We’re seeing attractive structures with good risk/reward attributes, with many companies accessing the convertible
         market for the first time.
•        In addition to growth-oriented companies, issuers have also included larger consumer and cyclical names.

    Global Convertible Issuance ($ billions)
       180
                                       167                                           163
                                                     159
       160                                                                                                                    Geographic breakdown of 2020 YTD issuance:
                                                                                                                                           US: $67.3       Europe: $11.9
       140                                                                                                                                 Asia: $12.2       Japan: $0.4
       120                                                                   112
                             101                              98
       100                                    96                                             93                                     93                                                     92
                                                                                                                                            89
                                                                                                     85                                                                     85      85
                       83                                                                                                                           81      77
        80      72                                                                                           76                                                     75
                                                                      63
        60                                                                                                                   55
                                                                                                                    47
        40

        20

          0
                 '98   '99    '00     '01     '02     '03     '04     '05    '06     '07     '08     '09     '10     '11    '12     '13     '14     '15     '16     '17     '18     '19    '20
                                                                                                                                                                                          YTD
                                                                                                                                                                                          ‘20
    As of June 30, 2020. Source: BofA Global Research. The ICE BofA Global 300 Convertible Index is a global convertible index composed of companies representative of the market
    structure of countries in North America, Europe and the Asia/Pacific region.                                                                                                                 16
    033059 0620Q IO
CALAMOS GLOBAL CONVERTIBLE CAPABILITIES

Defaults in Convertible Market Have Historically Been Lower Than High Yield

   Default Rate, 2003-April 2020

        20%
                                                                                   17.0%                                                     U.S. Convertibles (Bonds Only)                  High Yield
        8%

                                                                          6.6%
                                                                                                                         The average convertible default rate
        6%         5.6%
                                                                                                                         from 2003 to April 2020 was 1.1%
                                                                                                                         versus 3.5% for high yield defaults
                                          4.3%                                                                                                                                                   4.3%

        4%                                                                                                                                             3.6%
                                                                                                                                             3.5%
                                                                                                                                                    3.1%
                                2.5%
                                                                                                                                                                             2.3%
                                                                                 2.2%                           2.0%                 1.9%                                              2.1%
        2%                                                                                     1.6%                              1.6%     1.7%
                                                                                                    1.4%                                                                            1.4%
              1.3%                                      1.0%                               1.3%         1.1% 1.2%      1.1%                                          1.3% 1.2%
                                                               0.7%     0.9%
                                                 0.6%              0.6%
                                       0.4%                                                                               0.4%                                0.3%                            0.2%
                         0.0%
        0%
                  2003      2004         2005      2006         2007     2008     2009       2010    2011     2012      2013       2014     2015      2016      2017        2018      2019     Apr-20

Past performance is no guarantee of future results.
Source: Barclays Equity Research.                                                                                                                                                                         17
033059 0620Q IO
CALAMOS GLOBAL CONVERTIBLE CAPABILITIES

Non-Rated and Tech Issues Reported Lower Default Rates

  From 2003-April 2019, within the U.S. convertible market:
  •        Non-rated convertible securities have seen fewer defaults than rated issues
  •        The growth-oriented tech sector* accounted for only 9% of total defaults, although it is one of the largest
           sectors within the convertible market (more than one-third)

   Aggregate Defaults by Ratings                                                                                   Sector Mix of Defaults
   All Convertible Structures, in face value (2003-April 2019)                                                     By Face Value, in billions (2003-April 2019)

                                                                                                                              Communications. $3.2              Materials $2.2
          40                                                                                                                         6%                             4%
                               $34.1
          35                                                                                                                   Utilities $3.4                                    Financial $12.7
                                Non-IG                                                                                               6%                                               23%
          30                    $18.6
                                                                                                                          Consumer, Non-
          25
                                                                             $21.8                                         cyclical, $4.6
  ($bn)

          20                                                                                                                    8%

          15
                                  IG                                                                                        Technology, $5.3
          10                     $15.5                                                                                            9%                                                   Consumer,
                                                                                                                                                                                      Cylical $12.6
           5
                                                                                                                                                                                           23%
                                                                                                                                         Industrial $5.3
           0                                                                                                                                  9%
                                                                                                                                                                Energy $6.7
                                Rated                                   Non-Rated                                                                                  12%

Past performance is no guarantee of future results. Source: Barclays Equity Research, April 16, 2019, using data from Barclays Research as of April 12, 2019.
*Based on GICS sector classification as of April 5, 2019.                                                                                                                                             18
033059 0620Q IO
CALAMOS GLOBAL CONVERTIBLE CAPABILITIES

             Managing Risk over Market Cycles
                                                                                                            Calamos Global Convertible Strategy (Gross of Fees)                MSCI World Index (USD)

                                            INTERNET                                                                                                                                                  COVID-19
                                                                               RECOVERY                     FINANCIAL                                    RECOVERY
                                          BUBBLE CRASH                                                                                                                                               PANDEMIC
                                                                            4/1/03-10/31/07                   CRISIS                                  3/1/09-12/31/19
                                             10/1/01-                                                                                                                                                  1/1/20-
                                                                                                             11/1/07-
               ANNUALIZED RETURNS (%)*

                                             3/31/03                                                                                                                                                   6/30/20
                                                                                                             2/28/09
                                                                                      22.00
                                                                              16.62                                                                                   14.08
                                                                                                                                                              9.55                                   11.73
                                            2.46

                                                                                                                                                                                                             -5.48
                                                   -11.62
                                                                                                        -22.42
                                          Strategy advanced,              76% of market upside
                                                                                                                                                  68% of market upside                             Strategy advanced,
                                            index declined
                                                                                                                 -43.94                                                                              index declined
                                                                                                        51% of market
                                                                                                          downside
            $50
                                                                                                                                                                                                         $45.0 M
            $45                          Growth of $10 Million
            $40
            $35
            $30                                                                                                                                                                                          $37.8 M
MILLIONS

            $25
            $20
            $15
            $10
              $5
              $-
                                 2001        2002           2003   2004    2005       2006    2007   2008     2009        2010   2011   2012   2013    2014          2015     2016   2017   2018      2019 YTD
                                                                                                                                                                                                           ‘20

           *Returns of less than 12 months are not annualized.
           Past performance is no guarantee of future results. Current performance may be lower or higher than the performance quoted. The principal value and return of an investment will fluctuate so that
           your shares, when redeemed, may be worth more or less than their original cost. For the most recent strategy performance information visit www.calamos.com. Index data shown is from 10/1/01,
           since comparative index data is available only for full monthly periods. Source: Mellon Analytical Solutions LLC. Data as of 6/30/20.                                                         19
           033059 0620Q IO
CALAMOS GLOBAL CONVERTIBLE CAPABILITIES

Synthetic Convertibles: Expanding the Opportunity Set

  • Combine a non-convertible debt instrument with
    an option or warrant to create the characteristics of                                                                        Advantages:
    a convertible issue
                                                                                                                                 Increased opportunities: Effectively expanding
                                                                                                                                 “convertible-like” exposure to companies that
  • May provide investors with enhanced opportunities
                                                                                                                                 don’t necessarily offer straight convertible bonds.
    to capture specific risk and reward characteristics
                                                                                                                                 Diversification: Synthetics permit investors to
                                                                                                                                 diversify in order to help manage risk. They allow
                                                                                                                                 investment exposure to market sectors where
                                                                                                                                 traditional convertibles are not well represented.

                  Bonds
                                       +               Option or
                                                        warrant
                                                                                                                                 Customization: Synthetic convertibles can be
                                                                                                                                 customized to fit requirements.

                                                                                                                                 Liquidity: Synthetics are comprised of straight
                                                                                                                                 bonds and call options. Bonds and options are all
                                                                                                                                 publically traded. Liquidity of bonds and options
                                                                                                                                 is variable but doesn’t typically present unusual
                                                                                                                                 constraints.
                          Synthetic Convertible
                                                                                                                                 Yield Enhancement: Higher than market yields
                                                                                                                                 may potentially be obtained by designing the
                                                                                                                                 synthetic convertible for a specific investment
                                                                                                                                 outlook.

Options risk: The Fund’s ability to close out its position as a purchaser or seller of an over-the-counter or exchange-listed put or call option is dependent, in part, upon the liquidity of the option
market. There are significant differences between the securities and options markets that could result in an imperfect correlation among these markets, causing a given transaction not to achieve its
objectives. The Fund’s ability to utilize options successfully will depend on the ability of the Fund’s investment adviser to predict pertinent market movements, which cannot be assured. Synthetic
convertible instruments risk consists of fluctuations inconsistent with a convertible security and the risk of components expiring worthless.                                                            20
033059 0620Q IO
CALAMOS GLOBAL CONVERTIBLE CAPABILITIES

When Managed Properly, Convertibles Can Address Multiple Allocation Goals

                                                                                                                                                                                  Lower Volatility Equity

      “”                It is not simply the convertibles that make a strategy work,
                        but how convertibles are managed to achieve a particular
                                                                                                                                                                                  An innovative solution for
                                                                                                                                                                                  investors who wish to participate
                        investment objective.                                                                                                                                     in equity markets but are
                                                                                                                                                                                  concerned about downside
                                                                                                                                                                                  equity volatility
                                            John P. Calamos, Sr.
                            Founder, Chairman and Global Chief Investment Officer

                                                                                                                                                                                   Enhanced Fixed Income
•      Often, convertibles are thought of as a single asset class, but                                                                                                             Convertible strategies may be
       convertibles do not have uniform characteristics—they can look fixed                                                                                                        used to diversify a traditional
       income-like, equity-like or hybrid in nature.                                                                                                                               fixed income portfolio, especially
                                                                                                                                                                                   during periods of rising interest
•      Structurally, the risk/reward characteristics of convertibles allow them                                                                                                    rates and inflation
       to support a range of asset allocation goals, but because of their
       structural complexities, convertibles demand active management
       within asset allocations.
                                                                                                                                                                                    Alternatives
•      Our approach is to use different convertibles within specific                                                                                                                Convertibles with a range of
       investment strategies to allow clients to meet various risk/reward                                                                                                           characteristics can be used
       targets.                                                                                                                                                                     within alternative allocations,
                                                                                                                                                                                    such as hedge strategies that
                                                                                                                                                                                    employ convertible arbitrage

The views and strategies described may not be suitable for all investors. References to specific securities, asset classes and financial markets are for illustrative purposes only and are not intended to be, and should not
be interpreted as, recommendations. Convertible Hedging Risk: If the market price of the underlying common stock increases above the conversion price on a convertible security, the price of the convertible security
will increase. The fund’s increased liability on any outstanding short position would, in whole or in part, reduce this gain. There can be no assurance the fund(s) will achieve its investment objective. See appendix for
discussion of "lower-volatility“.                                                                                                                                                                                                21
033059 0620Q IO
Appendix
CALAMOS GLOBAL CONVERTIBLE CAPABILITIES

Calamos Global Convertible Fund Portfolio Characteristics

Sector Weightings                                                                                                     Characteristics
                                                 Calamos Global           Refinitiv Global Convertible
                                                                                                                                                                                 Calamos Global             Refinitiv Global
                                                Convertible Fund                   Bond Index
                                                                                                                                                                                Convertible Fund         Convertible Bond Index
Information Technology                                  27.5%                        25.0%
                                                                                                                      # of Holdings                                                   130                          478
Consumer Discretionary                                  16.3%                        16.0%
                                                                                                                      Portfolio Turnover (12 mos)                                   61.84%                         N/A
Communication Services                                  13.8%                        14.5%
                                                                                                                      Median Investment Premium                                     19.34%                       11.20%
Health Care                                             9.6%                         13.1%
                                                                                                                      Median Conversion Premium                                     28.42%                       29.34%
Industrials                                             7.3%                          7.6%
                                                                                                                      Duration                                                     2.27 years                   1.95 years
Financials                                              5.9%                          5.2%
Real Estate                                             5.4%                          5.2%
Materials                                               4.0%                          5.1%
Consumer Staples                                        3.2%                          1.1%                                                                           1
Energy                                                  2.8%                         2.1%                             Credit Quality Allocation of Bonds
Utilities                                               2.0%                         5.1%
                                                                                                                                                                               Calamos Global         Refinitiv Global Convertible
                                                                                                                                                                              Convertible Fund                 Bond Index

                                                                                                                      AAA                                                          0.0%                            0.0%
Asset Allocation                                                                                                      AA                                                          2.2%                             0.5%
                                                                                 Calamos Global                       A                                                           5.5%                             6.5%
                                                                                Convertible Fund
                                                                                                                      BBB                                                         20.3%                           21.1%
Convertibles                                                                        97.6%
                                                                                                                      BB                                                          45.6%                           48.8%
Cash and Receivables/Payables                                                        2.3%                             B                                                           18.4%                           18.2%
Options                                                                              0.1%                             CCC and below                                               8.0%                             4.9%
                                                                                                                      Unrated Securities                                          0.0%                             0.0%

Data as of June 30, 2020.
Fund composition weightings are calculated as a percentage of Net Assets. This table excludes cash or cash equivalents, any government / sovereign bonds or broad based indexes the portfolio may hold. You can obtain a
complete listing of holdings by visiting www.calamos.com/global. The portfolio is actively managed. Holdings and weightings are subject to change daily. Sector weightings exclude certain index options that have representation
across all sectors. Ten Largest Holdings table excludes cash or cash equivalents, any government / sovereign bonds or broad based indexes the portfolio may hold. You can obtain a complete listing of holdings by visiting
www.calamos.com/global. Holdings are provided for informational purposes only and should not be deemed as a recommendation to buy or sell the securities mentioned. *Statistics based on common stock holdings. The
composite and/or strategy discussed is not a registered Fund available for investment. 1 Bond credit quality allocation reflects the higher of the ratings of Standard & Poor’s Corp. and Moody’s Investment Service Inc. as well as
Calamos’ proprietary credit scores and are adjusted to the scale shown. Ratings are relative, subjective and not absolute standards of quality. The security’s credit rating does not eliminate risk. The table excludes equity
securities, cash and cash equivalents. For more information about securities ratings, please see the Fund’s Statement of Additional Information at www.calamos.com. Additional information on ratings methodologies are
available by visiting the NRSRO websites: www.standardandpoors.com and www.moodys.com.                                                                                                                                              23
 033059 0620Q IO
CALAMOS GLOBAL CONVERTIBLE CAPABILITIES

Calamos Global Convertible Fund Portfolio Characteristics
Ten largest Holdings*

Company                                                   Industry                                                             Security type                            Country                      % of Net Assets

Carrefour, SA                                             Hypermarkets & Super Centers                                          0% Cv Due 2024                           France                             2.3%
Royal Caribbean Cruises, Ltd.                             Hotels, Resorts & Cruise Lines                                        4.25% Cv Due 2023                        United States                      2.3%
Bank of America Corp.                                     Diversified Banks                                                     7.25% Cv Pfd                             United States                      2.3%
Wells Fargo & Company                                     Diversified Banks                                                     7.50% Cv Pfd                             United States                      2.2%
NCL Corp. Ltd- Class C                                    Hotels, Resorts & Cruise Lines                                        6.00% Cv Due 2024                        United States                      2.0%
Carnival Corp.                                            Hotels, Resorts & Cruise Lines                                        5.75% Cv Due 2023                        United States                      2.0%
BASF, SE                                                  Diversified Chemicals                                                 0.93% Cv Due 2023                        Germany                            2.0%
Air Canada                                                Airlines                                                              4.00% Cv Due 2025                        Canada                             1.9%
Southwest Airlines Company                                Airlines                                                              1.25% Cv Due 2025                        United States                      1.9%
Snap, Inc.                                                Interactive Media & Services                                          0.75% Cv Due 2026                        United States                      1.9%
                                                                                                                                                                                     TOTAL                 20.9%

Data as of June 30, 2020.
Largest Ten Holdings are calculated as a percentage of Net Assets. The table excludes cash or cash equivalents, any government / sovereign bonds or broad based index hedging securities the portfolio may hold.
Holdings are provided for informational purposes only and should not be deemed as a recommendation to buy or sell the securities mentioned. Holdings are subject to change daily. The composite and/or strategy
discussed is not a registered Fund available for investment.                                                                                                                                                           24
033059 0620Q IO
CALAMOS GLOBAL CONVERTIBLE CAPABILITIES

Calamos Global Convertible Fund Geographic Distribution

Regional Allocations (% of net assets)*

                                                   Calamos Global Convertible Fund                             Refinitiv Global Convertible Bond Index
 70%              65.3%

                           58.6%
 60%

 50%

 40%

 30%
                                                              22.4%

 20%                                               16.7%
                                                                                      14.8%
                                                                                                17.1%

 10%
                                                                                                                         0.5%      0.2%                    0.4%      0.9%                     0.0%     0.8%
  0%
                  North America                        Europe                          Asia/Pacific                       Caribbean                    Middle East/Africa                   Latin America

 Summary*                                                                                                            Largest Country Weights

                                                 Calamos Global          Refinitiv Global Convertible                                                                Calamos Global         Refinitiv Global Convertible
                                                Convertible Fund                  Bond Index                                                                        Convertible Fund                 Bond Index
# of Countries Invested In                             20                             36                              United States                                         63.3%                        57.9%
Developed Markets                                     90.6%                         90.8%                             France                                                5.5%                          5.4%
Emerging Markets                                       7.2%                         9.2%                              Germany                                               5.1%                          3.9%
                                                                                                                      China                                                 5.1%                          6.8%
                                                                                                                      Japan                                                 4.8%                          5.2%
Data as of June 30, 2020.
*Geographical distribution weightings are calculated as a percentage of net assets. These tables exclude cash or cash equivalents and any options on broad market indexes the portfolio may hold. Companies are classified
geographically according to their country of domicile. You can obtain a complete listing of holdings by visiting www.calamos.com/global. The portfolio is actively managed. Holdings and weightings are subject to change
daily. The composite and/or strategy discussed is not a registered Fund available for investment.                                                                                                                          25
033059 0620Q IO
CALAMOS GLOBAL CONVERTIBLE CAPABILITIES

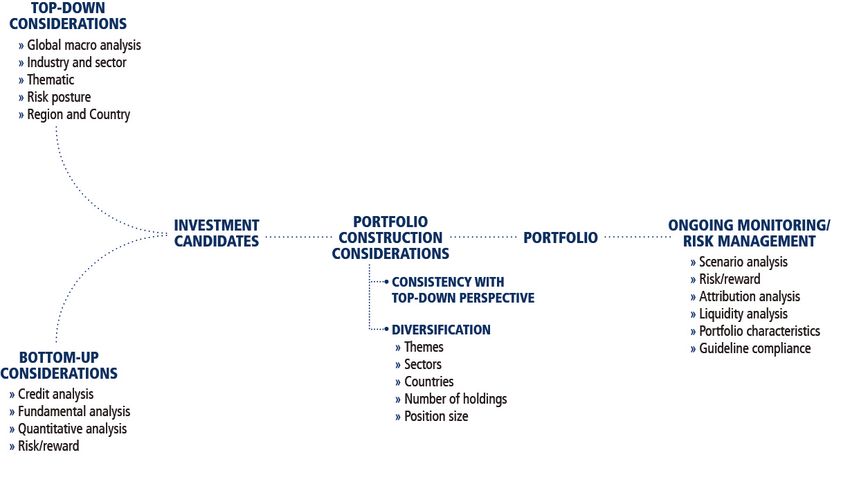
Calamos Investment Process

   Key Characteristics of Our
   Approach:

   • Global macro outlook
   • Bottom-up
     fundamental analysis
   • Capital structure
     research
   • High-conviction
     portfolios
   • Integrated, multi-team
     approach
   • Disciplined, consistent
     processes

                                                         Investment candidates emerge from the intersection of our top-down and bottom-up analysis.
                                                         Each security is further vetted within the context of the portfolio.
                                                         Ongoing monitoring and risk management seek to ensure appropriate risk/reward parameters are maintained.

There can be no assurance the fund(s) will achieve its investment objective.                                                                                  26
033059 0620Q IO
CALAMOS GLOBAL CONVERTIBLE CAPABILITIES

Capital Structure Research

                  Calamos Proprietary                                                 Calamos Proprietary                                  Calamos Proprietary
                     Credit Analysis                                                  Convertible Analysis                                    Equity Analysis

       •      Principal Safety – Credit Analysis                                •   Convertible Risk/Reward –                   •     Company Growth Prospects –
                                                                                    Convertible Analysis                              Equity Analysis
       •      Bankruptcy prediction
                                                                                •   Risk/reward                                 •     Earnings potential
       •      Industry comparison
                                                                                •   Theoretical valuation                       •     Cash Flow return on capital
       •      Multivariate analysis
                                                                                •   Protective covenants                        •     Expected return
       •      Probability and ratio analysis
                                                                                •   Expected return                             •     Management analysis and analyst
                                                                                                                                      recommendations

                                                                            Calamos Portfolio Construction Process

                               •      Portfolio Construction – Analysis of the                              •   Expected return on portfolio
                                      Security Relative to the Overall Portfolio                            •   Investment quality
                               •      Security risk/reward                                                  •   Cash flow from investment income
                               •      Overall portfolio risk/reward                                             o   Equity analysis
                               •      Sector participation                                                      o   Credit analysis
                               •      Industry/Sector diversification                                           o   Convertible analysis

There can be no assurance the strategy will achieve its investment objective.                                                                                           27
033059 0620Q IO
CALAMOS GLOBAL CONVERTIBLE CAPABILITIES

U.S. Convertible Market

       Convertible Market Assets ($bil)                                                                                                      Convertible Issuance ($bil)
     350                                                                                                                                     120
                                                              313                                                                                                   106
                                        293 289
     300                                                282                                                                                  100                                                      95
                                                  263                                                                                 266                                       88
     250                                                                        232
                              218 212                                     221                                                                 80
                                                                                                  211 208                       212                                                             71
                                                                                            194                                                                                                                                                                    67
                                                                                                            188
     200                                                            177               186                         178 186 171                                 61                                           59
                  166                                                                                                                                                     55
                        155                                                                                                                   60
                                                                                                                                                                                     49                                                                  51 53
     150   128                                                                                                                                                                                                                     44 44
                                                                                                                                                         39                                39                    38 37                      40
                                                                                                                                              40   35                                                                                            36 37
     100                                                                                                                                                                                                                  23 21
                                                                                                                                              20
      50

       0                                                                                                                                       0
                                                                                                                                      YTD          '98        '00         '02        '04        '06        '08      '10      '12      '14        '16     '18     YTD
                                                                                                                                                                                                                                                                   '20
           '98          '00       '02       '04         '06         '08         '10         '12       '14         '16     '18          '20
                                                                                                                                      ‘20                                                                                                                        ‘20

       Credit Quality (VXA0)                                                                                                                 Summary Statistics (VXA0)
                                                                                                                                              Average Current Yield                                                                  2.3%
                                                                          Investment
                                                                            Grade,                                                            Average Conversion Premium                                                             26.9%
                                                                             13%
                                                                                                                                              Average Investment Premium                                                             47.2%
                                                                                High Yield,
                                                                                                                                              Average Quality Rating                                                                  BB2
                                                                                   18%
                                                  Not Rated,
                                                    69%                                                                      Data as of June 30, 2020.
                                                                                                                             Source: BofA Global Research, ICE Data Indices, LLC; VXA0 Index, VNEW Index. Credit Quality — Reflects
                                                                                                                             the lower of the ratings of Standard & Poor’s Corporation and Moody’s Investors Service, Inc. and are
                                                                                                                             adjusted to the scale shown. Ratings are relative, subjective and not absolute standards of quality.
                                                                                                                             Conversion Premium is the amount by which the market price of a convertible bond or convertible
                                                                                                                             preferred exceeds conversion value, expressed as a percentage. It is a gauge of equity participation.
                                                                                                                             Current Yield reflects the dividends and interest earned during the 30-day period ended as of the date
                                                                                                                             stated above after deducting expenses for that same period.
Investment Premium is the amount that the market price of the convertible is above its investment value, expressed as a percent of the investment value. A zero coupon bond that is callable (by issuer), putable (by investor), and
convertible. LYONs are synthetic products that are financially engineered by Merrill Lynch. A mandatory convertible is a type of convertible bond that has a required conversion or redemption feature. Either on or before a
contractual conversion date, the holder must convert the mandatory convertible into the underlying common stock. Traditional convertible preferred stock is preferred stock that holders can exchange for common stock at a set
price after a certain date. Coupon convertibles bonds are convertibles with coupons, the interest rate stated on a bond when it's issued. See index definitions page.                                                             28
033059 0620Q IO
CALAMOS GLOBAL CONVERTIBLE CAPABILITIES

Global Convertible Market

     Convertible Market Assets ($bil)*                                                                                                           Convertible Issuance ($bil)
      600                               565                                                                                                      180                    167
                                              550                                                                                                                                   159                    163
                                                              518                                                                                160
      500                     456 462               455 467                                                                                      140
                  427
                                                                                408
                        386                                               390                                                             388    120                                                 112
      400                                                                                       365
            345                                                                       334 347         334               322         335                           101
                                                                                                                                                                              96          98
                                                                                                                                                 100                                                             93                          93 89                      92
                                                                    302                                     304               293                                                                                      85                                      85 85
                                                                                                                  289                                        83                                                                                       81 77
      300                                                                                                                                                                                                                   76                              75
                                                                                                                                                  80   72
                                                                                                                                                                                                63
                                                                                                                                                                                                                                       55
      200                                                                                                                                         60                                                                              47
                                                                                                                                                  40
      100
                                                                                                                                                  20

        0                                                                                                                                          0
                                                                                                                                          YTD          '98        '00         '02         '04        '06         '08        '10        '12      '14      '16   '18     YTD
                                                                                                                                                                                                                                                                        '20
            '98         '00       '02         '04       '06         '08         '10       '12         '14         '16         '18          '20
                                                                                                                                          ‘20                                                                                                                          ‘20

        Credit Quality (VG00)                                                                                                                          Summary Statistics (VG00)
                                                                                                                                                       Average Current Yield                                                                          1.5%

                                                                                                                                                       Average Conversion Premium                                                                     39.2%

                                                                          Investment                                                                   Average Investment Premium                                                                     26.2%
                                                                          Grade, 21%
                                                     Not                                                                                               Average Quality Rating                                                                         BBB3
                                                    Rated,
                                                                                      High Yield,
                                                     68%
                                                                                         10%

Data as of June 30, 2020.
Past performance is no guarantee of future results. *Convertible Market size is represented by the sum of the market capitalization of the ICE BofA regional convertible indicies. In 2015, BofA Convertible
Research began using pricing from third party data providers. Names that are not priced by those providers have been removed. Source: BofA Global Research, ICE Data Indices, LLC. The ICE BofA Global 300
Convertible Index is a global convertible index composed of companies representative of the market structure of countries in North America, Europe and the Asia/Pacific region.                                                                                      29
033059 0620Q IO
CALAMOS GLOBAL CONVERTIBLE CAPABILITIES

Calamos Global Convertible Strategy Annualized Returns %

  As of June 30, 2020
   20
                                                                                                                                           Calamos Global Convertible Composite (Gross of Fees)
              18.29                                                                                                                        Calamos Global Convertible Composite (Net of Fees)
   18                                                                                                                                      Refinitiv Global Convertible Bond Index
                       16.72

   16

   14

   12
                                 10.55           10.39
   10
                                                           8.92                      8.73
                                                                                                                         8.45                                                                    8.34
                                                                                                                                                             8.20
     8                                                               7.37                      7.25                                7.20      7.19                      7.08                                7.22
                                                                                                                                                                                                                     6.79
                                                                                                                                                                                 6.46

     6                                                                                                   5.62

     4

     2

     0
                      1-Year                              3-Year                              5-Year                             10-Year                             15-Year                   Since Inception (10/01)

Past performance is no guarantee of future results. Please see following pages for supplemental information.
Clients’ actual returns will be reduced by advisory fees and other expenses including custody, brokerage fees, and other services. Please see Calamos Advisors Form ADV Part 2A for standard fee structure. Please see
accompanying disclosures before making an investing decision. The composite and/or strategy discussed is not a registered Fund available for investment.                                                                    30
033059 0620Q IO
CALAMOS GLOBAL CONVERTIBLE CAPABILITIES

Calamos Global Convertible Strategy Calendar Year Returns

   As of June 30, 2020

                                   45%

                                   35%

                                   25%

                                   15%

                                     5%

                                    -5%

                                   -15%

                                   -25%

                                   -35%

                                   -45%
                                            YTD 20     2019     2018      2017     2016      2015     2014      2013     2012      2011      2010     2009      2008     2007      2006     2005      2004     2003      2002
       Calamos Global Convt Composite        11.73    16.23     -1.83    15.64      5.20     2.15      4.06     13.96     4.48     -0.94    13.34     32.98    -25.55    16.23    14.69      9.13     9.12     25.71     0.65
       Refinitive Global Convt Bond Index    5.37     16.47     -3.74    12.83      3.48     -2.11     1.71     18.18    13.33     -7.03    11.76     41.37    -31.73    11.26    17.95      0.05     9.16     24.57     -0.53
       MSCI World Index                      -5.48    28.40     -8.20    23.07      8.15     -0.32     5.50     27.37    16.54     -5.01    12.34     30.79    -40.33     9.57    20.65     10.02     15.25    33.76     -19.54

Past performance is no guarantee of future results. Please see following pages for supplemental information.
Clients’ actual returns will be reduced by advisory fees and other expenses including custody, brokerage fees, and other services. Please see Calamos Advisors Form ADV Part 2A for standard fee structure. Please see
accompanying disclosures before making an investing decision. The composite and/or strategy discussed is not a registered Fund available for investment.                                                                          31
033059 0620Q IO
CALAMOS GLOBAL CONVERTIBLE CAPABILITIES

Refinitiv Focus Index: What Are You Paying For?

                                                                 Annualized Performance
     The Refinitiv Focus Index:                                                                                                                   10 Yrs ended                   1 Yr ended
                                                                                                                                                  Dec 31, 2019                  Dec 31, 2008
     • Has underperformed the                                      Calamos Global Convertible Strategy (Gross of fees)                                7.03%                        -25.55%
       broader convertible
       market over the long term                                   Refinitiv Global Convertible Bond Index                                             6.13                         -31.66

     • Has not provided enough                                     Refinitiv Global Focus Convertible Bond Index                                       4.22                         -26.18
       relative downside
       protection (e.g., in 2008)

Past performance is no guarantee of future results. Source: Calamos Advisors, Bloomberg, and Morningstar. The Refinitiv Global Convertible Bond Index (USD) is a measure of the convertible
market. It has no restrictions on credit rating, may include mandatory convertible bonds and is unhedged. The Refinitiv Global Focus Convertible Bond Index is designed to measure the performance
of a segment of the convertible bond index, specifically, select larger balanced convertible bonds that meet monthly price and premium tests.                                                      32
033059 0620Q IO
CALAMOS GLOBAL CONVERTIBLE CAPABILITIES

Calamos Global Convertible Composite

                                                                           33
033059 0620Q IO
CALAMOS GLOBAL CONVERTIBLE CAPABILITIES

Calamos Global Convertible Composite

                                                                           34
033059 0620Q IO
CALAMOS GLOBAL CONVERTIBLE CAPABILITIES

Important Information
When we discuss volatility, our focus is on the variation of returns in our equity funds versus a full equity benchmark such as the S&P 500 Index. We consider a fund to have lower volatility when its beta versus the equity
benchmark is less than one. Beta is an historic measure of a fund’s relative volatility, which is one of the measures of risk. For example, a beta of 0.5 reflects half of the market’s volatility versus the index, while a beta of 2.0
would indicate twice the volatility of the index. From this perspective, the fund has a lower risk profile than its benchmark. There is no assurance that a fund will achieve or deliver low volatility results.

The S&P 500 Index is generally considered representative of the U.S. stock market. The Bloomberg Barclays Capital U.S. Aggregate Bond Index covers the U.S.-denominated, investment-grade, fixed-rate, taxable bond
market of SEC registered securities. The index includes bonds from the Treasury, Government-Related, Corporate, MBS (agency fixed-rate and hybrid ARM pass-throughs), ABS, and CMBS sectors. The ICE BofA All U.S.
Convertibles Index (VXA0) is comprised of approximately 700 issues of only convertible bonds and preferreds of all qualities. The Bloomberg Barclays U.S. Government/Credit Index is comprised of long-term government
and investment grade corporate debt securities. The Credit Suisse High Yield Index is a measure of the U.S. high yield market. The ICE BofA U.S. High Yield Master II Index tracks the performance of U.S. dollar denominated
below investment grade rated corporate debt publically issued in the U.S. domestic market. The ICE BofA Preferred Stock Fixed Rate Index consists of fixed rate U.S. dollar denominated preferred securities and fixed-to-
floating rate securities that are callable prior to the floating rate period and are at least one year from the start of the floating rate period. The ICE BofA All Investment Grade U.S. Convertibles Index is a measure of
investment grade convertibles. The ICE BofA Convertible New Issue Index (VNEW) consists of convertibles issued within the preceding six months.

Unmanaged index returns assume reinvestment of any and all distributions and, unlike fund returns, do not reflect fees, expenses or sales charges. Investors cannot invest directly in an index. Past performance is no
guarantee of future results. Indexes are unmanaged, do not reflect fees and expenses and are not available for direct investment. Information contained herein is derived from sources believed to be reliable, but we
cannot guarantee its accuracy, completeness, or timeliness.

Fixed income securities are subject to interest rate risk, credit risk, and liquidity risk. If rates increase, the value of fixed income investments generally declines.

The price of equity securities may rise or fall because of changes in the broad market or changes in a company’s financial condition, sometimes rapidly or unpredictably. These price movements may result from factors
affecting individual companies, sectors or industries or the securities market as a whole, such as changes in economic or political conditions.

As a result of political or economic instability in foreign countries, there can be special risks associated with investing in foreign securities, including fluctuations in currency exchange rates, increased price volatility and
difficulty obtaining information. In addition, emerging markets may present additional risk due to potential for greater economic and political instability in less developed countries.

The opinions referenced are as of the date of the publication, are subject to change due to changes in the market or economic conditions, and may not necessarily come to pass. Information contained herein is for
informational purposes only and should not be considered investment advice. Past performance is no guarantee of future results. Calamos UCITS Fund are sub-fund of Calamos Global Funds PLC, an investment company
with variable capital incorporated with limited liability in Ireland (registered number 444463). Calamos Global Funds PLC has been established as an umbrella fund with segregated liability between sub-funds and is
authorized pursuant to the European Communities (Undertakings for Collective Investment in Transferable Securities) Regulations 2003 as amended. Calamos Global Funds may not be offered or sold to citizens or
residents of the United States and should not be offered for sale or sold in the United States, its territories or possessions.

The Fund is offered solely to non-U.S. investors under the terms and conditions of the Fund’s current prospectus. The prospectus contains important information about the Fund and should be read carefully before
investing. A copy of the full and simplified prospectus for the Fund may be obtained by visiting www.calamos.com/global, or by contacting the local Paying Agent listed by jurisdiction at www.calamos.com/global, or
through the Fund’s Transfer Agent, RBC Investor Services Ireland Limited. Unmanaged index returns assume reinvestment of any and all distributions and, unlike fund returns, do not reflect fees, expenses or sales charges.
Investors cannot invest directly in an index.

Sources: Calamos Advisors LLC, RBC and Mellon Analytical Solutions, LLC.
Calamos Investments LLP is Authorized and Regulated by the Financial Conduct Authority.
© 2020 Calamos Investments LLC. All Rights Reserved. Calamos® and Calamos Investments® are registered trademarks of Calamos Investments LLC.

Calamos Investments LLC                                                     Calamos Global Funds PLC
2020 Calamos Court                                                          RBC Investor Services Ireland Limited
Naperville, IL 60563                                                        George’s Quay House
Tel: +1.630.955.4899 x 3943 | U.S. Toll Free: +1.877.663.8056               43 Townsend Street | Dublin 2 | Ireland
Email: globalinfo@calamos.com                                               Tel: +353 1 440 6555 | Fax: +353 1 613 0401
                                                                            www.calamos.com/global
                                                                            E-mail: dublin_ta_customer_support@rbc.com

                                                                                                                                                                                                                                           35
033059 0620Q IO
You can also read