Media Industry Accounting Group Annual conference 2017 - www.pwc.com/miag
←
→
Page content transcription
If your browser does not render page correctly, please read the page content below

www.pwc.com/miag

               Media Industry
               Accounting Group
               Annual conference 2017
London
15 June 2017
Global entertainment and
      media outlook 2017-2021
            Phil Stokes
            PwC UK
            E: phil.stokes@pwc.com

PwC
Never Before
      HAS CHANGE OCCURRED IN SUCH
         SHORT PERIODS OF TIME.

PwC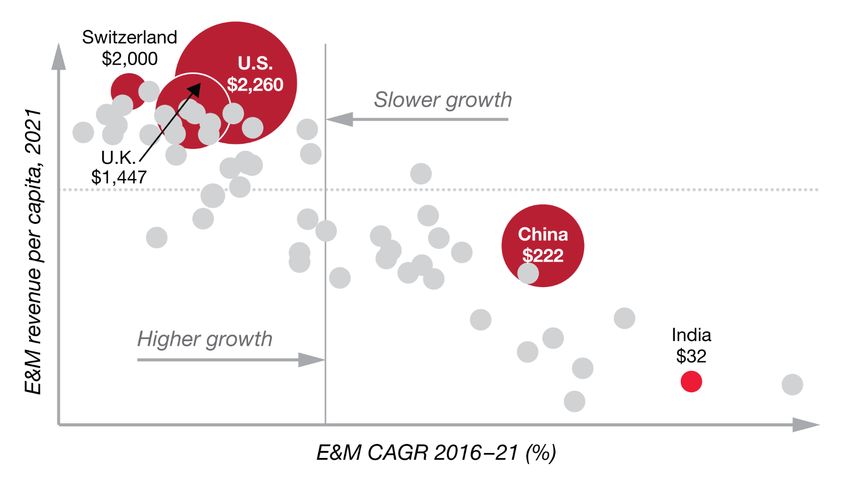
Disruptive forces are
              rapidly reshaping our world.
              Five inescapable world trends are acting together and driving change.

                                           Right now

Demographic       Shift in global      Accelerating          Resource scarcity        Technological
shifts            economic power       urbanisation          and climate change       advances

  PwC                                                                                                 4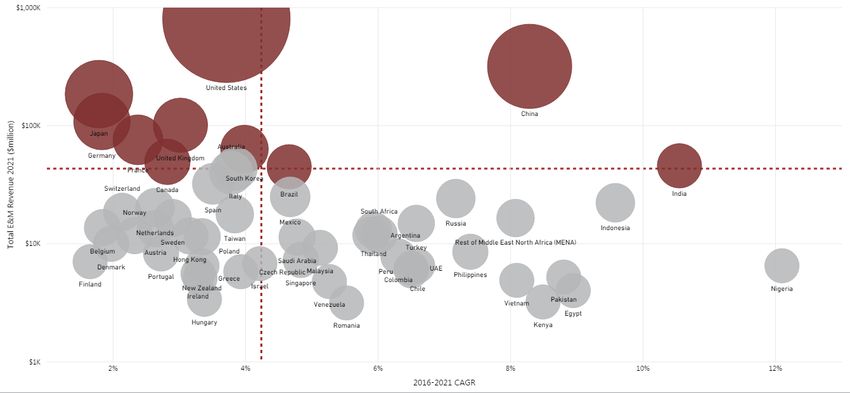
Disruptive forces are
            rapidly reshaping our businesses.
           Organizations must take actions now to prepare for the disruptive opportunities and
                                evolving platforms of the next few years.

                                               Right now

           Technology forces                  Societal Forces                 Regulatory Forces
      Smart Device Proliferation and         Consumerisation and                      Privacy and
        Ubiquitous Connectivity             Always On expectations          Shifting Regulatory Landscape
PwC                                                                                                         5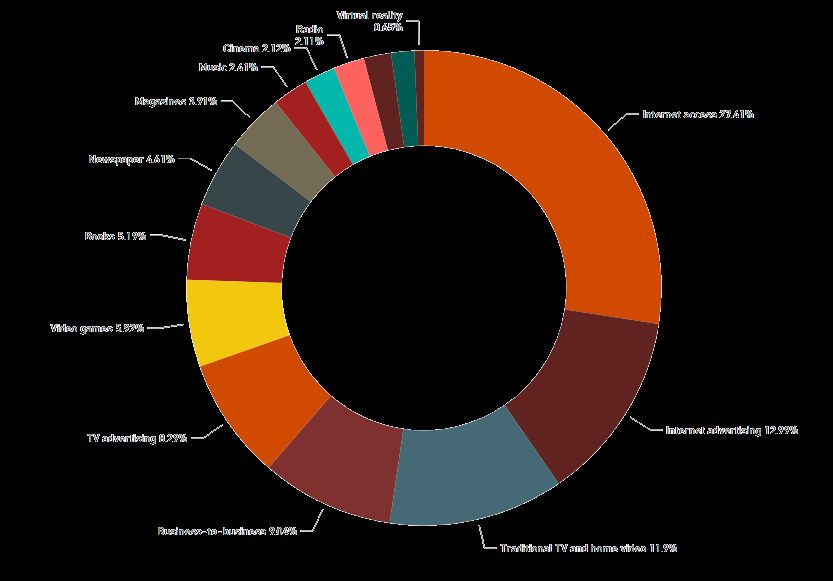
The world is in beta.
                              Technologies, trends, markets and economies
                                     are in a constant state of flux.

                                                   Right now

Competitive advantage is   It is no longer about long-   Organizations must have     This may mean setting up
transient                  term strategies to sustain    the agility, empowerment,   new businesses and
                           a competitive advantage       and the confidence to       allowing outdated versions
  PwC                                                    change                      to die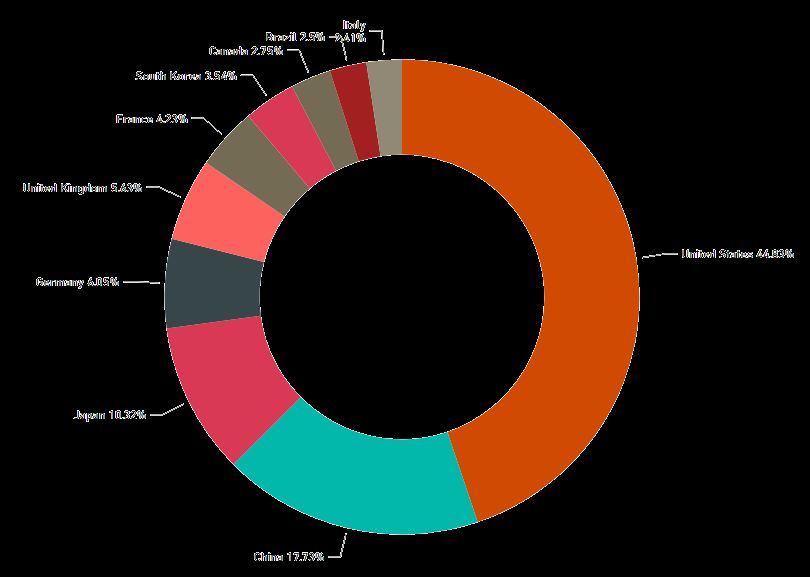
The business environment
                      is ripe for the disruptors.
         Disruptors see the future, build scalable platforms, and experiment restlessly and boldly.

                                                  Right now

Disruptors do not           More importantly, they       They have an insatiable     They see the future,
respect incumbent or        are not held back by those   focus on the customer       build scalable
classical organizational    structures                                               platforms, and
structures
   PwC                                                                               experiment relentlessly
                                                                                                          7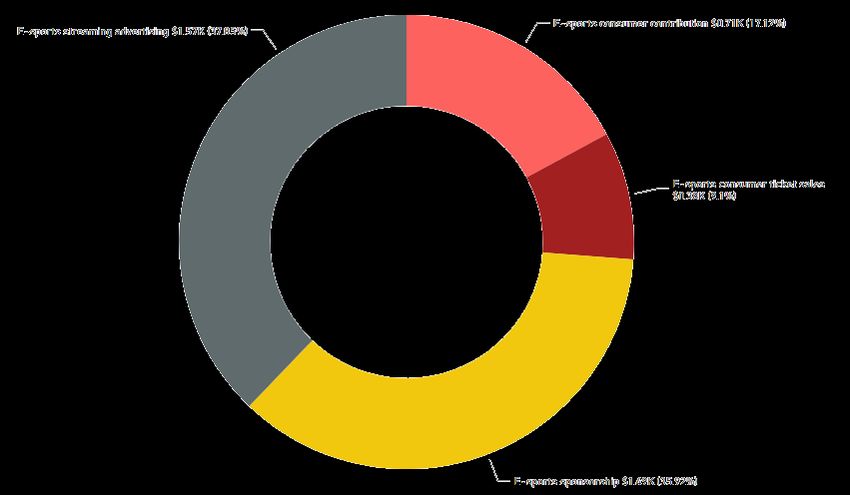
Organisations must innovate today.
                 Leaders who do not listen to their stakeholders and change will be
                  passed by as their markets and customers move without them.

                                                Right now

Customers are   Organisations can          Market dominance can     Siloed decision         Innovation will drive
digital         generate deeper insights   quickly be lost to new   making is a signal of   success
                than ever before           entrants                 impending failure
    PwC                                                                                                      8
From 2017 a new breed of customer will dominate - the Digital
Natives
Enabling total customer centric business models

            Digital now enables businesses to compete on the basis
             of helping customers achieve their desired outcomes.
There is an increasing need to build digital trust
The new trust dynamic: trust + opportunity = growth
OpportunityA roadmap for the biggest business challenges
Know Define Evolve Create Accelerate Protect
The new core competencies required to survive and thrive in the digital age
Know Define Evolve Create Accelerate Protect
your your your total sustainable time to market your assets from
customers , business business in value for through smart, the threats of
markets and strategy for response to customers and sustainable the digital age
ecosystem the digital digital shareholders delivery to build
age disruption through models stakeholder
innovation trustIn a world that’s in Beta…
…we believe successful companies
need to focus on three major
imperatives…
Trust
Speed and Agility
Constant Innovation
Global E&M Outlook 2017-2021For Entertainment & Media companies this translates
into three specific themes
Develop seamless consumer
relationships across
distribution channels
Put mobile (and increasingly video)
at the centre
Innovate around the product and
user experience
Global E&M Outlook 2017-2021The future of E&M is… fan-tastic!
Knowing what drives
‘fandom’ and who your Extending franchises
most engaged fans into experiences
really are
Becoming a
Fan-Centric
Company
Selling to fans
Building direct-to-
(not to “eyeballs”)
consumer destinations
wherever they may be
Aligning operations to
provide ‘value’ – invest
in what makes a
difference for fans
Global E&M Outlook 2017-2021Build businesses and brands around active, higher value communities of users Global E&M Outlook 2017-2021
User experience
takes centre stage      4.2%
in today’s global    Projected industry
multi-speed media    growth 2017–2021

landscape
Focusing on the user experience creates growth
  opportunities in a challenging economic environment

  Global E&M Growth
                                         2.54%                                  Global E&M revenue as a
  7.0%                                               2.53%                      share of global GDP
                                                               2.52%
  6.0%                                                                  2.48%
                                                                                  2.44%
  5.0%                                                                                    2.39%

  4.0%

                                                                                                  4.2%
  3.0%                                                                                                     CAGR

  2.0%
                                                                                                    3.6%

  1.0%

  0.0%
           2013     2014       2015      2016        2017      2018     2019      2020    2021
                               E&M excluding internet access     Total E&M

Global E&M Outlook 2017-2021
Internet video, internet ads, gaming and access are
the engines powering global E&M growth
CAGR minus GDP growth by segment
2016-2021 (% points)
Internet video 6.0
four major
Internet advertising 4.3
growth
Video games drivers 2.7
Internet access 0.5
Cinema -1.2
OOH -1.7
Music -2.0
TV advertising -2.8
B2B -2.9
Radio -3.4
Traditional TV & video -4.2
Books -4.5
Magazines -6.0 E&M CAGR: 4.2%
Newspapers -8.3 GDP CAGR: 5.6%
Global E&M Outlook 2017-2021Top E&M countries
The United States is projected to remain the largest E&M market through
2021, however the % of total E&M spend the US represents is declining
France 4%
United Kingdom 6%
Projected % of United States 45%
Germany 6% E&M Revenue in
2021
(top markets)
Japan 10%
China 18%
Global E&M Outlook 2017-2021Global E&M Markets
• Each bubble represents a country
• Size of bubble represents total E&M revenue
Total Global E&M Revenue Projections 2021
(USD Millions)
2017 – 2021 CAGR (%)Quadrants
5% CAGR
Mature Next Wave
Average Projected
Size Growth
2021 revenue ($US bn) 2016-2021 CAGR
US$10 bn $77.1 3.2%
$52.1 8.3%
$5.9 7.1%
Slow Up &
Growing Comers $6.6 3.1%
bigger
faster
Global E&M Outlook 2017-2021The most rapid growth rates are in newly emerged markets, where per capita spending is generally low Global E&M Outlook 2017-2021
Demographics – youth will be served…

Global E&M Outlook 2017-2021
Technology and digital media have changed the way
  younger generations experience and purchase content

  US household spending by generation
  (US$)

                                        Millennials
                                        spend
                                        significantly
                                        less on
                                        entertainment
                                        annually than
                                        baby boomers
                                        and
                                        Generation X.

Global E&M Outlook 2017-2021
www.pwc.com/outlook
Consumer/end-user & 5 year historic &
54 Countries 17 segments
advertising spending 5 year forecast data
Access Read Watch Listen Play
Internet access Books Box office Music eSports
Data Traditional
B2B Radio Video games
consumption TV & video
Internet Virtual
Magazines
video reality
TV
Newspapers
advertising
Internet
OOH
advertisingSources of Global revenue growth
Size Growth
2021 share of revenue 2016-2021 CAGR
Advertising
30% 4.2%
$677 bn
Access spend
29% 6.0%
$647 bn
Consumer spend 41% 3.1%
$912 bn
Global E&M Outlook 2017-2021Global revenue of $2.2 trillion by segment
Internet access 27%
Internet
Access
represents
the largest
percentage
(27.4%) of
global E&M
spend,
followed by
Video Games 6%
Internet
Advertising
and
Traditional
TV and
Home Video TV Ads 8% Internet ads 13%
Business-to-business 9%
Traditional TV & home video 12%
Global E&M Outlook 2017-2021Segment global growth rates
CAGR 2016-21
Radio 2.1% TV advertising 2.8% B2B 2.7%
OOH 3.8%
Video games 8.2% Internet access 6.0%
Newspaper -2.7%
Internet video 11.6% Music 3.5%
Magazines -0.5%
Traditional
1.3% Cinema 4.4%
TV/video
Internet
9.8% Books 1.1%
advertising
Global E&M Outlook 2017-2021Summary by consumer experience and segment
Global Revenue & CAGR Global Growth by Top Revenue
$700 Contributing Segments
Access 6.0%
(CAGR 2016-21)
$600
$350
$500
$300 Internet advertising 9.8%
Revenue US$ bn
TV and video 1.3%
$400 $250
Revenue US$ bn
Watch 2.5%
$200 B2B 2.7%
$300
Read 0.1% TV advertising 2.8%
$150
$200
Play 10.4% $100
Video games 8.2%
$100 Listen 3.5% $50 Internet video 11.6%
$0 $0
2012 2013 2014 2015 2016 2017 2018 2019 2020 2021 2012 2013 2014 2015 2016 2017 2018 2019 2020 2021
Note: Above summaries exclude B2B and all advertising.
Global E&M Outlook 2017-2021Internet access - $647 bn
Global internet access revenue Mobile internet subscribers, mn
APAC 1,648
2,455
EMEA 626
907
Latin America 244
381
North America 299
329
2012 2013 2014 2015 2016 2017 2018 2019 2020 2021
Mobile Fixed 2016 2021
Governments and regulatory bodies in many markets are taking steps to increase competition
as well as coverage through changes in law, regulation or by licensing new operators.
Global E&M Outlook 2017-2021Data consumption
Global data consumption, MB mn Data consumption CAGR 2016-21
1,200 31.7%
Smartphone
72.9%
1,000
800 17.6%
Fixed broadband
21.8%
600
16.6%
400 Other portable
38.6%
200
-8.2%
Non-smartphone
0 21.1%
2012 2013 2014 2015 2016 2017 2018 2019 2020 2021
Global India
Strong continued growth is expected in both mature
The single biggest driver of growth is the increased markets such as the US and less developed markets
adoption of smartphones and, in particular, the rise such as India and Brazil. India overtook the US as
of video viewing on smartphones. the world’s second-largest smartphone market in
2015.
Global E&M Outlook 2017-2021Internet advertising - $303 bn
Global advertising revenue & CAGR
$350
$300
Revenue US$ bn
$250 CAGR 9.8% Internet advertising: $303 bn in 2021
$200 TV advertising: $194 bn in 2021
$150 CAGR 2.8%
$100
$50
$0
2012 2013 2014 2015 2016 2017 2018 2019 2020 2021
Internet TV
Global internet advertising grew by 19% YOY to surpass TV in 2016. Its 2016-2021 CAGR of
9.8% makes it 40% of total advertising in 2021, versus 26% for TV.
Global E&M Outlook 2017-2021Internet advertising - $303 bn
Global internet advertising revenue Projected growth
CAGR 2016-2021
Wired 2.5%
Mobile 18.5%
2012 2013 2014 2015 2016 2017 2018 2019 2020 2021
Mobile Wired
Innovation including harnessing artificial
Mobile will overtake wired advertising in
intelligence to track ads across platforms and
2019 growing to account for 56% of internet
create personalised targeting, will be a
advertising globally by 2021.
significant long-term opportunity.
Global E&M Outlook 2017-2021Internet video - $37 bn
Global Internet video vs.
Projected growth
physical home video revenue 2016-2021 CAGR
Internet 11.6%
-8.8% Physical
2012 2014 2016 2018 2020
Internet Physical
With the physical market continuing to There are a growing number of routes to the
decline, global Internet video revenue will audience due to the rise of Internet video,
overtake it for the first time in 2017 and shifting the emphasis towards content rights,
increase the gap over the forecast period. licensing deals and original productions.
Global E&M Outlook 2017-2021TV advertising - $194 bn
Projected growth Distribution of revenue
2016-2021 CAGR 2021
Online
12.4% Online 6%
Multichannel
4.6% Multichannel 28%
1.5% Terrestrial
Terrestrial
66%
Although advertisers in most markets still look to traditional TV for the largest audiences –
often live sporting events – there’s an increasing trend towards a multiplatform approach.
Driving consumers online to discuss TV content and advertising through social media, or
offering enhanced versions of advertising on video platforms like YouTube, ensures campaigns
connect with audiences more effectively.
Global E&M Outlook 2017-2021Traditional TV and home video - $277 bn
TV subscription revenue projected TV subscriptions
growth 2016
2016-2021 CAGR
Households
US 98
Global 2.3%
mn
India 154
Revenue
US $101
US$ bn
India $8
Investment in exclusive entertainment programming, original productions and sporting rights
is increasing each year. Companies in mature markets are responding with consolidation for
scale and content rights.
Global E&M Outlook 2017-2021Video games - $138 bn
Projected growth Distribution of consumer revenue
2016-2021 CAGR 2021
11.9% Social/Casual
PC
2.7% Console 25%
Social/casual
5.9% PC 56%
Consumer spending: $133 bn in 2021 Console
19%
Advertising: $5 bn in 2021
Social/casual gaming shows significant growth due to a huge global audience with increasingly
capable devices, low barriers to entry in terms of game costs and a business model that, if
successful, can propel a developer into the mainstream.
Global E&M Outlook 2017-2021Cinema - $50 bn
Box office revenue Box office projected growth
US$ bn 2016-2021 CAGR
2016 $37.1
Global Global 4.4%
2021 $46.0
Consumer spending: $46 bn in 2021
Advertising: $4 bn in 2021
APAC will experience the highest regional growth in box office revenue to US$20.4bn by 2021, a
CAGR of 7.9%. China and India will add a combined US$5.6 bn over the forecast period, or 63%
of global box office growth.
Global E&M Outlook 2017-2021Out-of-home advertising - $44 bn
Global OOH revenue Projected growth
2016-2021 CAGR
-0.3% Physical
Global
10.7% Digital
2012 2013 2014 2015 2016 2017 2018 2019 2020 2021
Digital Physical
Distinct advantages of digital OOH have enabled this format to be the main driver of revenue
growth through 2016, accounting for 82.3% of the increase in global OOH revenue since 2012.
Global E&M Outlook 2017-2021Music - $56 bn
Global digital music revenue Recorded music projected growth
2016-2021 CAGR
-11.6% Physical
Global
11.8% Digital
Recorded music : $27 bn in 2021
2012 2013 2014 2015 2016 2017 2018 2019 2020 2021
Live music: $29 bn in 2021
Downloading Streaming
Global music streaming revenue grew 65% YOY in 2016 to overtake downloading by a $3.2 bn
margin. Exploring alternatives such as strategic partnerships will be necessary for stand-alone
streaming providers in a highly competitive market.
Global E&M Outlook 2017-2021Business-to-business - $210 bn
Total B2B growth Business information projected
2016-2021 CAGR growth
2016-2021 CAGR
2.0% Non-Digital
3.7%
7.1% Digital
The business information sub-segment is the cornerstone of B2B revenue. The increasing
uncertainty from economic and geopolitical risks will contribute to continued global business
information growth to $118.4 bn by 2021.
Global E&M Outlook 2017-2021Radio - $49 bn
Digital music streaming Radio advertising projected growth
share of total radio 2016-2021 CAGR
15%
2016 Global 2.0%
35%
2021 Advertising: $37 bn in 2021
India
Licence fees: $6 bn in 2021
Satellite subscriptions: $6 bn in 2021
Traditional radio broadcasters and streaming music service providers are beginning to cross
over in terms of offering spoken word content and streaming on-demand services. This could
pave the way for a new business model for radio broadcasters.
Global E&M Outlook 2017-2021Books - $121 bn
Projected growth
2016-2021 CAGR
0.5% Educational Educational books: $37 bn in 2021
1.6% Consumer Consumer books: $63 bn in 2021
0.5% Professional Professional books: $21 bn in 2021
Pricing in consumer books continues to cause challenges. Bricks-and-mortar booksellers simply
cannot compete on price with online booksellers—nor can they offer the range of titles that an
online seller can.
Global E&M Outlook 2017-2021Magazines - $91 bn
Projected growth, Distribution of revenue
CAGR 2016-2021 2021
Trade Circulation 8%
-0.9% Consumer
1.5% Trade Trade Advertising 11%
Consumer Advertising 34%
Consumer Circulation 47%
Consumer magazines: $74 bn in 2021 Global
Trade magazines: $17 bn in 2021
Publishers are under pressure from changes in consumer content-consumption, specifically
video content. Consumer titles are looking for ways to reduce their reliance on Facebook and
YouTube now which now dominate ad revenue spend in most markets. Trade titles have had
success diversifying into events to drive revenue growth.
Global E&M Outlook 2017-2021Newspapers - $107 bn
Global newspaper revenue Projected growth
$US bn CAGR 2016-2021
$127
Print
-4.02%
$8
Digital
6.13%
2012 2013 2014 2015 2016 2017 2018 2019 2020 2021
Circulation: $58 bn in 2021
Digital Print
Advertising: $49 bn in 2021
The global market is in long-term marginal decline. Consumers in Europe, North America and
Australasia continue to abandon print for digital channels. However, print consumption is still
growing strongly in Asia Pacific, now accounting for 60% of daily print circulation.
Global E&M Outlook 2017-2021Virtual reality - $15 bn
VR revenue Distribution of revenue
US$ bn 2021
App
$16 1%
$12
$8 Video
53% Gaming
$4 46%
$0
2016 2017 2018 2019 2020 2021
Global US China Japan
The end game for hardware companies will be Content will evolve into a market for video
attempting to become the standard platform for VR streaming, microtransactions and potentially a
and hence start to charge royalties or commission premium for VR video added to monthly pay-TV or
from content sales. OTT bills.
Global E&M Outlook 2017-2021Virtual reality
Global VR units Portable VR units
millions
240 240
180 180
120 120
60 60
0 0
2016 2017 2018 2019 2020 2021 2016 2017 2018 2019 2020 2021
Home Portable Dedicated Mobile
VR headsets based on smartphones are set to Interestingly, by 2021 we will also see enough
dominate in terms of usage numbers, and currently headsets in consumer hands to drive an advertising
this means a variety of implementations from market. VR video in particular will also benefit here
various phone manufacturers. given the immersive nature of the experience.
Global E&M Outlook 2017-2021Virtual reality
Virtual reality revenue is also poised for growth, with video and gaming
representing the majority of revenue
Virtual reality apps
(2%)
Virtual reality is one of
the most interesting Virtual reality video Virtual reality
(51%) gaming (47%)
media formats available,
offering highly engaging
content and an
immersive consumer
experience at an
increasingly affordable
price point Virtual reality revenue (size growth) by year
Global E&M Outlook 2017-2021E-sports - $0.9 bn
E-sports total revenue E-sports projected growth
US $ mn 2016-2021 CAGR
$750
Streaming
31.9%
advertising
$500
Consumer ticket
23.7%
sales
$250
Consumer
contribution 17.2%
$0
2012 2013 2014 2015 2016 2017 2018 2019 2020 2021 Sponsorship 13.8%
Consumer Advertising
Total e-sports revenue has seen strong growth over
New games, a growing audience, and suitable
the historic period as interest rises worldwide,
infrastructure development worldwide will
tournaments and leagues become more
contribute to consumer ticket sales CAGR of 23.7%
sophisticated, and sponsorship and other
through 2021.
development money pours in to the discipline.
Global E&M Outlook 2017-2021E-sports
E-sports total revenue E-sports ad revenue
US $ mn US $ mn
$1,000 $450
$360
$750
$270
$500
$180
$250 $90
$0 $0
2012 2013 2014 2015 2016 2017 2018 2019 2020 2021 2016 2017 2018 2019 2020 2021
Global US South Korea China Sponsorship Streaming advertising
South Korea was the largest market in the early Streaming advertising should rise strongly to
years of the historic period, but was overtaken by overtake sponsorship in 2018. The two streams
the US in 2015, with the latter due to extend its lead combined will account for nearly 75% of total
by the end of the forecast period. revenue in 2021.
Global E&M Outlook 2017-2021eSports
eSports revenue is poised for dramatic growth, with advertising and
sponsorships enabling much of the growth
eSports streaming eSports consumer
adverts (38%) contribution (17%)
eSports includes eSports
consumer
consumer and ticket sales
advertising spending on (9%)
organized video game
competitions online and
offline across one-off
events and organized
leagues. This segment eSports sponsorships
(36%)
introduces a new brand
of entertainment that eSports revenue is projected to grow by over 2,000 percent
appeals largely to
younger audiences but
has a growing fan base
Global E&M Outlook 2017-2021Deep dive: Publishing
Publishing within the Outlook

Books                          Magazines                      Newspapers

 Comprises revenue generated   Comprises revenue from:        Comprises revenue from:
 from the sale of:
                               •     Consumer-focused         •     Circulation (consumer
 •   Consumer books                  magazines                      spend on newspapers)

 •   Educational books         •     Trade magazines          •     Advertising in newspapers

 •   Professional books

       Consumer only               Consumer and advertising       Consumer and advertising
      Print and digital                Print and digital              Print and digital

Global E&M Outlook 2017-2021
Key global themes and trends
Overall publishing is in a slow decline. However there are pockets of growth in
1 certain sub segments and markets.
Magazines and books will gain share of the global publishing market as they
2 transition to digital platforms more successfully.
Digital consumer magazine advertising will add more revenue over the
3 forecast period than any other sub segment of publishing, a total of $6.1 bn.
Trade magazine advertising is the only sub segment forecast to generate more
4 revenue from digital formats than print, reaching this tipping point by 2021.
As advertiser funding diminishes, income from newspapers’ primary customer
5 base, consumers, will become more important in publishers’ total revenue mix.
Global E&M Outlook 2017-2021Publishing macro trends
Publishing revenues, US$B Growth, CAGR 2016-21
$339 Newspapers -2.7%
2016
Magazines -0.5%
2021 $332
Books 1.1%
-0.7% $320
Growth, CAGR 2016-21
Print -2.7%
2012 2013 2014 2015 2016 2017 2018 2019 2020 2021
Digital 8.4%
Overall publishing is in a slow decline. However there are
pockets of growth in certain sub segments and markets.
Discounted pricing for print versions will help sustain overall
growth in books.
Global E&M Outlook 2017-2021Print vs digital
Publishing revenues, US$B Growth, CAGR 2016-21
$314
$283 7.6%
$246 Books
-0.6%
11.0%
Magazines
-3.5%
$73 6.1%
$49 Newspapers
$26 -4.0%
2012 2013 2014 2015 2016 2017 2018 2019 2020 2021 Digital Print
Digital Print
Trade magazine advertising is the only
Increases in digital format revenues will not
publishing sub segment forecast to generate
be enough to make up for declines in print
more revenue from digital formats than
formats over the forecast period.
print, reaching this tipping point by 2021.
Global E&M Outlook 2017-2021Publishing mix changes
Share of publishing revenues Distribution of revenues, 2021
2016 35%
Books
2021 38% 72%
75%
84%
28%
Magazines
29%
25% 28%
16%
37%
Newspapers Books Magazines Newspapers
34%
Digital Print
Magazines and books will gain share of the global Books and magazines will generate about
publishing market as they transition to digital
platforms more successfully. Newspapers are
one-quarter of revenues from digital
having a harder time monetizing the shift to digital. platforms by 2021.
Global E&M Outlook 2017-2021Growth drivers in publishing
Revenues by sub segment Revenue added 2016 to 2021
US$ bn US$ bn
$16
Digital consumer books 6.9% CAGR Digital
$14 consumer
magazine $6.1
$12 advertising
$10 Digital consumer magazine
advertising 11.8% CAGR
$8 Digital
consumer books $4.3
$6
$4
Digital professional books 7.5% CAGR Digital
$2 professional $2.6
books
$0
2012 2013 2014 2015 2016 2017 2018 2019 2020 2021
Digital consumer magazine advertising will add
more revenue over the forecast period than any
other sub segment of publishing, a total of $6.1 bn.
Digital consumer books and professional books will
round out the top three growth sub-segments.
Global E&M Outlook 2017-2021Country ranking: books
Color legend
Top 10 largest books country
China & India rank in the top 10 among both
Top 10 fastest growing books country
the largest and fastest growing books markets,
making them attractive opportunities. Countries that sit in both lists
Global E&M Outlook 2017-2021Country ranking: magazines
Color legend
Top 10 largest magazine country
The US and China are the largest magazine
Top 10 fastest growing magazine country
markets in terms of revenue. These two
territories will account for 53% of the global Countries that sit in both lists
market by 2021.
Global E&M Outlook 2017-2021Country ranking: newspapers
Color legend
Top 10 largest newspaper country
India and Indonesia rank in the top 10 among
Top 10 fastest growing newspaper country
both the largest and fastest growing newspaper
markets, making them attractive opportunities. Countries that sit in both lists
Global E&M Outlook 2017-2021Deep dive: Internet video
Internet video within the Outlook

                                      SVOD

     Revenue from stand-
     alone subscription video                       Revenue from
     on demand (SVOD)                               transactional video on
     services delivered over the                    demand (TVOD) services
     open Internet, such as        Internet Video   (such as iTunes), that
                                                    deliver filmed
     Netflix.
                                                    entertainment content via
                                                    the open Internet and
                                                    which do not require a
                                                    subscription.

                                      TVOD

Global E&M Outlook 2017-2021
Key global themes and trends
Internet video’s growth has been underpinned by improving broadband
1 coverage and a wide range of OTT launches globally.
The internet video distribution ecosystem is diversifying, as old and new
2 media are building direct to consumer relationships as well new aggregators.
With an abundance of content delivery platforms new content will
3 increasingly be the differentiating factor.
Global expansion was the key trend in 2016 with the big international SVOD
4 players launching in the majority of markets.
Investment in original content is rising beyond major headline shows and
5 towards deals with local production houses to boost take-up in new markets.
Global E&M Outlook 2017-2021Internet video
Internet video revenues Growth, CAGR 2016-21
US$ bn
$40.0
SVOD 13.1%
11.6%
$30.0
$20.0
TVOD 7.4%
$10.0
$0.0
2012 2013 2014 2015 2016 2017 2018 2019 2020 2021
Global Internet video revenue reached US$21.2bn in 2016,
The Internet video market is exhibiting strong growth
having risen from US$6.3bn in 2012. The segment’s growth
worldwide as home video shifts from the purchase and rental
has been underpinned by improving broadband coverage
of physical goods such as DVDs, to the increasingly
and a wide range of OTT launches from pay-TV operators
competitive over-the-top (OTT) market.
and standalone services alike.
Global E&M Outlook 2017-2021Internet video mix changes
Distribution of revenue Internet video ecosystem
diversification
SVOD
TVOD 55%
45%
TVOD
24% Direct to
2012 SVOD Consumer
76%
2021
With many pay-TV providers launching OTT initiatives
Internet video growth has been dominated by SVOD, which
around the world, Internet video is becoming increasingly
accounted for 55% of Internet video revenue in 2012. This
core to service provider’s product portfolios. Many pay-TV
will rise to nearly three-quarters by 2021, with the remainder
OTT services are not primarily about taking on Netflix or
attributable to transactional VOD platforms such as Apple’s
Amazon, but monetising viewers who have previously
iTunes and Sky’s Sky Store.
avoided paying for content.
Global E&M Outlook 2017-2021SVOD
SVOD revenues by region Growth, CAGR 2016-21
US$ mn
$20,000 APAC 19.5%
$15,000
EMEA 13.1%
$10,000
$5,000 LatAm 11.5%
$0
2012 2013 2014 2015 2016 2017 2018 2019 2020 2021 North America 10.9%
North America EMEA APAC LatAm
Global expansion was the key trend in 2016 with the big APAC exceeded EMEA in SVOD revenues in 2016. The
international SVOD players launching in the majority of number of domestic services offering local content and
markets. Companies are keen to market their exclusive original productions is spurring the market across this
content to the widest possible audience. region and is projected to reach $6.9 bn by 2021.
Global E&M Outlook 2017-2021Country ranking: SVOD
Color legend
Top 10 largest SVOD country
The US and China dominate the SVOD market
Top 10 fastest growing SVOD country
and, combined, will represent nearly two-thirds
of the global market by 2021. Countries that sit in both lists
Global E&M Outlook 2017-2021 69Country ranking: TVOD
Color legend
The US, UK, China, Japan, and Canada are Top 10 largest TVOD country
projected to experience the greatest revenue Top 10 fastest growing TVOD country
additions through 2021. Combined, these Countries that sit in both lists
markets will account for 74% of global TVOD
growth.
Global E&M Outlook 2017-2021 70Strategic questions PwC
Maximising the value of content: Blending data
and intuition
      15-second download

      With traditional measures of content performance having          What role do ‘big data’ and
      been thrown into flux by the explosion in digital channels       data analytics play in content
      and consumption data, new ways are emerging to value and         marketing or purchasing
      monetise content – Including measures of engagement such         decisions in your business?
      as ’attention minutes’.
                                                                       What metrics are you using
      While the content majors may appear to have been put at a        today to measure content
      disadvantage to the distribution players by the flood of         performance, and are those
      consumption ‘big data’, in fact their wealth of content          metrics changing?
      intuition and insights represents a huge differentiating asset
      – and one they can blend with analytics-driven insights to
      create a powerful hybrid.
      This can unlock the user experience for the most engaged
      ‘fans.’
Addressable advertising: On the road to ‘nirvana’
– But with more disruption yet to come
15-second download
Linear TV is now joining the move towards ‘addressable’ As an advertising inventory
advertising, targeting consumers though a blend of media owner, are you offering
usage data, demographic information and addressable advertising as
purchasing history. part of your portfolio? If not,
But questions remains for the three main stakeholders of why not?
advertisers, networks/publishers and consumers – With As an advertising agency, are
profound impacts, some of them unexpected, set to emerge you discussing the implications
along the advertising value chain as addressability of of addressable advertising with
ads advances. your clients as part of their
Two of the biggest hurdles to reaching the ‘nirvana’ of advertising mix?
addressable cross-platform ads are around improving the
precision of targeting, and gaining a deeper understanding
of individuals’ behavioural response to a given advert in a
given context.Audience measurement: Unlocking a treasure
trove of insight
15-second download
Online advertising has been winning market share from How do you currently measure
traditional broadcast advertising on the strength of its engagement, as opposed to
greater accountability and wealth of detailed data on user reach and frequency?
behaviour and engagement.
Would you be prepared to
But now TV is fighting back, with innovations in audience collaborate with others in the
measurement based around analysing return path data industry to drive greater
(where available), social listening, and new aggregated standardisation in audience
insights into agency spend. The new data also enhances Pay measurement?
TV service providers ability to’ cross-sell and upsell services
to subscribers.
Going forward, future innovations in audience measurement
will depend increasingly on industry collaboration, to
provide advertisers with credible, comparable data for
buying decisions.OTT: Disruption for the industry, choice for
the consumer
15-second download
An expanding flow of OTT content services are being rolled How should incumbent
out in markets worldwide, both from new ‘pure-play’ OTT broadcasters and content
entrants and traditional broadcasters adding an OTT service providers respond to – And
to their portfolio. Players that achieve relevancy can join the reach – The growing ranks
consumer’s ‘inner circle of trust’. To stay there, they’ll need of ‘cord-cutters’ and
to apply innovation and agility ‘cord-nevers’?
As entrants and incumbents jostle for position, the How can E&M groups best
disruptive frenzy of activity is creating a complex, engage with customers
fragmented patchwork of often-overlapping content through digital channels to
services, using a diverse array of business, operating and drive their own innovation and
pricing models. adoption by customers?Reaching the next five billion consumers
15-second download
Mobile Internet connections worldwide are growing apace. What opportunities has your
They already outnumber fixed connections by three to one, company identified springing
and are projected to rise by over 5 billion to 7.6 billion in the from the next five billion
next four years. consumers joining the global
This is a bigger global disruption than the Industrial mobile Internet ecosystem?
Revolution, and presents entertainment and media Which emerging markets do
companies with a massive new audience for content in you feel you could target most
emerging markets – albeit at much lower ARPUs than effectively and profitably with
they’re accustomed to in the developed world. consumer offerings?Contextual awareness and data responsibility
15-second download
The mobile device is now the digital extension of the What opportunities has the
individual, sitting at the heart of their personal proximity growing ubiquity of mobile
network and constantly monitoring their activities devices opened up for your
and surroundings. business – and how do you
The wealth of data from the handset opens the way to anticipate these expanding in
contextual awareness of the consumer’s behavioural patterns the future?
and environment, enabling companies to anticipate their Before targeting consumers,
needs and address them with context-relevant choices, do you consider whether you
content and messaging. should do this – or just
But consumers in some contexts find this targeting intrusive whether you can?
– And there’s a risk this unease may grow as addressability
increases. So providers need to behave responsibly with
data, and put the consumers in control of what data they
share, and what value they get in return.Four forces reshaping the digital
advertising landscape
15-second download
‘Digital’ and ‘traditional’ advertising are not mutually As a marketer, are you
exclusive or in competition with each other – But all part of ‘running to where the ball is
the evolving mix of advertising options and revenue streams going to be’ with respect to
being targeted across the industry. media planning by having a
As the division between online and mobile ads blurs, and clear mobile and video
consumers’ attitudes to mobile advertising evolve, four strategy?
forces are reshaping the ads landscape: mobile, video, and Are you investing in creating
native and programmatic advertising. experiences that support your
users’ video and other needs?Entertainment and media deals: Beating a path to
the door of the connected consumer
15-second download
Entertainment and media megadeals have been a major Are you seeing different deal
feature of the M&A landscape in the US and Europe in rationales at play within – and
recent years, with several blockbuster transactions, mostly between – Different segments
by cable and satellite operators. of E&M? and with other non
What really links these deals is not their size, but their focus E&M segments?
on building scale in infrastructure and customers. These To what extent is your
goals play to two strategic aims: one defensive, in fending off market or markets
the advance of the over-the-top players; the other offensive, experiencing a blurring
in positioning to gain the upper hand in the ‘connected of traditional boundaries
home’/connected consumer? between media,
With the shift to maximising user experience, will the next communications
wave of deals be different – connecting innovative customer and technology?
focussed technology with existing customer brands?The shifting industry value chain
15-second download
With the debate still ongoing about net neutrality – often How do you believe differing
seen as a battle between telcos and content, especially online net neutrality rulings will
video, providers – the status of such regulation in markets affect the provision of internet
across the world varies widely. infrastructure in the long run?
Operators globally are undertaking a diverse array of As the next billion people in
initiatives in different markets to boost the value and returns emerging markets become
on their networks, through additional services and connected, what are the
innovations enabled by their networks. implications for the
distribution and consumption
of media content?The tax agenda: Reputation risk – Or an
opportunity for differentiation?
15-second download
Progress towards rewriting the international tax rulebook Do you feel the changes being
has continued during the past year, as governments have made to the international tax
begun to follow up their rhetoric about ‘tax morality’ with regime represent the right
hard legislation. responses to the
The changes in the tax environment are especially requirements and realities
relevant to entertainment and media companies, given of ‘digital’ business?
their heavy dependence on their reputation and brand Has your business carried out
among consumers. a total tax contribution study
across its markets?This publication has been prepared for general guidance on matters of interest only, and does not constitute professional advice. You should not act upon the information contained in this publication without obtaining specific professional advice. No representation or warranty (express or implied) is given as to the accuracy or completeness of the information contained in this publication, and, to the extent permitted by law, PwC does not accept or assume any liability, responsibility or duty of care for any consequences of you or anyone else acting, or refraining to act, in reliance on the information contained in this publication or for any decision based on it. © 2017 PwC. All rights reserved. “PwC” refers to the PwC network and/or one or more of its member firms, each of which is a separate legal entity. Please see www.pwc.com/structure for further details. 160613-095853-AG-OS
You can also read