China | Five facts about outward direct investment and their implication for future trend - BBVA Research
←
→
Page content transcription
If your browser does not render page correctly, please read the page content below
China Economic Watch

China | Five facts about outward direct investment
and their implication for future trend
Betty Huang / Alvaro Ortiz / Tomasa Rodrigo / Le Xia
March, 2019

This report takes stock of China’s outward direct investment (ODI) in 2018. Our findings include: (i) China’s
ODI continues its downtrend; (ii) the share of Belt Road Initiative (BRI) countries is increasing; (iii) the
energy sector outperforms other sectors; (iv) POEs and SOEs have different troubles; and (v) other
countries’ sentiments toward China’s investment remain mixed. We project China’s ODI is likely to bottom
out in 2019 amid the headwinds while the long-term prospect of China overseas investment remains
positive.

Fact 1: China’s ODI continued trending down in 2018
After peaking in 2016, China’ Outward Direct Investment (ODI) continued its downtrend during 2017-2018. In
particular, China’s ODI slumped by 18% to USD 129.8 billion in 2018, the biggest drop since 2003 according to the
Ministry of Commerce. As a result, China’s ODI (excluding financial sector) was outpaced by inbound foreign direct
investment in 2018, tipping the country back to a net debtor again.

A confluence of factors lurk behind the slump:

First, a series of implemented restrictive measures, which were enacted since 2016 to combat capital flight,
significantly slowed China’s non-financial ODI. In particular, the “Guidance of Outbound Investment Regulation”
unveiled in August 2017 blacklist a number of industries for ODI such as real estate, sports club, entertainment etc,
which used to be the favourites of Chinese investors. (Please see our report ODI from the Middle Kingdom: What's
next after the big turnaround?)

Second, the wind in some potential host countries of China’s ODI also turned as many advanced countries start to
perceive China’s ODI in their high-tech sectors as a potential threat to their leading position at the technological
frontier. Led by the US, western countries have tightened their screening on Chinese investors, which led to 21
cases of Chinese acquisitions worth of USD 25 billion being cancelled or blocked by foreign regulators in 2018,
indicating a 28% increase from last year.

Last, the domestic economic downturn also hindered Chinese firms from making more investment overseas. In
2018, a combination of US-initiated tariff war and lingering effects of domestic deleveraging took a heavy toll on
Chinese firms’ profitability (Figure 2). Sluggish domestic growth unavoidably affected Chinese firms’ appetite for
international assets.

China Economic Watch – March 2019                                                                                      1
Figure 1 China became a net debtor again in 2018 Figure 2 Chinese firms’ sluggish profit dragged ODI
USD bn % Y oY
200 80
180
60
160
140 40
120 20
100
0
80
60 -20
40 -40
20
-60
0
Apr -16
Oct-16
Apr -17
Oct-17
Apr -18
Oct-18
Aug -16
Aug -17
Aug -18
Dec-16
Dec-17
Dec-18
Jun-16
Jun-17
Jun-18
Feb-16
Feb-17
Feb-18
200 6
200 7
200 8
200 9
201 0
201 1
201 2
201 3
201 4
201 5
201 6
201 7
201 8
Inward FDI in non -fin ancial sector SOE P rofi t POE P rofi t
Outward FDI in n on-financial sector All insustri al P rofit
Source: MOFCOM and BBVA Research Source: CEIC and BBVA Research
Fact 2: ODI to BRI countries accounted for a larger share
China’s official ODI data is notoriously inaccurate for reporting its destinations. In total, approximately 60% of
China’s total ODI flows to Hong Kong and some tax havens in the Caribbean, through which funds are expected to
be channelled to their final destinations at a later stage. Therefore, we use a more detailed database by CGTI
which includes all verified investment and construction transactions worth USD 100 million or more to detect where
ODI goes. The CGTI data features more than 1,300 investment deals worth more than USD 1 trillion in total. Such
a deal-based database enables us to better track China's ODI flows and stocks to different destinations (Figure 3).
In terms of geographic distribution, China’s ODI flows to Europe, Asia, and North America, which remains the first
largest recipient continents of China’s investment, all saw significant declines in 2018. In particular, the declines in
China’s ODI to Europe and North America amount to -56.3% and -60.0% respectively. In Asia, the ODI decline is
led by Japan and Singapore. The same trend is observed in Oceania. Overall, it reflects advanced countries’
increasing concerns over China’s investment.
Meanwhile, China’s ODI flows to emerging markets are still booming thanks to China’s Belt and Road Initiatives
(BRI) which aims to increase China’s investment in a large number of developing countries which have traditional
trade links with China. In 65 BRI countries earmarked by China’s authorities, China’s investment even increased by
8.0% in 2018. The share of investment in these BRI countries now accounts for 21.6% from 16.8% in 2016. The
BRI effect is particularly pronounced in Africa, where the number of host countries of China’s ODI increased to 11
in 2018 from only 4 in 2017.
Apart from these BRI countries, the performance of Latin America also held well as the total China ODI to the
region almost remained flat in 2018. In this respect, Chile ranked first with an aggregate USD 6.4 billion thanks to a
big acquisition of metal mine, followed by Peru (USD 3.6 billion), Brazil (USD 1.3 billion), and Ecuador (USD 0.9
billion).
China Economic Watch – March 2019 2Figure 3 Distribution of Chinese ODI flows and stocks based on CGIT data (2018)
40.4%
Europe
USD 42.5 Bn
14.0%
North America 19.4%
USD 14.9 Bn Asia
USD 20.5 Bn
11.8% 3.9%
LAC 10.7% Oceania
USD 12.5 Bn Africa USD 4.2 Bn
USD 11.4 Bn
ODI Flows percentage
ODI Flows value
New Silk Road
Source: China Global Investment Tracker and BBVA Research; Note: The bubbles are indicative and do not exactly represent the size of ODI flows and stocks
Fact 3: Energy sector continues to outpace other sectors
By industry, China’s ODI in the energy sector still dominated in 2018, in line with the trend during 2005-2018.
Energy sector received USD 21.1 billion in investment in 2018, with Gas and Hydro seeing more activity than coal
and oil. Investment in the transport sector also picked up significantly thanks to China’s Geely’s high-profile
acquisition of Daimler. The metals sector received USD 18.85 billion investment last year, led by copper and steel.
Health and technology sectors expanded their shares of the total received ODI. However, the once-hot fields of
entertainment, real estate and tourism (hotels) registered just USD 5 billion in investment compared with USD 12.9
billion in 2017, after Beijing imposed restrictions to stem capital flight.
Most of the transactions are dominated by large firms. For most of them, the value of top 3 transactions e.g.
Agriculture, Chemicals, real estate, technology etc. accounted for over half of that of total transactions, while
sectors in energy, transport, and metals showed a more diverse investment. (Table 1)
China Economic Watch – March 2019 3Figure 4 China’s ODI flow by industry
100 %
90%
80%
70%
60%
50%
40%
30%
20%
10%
0%
200 5 200 6 200 7 200 8 200 9 201 0 201 1 201 2 201 3 201 4 201 5 201 6 201 7 201 8
Agr icul ture Chemicals Ene rgy Entertainmen t Finance Health Log istics
Metals Other Real estate Technolog y Tourism Transport Utili ties
Source: China Global Investment Tracker and BBVA Research
Table 1 China large enterprises dominated in the ODI flow
Enterprises Share
Sectors No. Enterprises involved in the top 3 transactions (%)
Agriculture 8 Chinese Academy of Sciences,China Resources,Alibaba 66.9
Chemicals 7 State Development and Investment,Power Construction Corp, China National Chemical Engineering 63.4
Energy 43 CNPC,China Energy Engineering, Power Construction Corp, Sinopec 38.2
Entertainment 9 Anta Sports,Orient Securities,Tencent 87.6
Finance 9 Oceanwide,Ping An,China Reinsurance 82.2
Health 13 CDH, China Grand,Creat,By-Health 53.1
Logistics 2 China Communications Construction,Shanghai Lingang 100.0
Metals 22 Chengdu Tianqi,Zijin Mining,Zhongrong Xinda 41.9
Real estate 20 State Construction Engineering,Sino Great Wall,Sinomach 60.3
Technology 13 Tsinghua Unigroup,AVIC,Wingtech 64.0
Tourism 2 Huazhu Hotels,China Communications Construction 100.0
Transport 34 Geely Auto,China Communications Construction,China Railway Engineering 40.6
Utilities 9 Southern Power Grid,Hunan Construction Engineering,Power Construction Engineering 49.3
Source: China Global Investment Tracker and BBVA Research
Fact 4: POEs and SOEs have different troubles
The ODI of Chinese private enterprises (POEs) was suppressed by the authorities’ clampdown on a capital flight
during 2016-2017. Now Chinese POEs continued to struggle with more restricted domestic regulations which led to
more troubled transactions of ODI. (Figure 5) Moreover, the tightening financing condition in China makes it
increasingly difficult for those POEs to find financing sources to meet their demand for ODI. Notwithstanding the
above obstacles, the absolute volume of POE overseas investment at least held up in 2018. (Figure 6)
Meanwhile, China’s state-owned enterprises (SOEs) are facing a different set of problems in making ODI.
Compared to their private peers, SOEs can easily find overseas construction projects tied to the government’s
favoured BRI strategy as well as concessionary financing. However, the suspicion of foreign governments made it
increasingly difficult for them to pass the host countries’ screening mechanism of foreign investment.
China Economic Watch – March 2019 4Figure 5 China Private firms account for a major share
Figure 6 POE ownership rebounded in the ODI outflows
among the troubled transaction list
Billion %
12 50 47.4
44.3
10 45
8 40
6 35 32.9
30 27.9
4 31.5
26.6
25
2
20
0
15
Ocean wid e
China Orie nt
Seq uoia Reso urces
China Commu nicatio ns
11.6
Beij ing Auto
CEFC
CNP C
She nzh en Energ y
San power
Wuhan Ka idi Electric
GSR
HNA
9.5
10 12.8
Constru ction
5
0
201 0
201 1
201 2
201 3
201 4
201 5
201 6
201 7
201 8
POE o wne rsh ip
Source: China Global Investment Tracker and BBVA Research Source: China Global Investment Tracker and BBVA Research
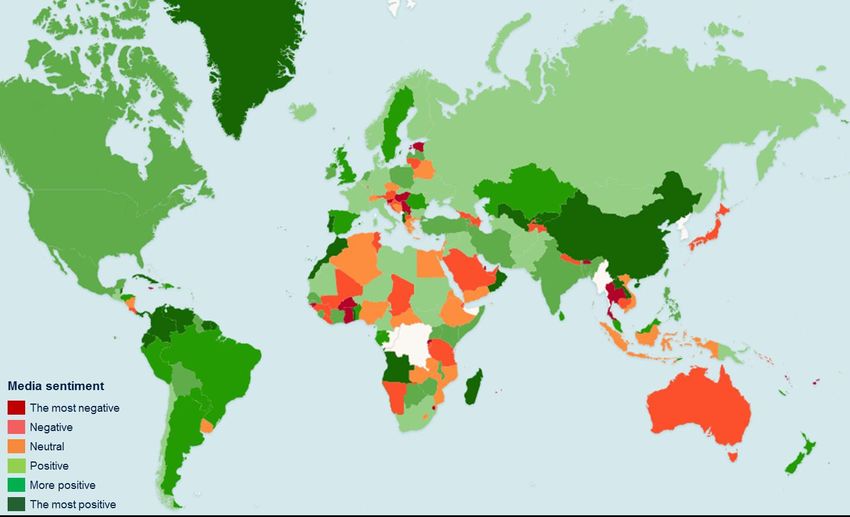
Figure 7 Media Sentiment on Chinese investment on infrastructure (In terms of change from 2016 to 2018)
Source: BBVA Research and www.gdelt.org
China Economic Watch – March 2019 5Fact 5: Other countries’ sentiment toward China’s investment is mixed Encouragingly, many foreign countries’ views toward China’s investment have somewhat improved over the past two years despite the rise in the populism around the globe. Using Big Data and information from the media (GDELT), we measure the media coverage and sentiment on news related to the BRI initiative. Reassuringly, we find that the evolution of media sentiment of Chinese investment on infrastructure has improved generally in 2018 compared to 2016 (Figure 7). Among these regions, Latam America has the most positive sentiment toward China’s investment, while South Asia has the least-positive sentiment of the investment e.g. Bhutan, Maldives, Thailand and Indonesia, reflecting these regions’ long-term territory dispute and economic competition with China. That being said, China needs to carefully tackle these sensitive issues with its neighbours if it wants to successfully push forward the BRI around the globe. China’s ODI is likely to bottom out in 2019 At the beginning of the report, we identified three important factors which had an adverse impact on China’s ODI, including tightened domestic regulations, increasing concerns of foreign governments and sluggish economic growth. These three factors are unlikely to improve in the near term. Capital flight continues to be a concern of China’s authorities while foreign governments’ suspicion toward China’s investment in their high-tech sector is more likely to strengthen rather than fade (Please see our recent report of China-gauging-the-impact-of-us-tech- war-on-china-an-input-output-table-analysis/). Moreover, the deceleration of China’s growth is more likely to continue in the next couple of years. Despite the abovementioned headwinds, we still hold a conservatively optimistic view of China’s ODI over the medium term and anticipate the country’s ODI to bottom out in 2019. Compared to its share of global GDP (18.3%), China’s share of global FDI still has room to grow (4.7%). Moreover, China’s ODI will benefit substantially from the BRI strategy. In this respect, a number of newly established China-initiated institutions, including Silk Road Fund, Asian Infrastructure Investment Bank (AIIB), BRICS New Development Bank (NDB), China LAC Industrial Cooperation Investment Fund and the China-Latin America Infrastructure Fund, will play an increasingly important role. As such, infrastructure and commodity sectors in emerging markets will attract more Chinese capitals. China Economic Watch – March 2019 6
IMPORTANT DISCLOSURES
The BBVA Group companies that have participated in preparing or contributed information, opinions, estimates, forecasts or recommendations
to this report are identified by the location(s) of the author(s) listed on the first page as follows: 1) Madrid, London or Europe = Banco Bilbao
Vizcaya Argentaria, S.A., including its E.U. branches (hereinafter called ‘BBVA’); 2) Mexico City = BBVA Bancomer, S.A. Institución de Banca
Múltiple, Grupo Financiero BBVA Bancomer (hereinafter called ‘BBVA Bancomer’); 3) New York = BBVA Securities, Inc. (hereinafter called
"BBVA Securities"); 4.) New York Branch = BBVA, New York branch; 5.) Lima = BBVA Continental; 6.) Bogota = BBVA Colombia S.A.; 7.)
Santiago = BBVA Chile S.A.; 8.) Hong Kong = BBVA, Hong Kong branch, 9.) Istanbul = Garanti Securities.
For recipients in the European Union, this document is distributed by BBVA, a bank supervised by the Bank of Spain and by Spain’s Stock
Exchange Commission (CNMV), and registered with the Bank of Spain with number 0182.
For recipients in Hong Kong, this document is distributed by BBVA, which Hong Kong branch is supervised by the Hong Kong Monetary
Authority.
For recipients in Mexico, this document is distributed by BBVA Bancomer, a bank supervised by the Comisión Nacional Bancaria y de Valores
de México.
For recipients in Peru, this document is distributed by BBVA Continental, a bank supervised by the Superintendencia de Banca, Seguros y
Administradoras Privadas de Fondos de Pensiones.
For recipients in Singapore, this document is distributed by BBVA, which Singapore branch is supervised by the Monetary Authority of
Singapore.
For recipients in USA, research on products other than swaps, or equity securities and equity derivatives prepared by BBVA, is being
distributed by BBVA Securities, a subsidiary of BBVA registered with and supervised by the U.S. Securities and Exchange Commission and a
member of the Financial Industry Regulatory Authority (“FINRA”) and the Securities Investor Protection Corporation. U.S. persons wishing to
execute any transactions should do so only by contacting a representative of BBVA Securities in the U.S. Unless local regulations provide
otherwise, non-U.S. persons should contact and execute transactions through a BBVA branch or affiliate in their home jurisdiction.
Research on swaps is being distributed by BBVA, a swaps dealer registered with and supervised by the Commodity Futures Trading
Commission (“CFTC”). U.S. persons wishing to execute any transactions should do so only by contacting a representative of BBVA. Unless
local regulations provide otherwise, non-U.S. persons should contact and execute transactions through a BBVA branch or affiliate in their home
jurisdiction.
Research prepared by BBVA on equity securities and equity derivatives is being distributed by BBVA to “major U.S. institutional investors”
based on an exemption from registration provided by Rule 15a-6 of the U.S. Securities Exchange Act of 1934, as amended (the “Exchange
Act”). BBVA is not a registered broker-dealer in the United States and is not subject to U.S. rules on preparing research or independence of
research analysts.
BBVA and BBVA Group companies or affiliates (art. 42 of the Royal Decree of 22 August 1885 Code of Commerce), are subject to the BBVA Group
Policy on Conduct for Security Market Operations which establishes common standards for activity in these entities’ markets, but also specifically for
analysis and analysts. This BBVA policy is available for reference at the following web site: www.bbva.com.
Analysts residing outside the U.S. who have contributed to this report may not be registered with or qualified as research analysts by FINRA or
the New York Stock Exchange and may not be considered “associated persons” of BBVA Securities (as such term is construed by the rules of
FINRA). As such, they may not be subject to FINRA Rule 2241 or 2242 restrictions on communications with subject companies, public
appearances and trading of securities held in research analysts’ accounts.
BBVA is subject to a Internal Standards of Conduct on the Security Markets, which details the standards of the above-mentioned
overall policy for the EU. Among other regulations, it includes rules to prevent and avoid conflicts of interests with the ratings given,
including information barriers. This Internal Standards of Conduct on the Security Markets is available for reference in the ‘Corporate
Governance’ section of the following web site: www.bbva.com
BBVA Bancomer is subject to a Code of Conduct and to Internal Standards of Conduct for Security Market Operations, which details
the standards of the above-mentioned overall policy for Mexico. Among other regulations, it includes rules to prevent and avoid
conflicts of interests with the ratings given, including information barriers. This Code and the Internal Standards are available for
reference in the ‘Grupo BBVA Bancomer’ subsection of the ‘Conócenos’ menu of the following web site: www.bancomer.com
BBVA Continental is subject to a Code of Conduct and to a Code of Ethics for Security Market Operations, which details the
standards of the above-mentioned overall policy for Peru. Among other regulations, it includes rules to prevent and avoid conflicts of
interests with the ratings given, including information barriers. Both Codes are available for reference in the ‘Nuestro Banco’ menu of
the following web site: https://www.bbvacontinental.pe/meta/conoce-bbva/
BBVA Securities is subject to a Capital Markets Code of Conduct, which details the standards of the above-mentioned overall policy
for USA. Among other regulations, it includes rules to prevent and avoid conflicts of interests with the ratings given, including
information barriers.
Exclusively for Recipients Resident in Mexico

BBVA Bancomer acts as a market maker/specialist in: MexDer Future Contracts (US dollar [DEUA], 28-day TIIEs [TE28], TIIE Swaps, 91-day CETES [CE91]),
Bonos M, Bonos M3, Bonos M10, BMV Price and Quotations Index (IPC), Options Contracts (IPC, shares in América Móvil, Cemex, CPO, Femsa UBD, Gcarso A1,
Telmex L) and Udibonos.
BBVA Bancomer, and, as applicable, its affiliates within BBVA Bancomer Financial Group, may hold from time to time investments in the securities or derivative
financial instruments with underlying securities covered in this report, which represent 10% or more of its securities or investment portfolio, or 10% or more of the
issue or underlying of the securities covered.

China Economic Watch – March 2019                                                                                                                                       7
DISCLAIMER
This document and the information, opinions, estimates, forecasts and recommendations expressed herein have been prepared to provide
BBVA Group’s customers with general information and are current as of the date hereof and subject to changes without prior notice. Neither
BBVA nor any of its affiliates is responsible for giving notice of such changes or for updating the contents hereof.
This document and its contents do not constitute an offer, invitation or solicitation to purchase or subscribe to any securities or other
instruments, to undertake or divest investments, or to participate in any trading strategy. Neither shall this document nor its contents form the
basis of any contract, commitment or decision of any kind.
Investors who have access to this document should be aware that the securities, instruments or investments to which it refers may not be
appropriate for them due to their specific investment goals, financial positions or risk profiles, as these have not been taken into account to
prepare this report. Therefore, investors should make their own investment decisions considering the said circumstances and obtaining such
specialized advice as may be necessary. Other than the disclosures relating to BBVA Group, the contents of this document are based upon
information available to the public that has been obtained from sources considered to be reliable. However, such information has not been
independently verified by BBVA or any of its affiliates and therefore no warranty, either express or implicit, is given regarding its accuracy,
integrity or correctness. To the extent permitted by law, BBVA and its affiliates accept no liability of any type for any direct or indirect losses or
damages arising from the use of this document or its contents. Investors should note that the past performance of securities or instruments or
the historical results of investments do not guarantee future performance.
The market prices of securities or instruments or the results of investments could fluctuate against the interests of investors. Investors should be
aware that they could even face a loss of their investment. Transactions in futures, derivatives, options on securities or high-yield securities can
involve high risks and are not appropriate for every investor. Indeed, in the case of some investments, the potential losses may exceed the
amount of initial investment and, in such circumstances; investors may be required to pay more money to support those losses. Thus, before
undertaking any transaction with these instruments, investors should be aware of their operation, as well as the rights, liabilities and risks
implied by the same and the underlying securities. Investors should also be aware that secondary markets for the said instruments may not
exist. Before entering into transactions in futures, derivatives, or options, investors should review all documents on disclosures for risks of
investing in options and/or futures at the following websites:
Options - http://www.finra.org/Industry/Regulation/Notices/2013/P197741Futures - http://www.finra.org/Investors/InvestmentChoices/P005912
BBVA or any of its affiliates’ salespeople, traders, and other professionals may provide oral or written market commentary or trading strategies to
its clients that reflect opinions that are contrary to the opinions expressed herein. Furthermore, BBVA or any of its affiliates' proprietary trading and
investing businesses may make investment decisions that are inconsistent with the recommendations expressed herein. No part of this document
may be (i) copied, photocopied or duplicated by any other form or means (ii) redistributed or (iii) quoted, without the prior written consent of BBVA.
No part of this report may be copied, conveyed, distributed or furnished to any person or entity in any country (or persons or entities in the same)
in which its distribution is prohibited by law. More specifically, this document is in no way intended for, or to be distributed or used by an entity or
person resident or located in a jurisdiction in which the said distribution, publication, use of or access to the document contravenes the law which
requires BBVA or any of its affiliates to obtain a licence or be registered. Failure to comply with these restrictions may breach the laws of the
relevant jurisdiction.
The remuneration system concerning the analysts responsible for the preparation of this report is based on multiple criteria, including the
revenues obtained by BBVA and, indirectly, the results of BBVA Group in the fiscal year, which, in turn, include the results generated by the
investment banking business; nevertheless, they do not receive any remuneration based on revenues from any specific transaction in
investment banking.
In the United Kingdom, this document is directed only at persons who (i) have professional experience in matters relating to investments falling
within article 19(5) of the financial services and markets act 2000 (financial promotion) order 2005 (as amended, the "financial promotion
order"), (ii) are persons falling within article 49(2) (a) to (d) (“high net worth companies, unincorporated associations, etc.”) of the financial
promotion order, or (iii) are persons to whom an invitation or inducement to engage in investment activity (within the meaning of section 21 of
the Financial Services and Markets Act 2000) may otherwise lawfully be communicated (all such persons together being referred to as "relevant
persons"). This document is directed only at relevant persons and must not be acted on or relied on by persons who are not relevant persons.
Any investment or investment activity to which this document relates is available only to relevant persons and will be engaged in only with
relevant persons.
BBVA Hong Kong Branch (CE number AFR194) is regulated by the Hong Kong Monetary Authority and the Securities and Futures Commission
of Hong Kong. In Hong Kong this report is for distribution only to professional investors within the meaning of Schedule 1 to the Securities and
Futures Ordinance (Cap 571) of Hong Kong. This document is distributed in Singapore by BBVA’s office in this country for general information
purposes and it is generally accessible. In this respect, this document does not take into account the specific investment goals, the financial situation
or the need of any particular person and it is exempted from Regulation 34 of the Financial Advisors Regulation (“FAR”) (as required in Section 27 of
the Financial Advisors Act (Chapter 110) of Singapore (“FAA”)).
Garanti Securities headquarters is in Istanbul, Turkey and is regulated by Capital Markets Board (Sermaye Piyasası Kurulu - SPK,
www.spk.gov.tr). BBVA, BBVA Bancomer, BBVA Chile S.A., BBVA Colombia S.A., BBVA Continental, BBVA Securities and Garanti Securities
are not authorised deposit institutions in accordance with the definition of the Australian Banking Act of 1959 nor are they regulated by the
Australian Prudential Regulatory Authority (APRA).
General Disclaimer for Readers Accessing the Report through the Internet
Internet Access
In the event that this document has been accessed via the internet or via any other electronic means which allows its contents to be viewed, the
following information should be read carefully: The information contained in this document should be taken only as a general guide on matters
that may be of interest. The application and impact of laws may vary substantially depending on specific circumstances. BBVA does not
guarantee that this report and/or its contents published on the Internet are appropriate for use in all geographic areas, or that the financial
instruments, securities, products or services referred to in it are available or appropriate for sale or use in all jurisdictions or for all investors or
counterparties. Recipients of this report who access it through the Internet do so on their own initiative and are responsible for compliance with
local regulations applicable to them. Changes in regulations and the risks inherent in electronic communications may cause delays, omissions,
or inaccuracy in the information contained in this site. Accordingly, the information contained in the site is supplied on the understanding that the
authors and editors do not hereby intend to supply any form of consulting, legal, accounting or other advice. All images and texts are the
property of BBVA and may not be downloaded from the Internet, copied, distributed, stored, re-used, re-transmitted, modified or used in any
way, except as specified in this document, without the express written consent of BBVA. BBVA reserves all intellectual property rights to the
fullest extent of the law.

ENQUIRIES TO:
BBVA Research: Calle Azul, 4 Edificio La Vela, Floors 4 & 5 28050 Madrid, Spain
Tel. +34 91 374 60 00 y +34 91 537 70 00 / Fax (+34) 91 374 25
bbvaresearch@bbva.com www.bbvaresearch.com
You can also read