Journal of Asian Earth Sciences
←
→
Page content transcription
If your browser does not render page correctly, please read the page content below
Journal of Asian Earth Sciences xxx (2012) xxx–xxx

                                                       Contents lists available at SciVerse ScienceDirect

                                                   Journal of Asian Earth Sciences
                                              journal homepage: www.elsevier.com/locate/jseaes

Basement topography of the Kathmandu Basin using microtremor observation
Youb Raj Paudyal ⇑, Ryuichi Yatabe, Netra Prakash Bhandary, Ranjan Kumar Dahal
Geo-disaster Research Laboratory, Graduate School of Science and Engineering, Ehime University, Ehime, Matsuyama, Japan

a r t i c l e        i n f o                          a b s t r a c t

Article history:                                      Kathmandu Valley, an intermontane basin of the Himalaya, has experienced many destructive earth-
Received 30 March 2012                                quakes in the past. The observations of the damage pattern during the 1934 Earthquake (Mw = 8.1), in
Received in revised form 22 October 2012              particular, suggest that the spectral ground amplification due to fluvio-lacustrine sediments plays a
Accepted 5 November 2012
                                                      major role in intensifying the ground motion in the basin. It is, therefore, imperative to conduct a detailed
Available online xxxx
                                                      study about the floor variation of sediments in the basin. In this paper, a preliminary attempt was made
                                                      to estimate the thickness of soft sediment in the Kathmandu Basin using microtremor observations. The
Keywords:
                                                      measurements of microtremors were carried out at 172 sites spaced at a grid interval of 1 km. The results
Kathmandu Valley
Lacustrine sediments
                                                      showed that the predominant frequency varies from 0.488 Hz to 8.9 Hz. A non-linear regression relation-
Microtremor                                           ship between resonance frequency and sediment depth was proposed for the Kathmandu Basin. The
Predominant frequency                                 thickness of lacustrine sediments at various points in the basin was estimated using the proposed equa-
Basement topography                                   tion, and then the estimated thickness was used to plot a digital elevation model of the basement topog-
                                                      raphy and cross profiles of the sediment distribution in the basin. The results were validated by
                                                      correlating the estimated sediment thickness with geology and geomorphology of the study area.
                                                                                                                          ! 2012 Elsevier Ltd. All rights reserved.

1. Introduction                                                                         Jacob (1993) have shown that microtremor analysis results revels
                                                                                        the fundamental resonant frequency of sediments. One of the main
    Intensity of ground motion is a function of earthquake magni-                       challenges in determining the site amplification characteristics out
tude and distance from the seismic source, as well as local geolog-                     of microtremor measurement is removing the source effects, which
ical condition and topography of the area (Kramer, 1996).                               is often achieved by dividing the Fourier spectrum obtained on a
Although, geological structure of the area is an important factor, lo-                  soft ground point by that obtained on a nearby reference point
cal site condition is known to have a great influence on the poten-                     on bedrock. For this, however, the microtremor source and path ef-
tial damage resulting from earthquakes (Seed and Idriss, 1969).                         fects must be the same for both measurement points and the ref-
Besides, geotechnical properties of the local soil site and behavior                    erence point or site must also have negligible site effects. To
of the soil during earthquake depends upon the depth of the sedi-                       overcome this limitation, Nakamura (1989) has introduced a tech-
mentary column and its shear wave velocity. From geotechnical                           nique for estimating the site response by measuring solely the
point of view, the shear wave velocity in the top 30 m column of                        microtremor on the surface of the ground. According to him, the
soil is responsible for an unusual amplification of the ground mo-                      source effect can be removed by dividing the horizontal compo-
tion (Finn, 1991). However, in the areas where the thickness of soft                    nent of microtremor spectrum by the vertical component. Now,
sediments is enormously large, like in the Kathmandu Basin, the                         this technique has become widespread as a low-cost and effective
amplification will rather depends on the extent of the soft sedi-                       tool to estimate the fundamental resonant frequency of sediments
ment column and its elastic properties. Moreover, the fundamental                       using Horizontal-to-Vertical (H/V) spectral ratio at a single-station.
phenomenon responsible for the amplification of seismic waves is                        In his paper, Nakamura (1989) explains the use of this technique
due to the impedance contrast between sedimentary deposits and                          and gives a detailed explanation on the subsequent assumptions.
the underlying hard-strata or bedrock. Such site amplification can                          In the last two decades, the H/V method has been widely used
be estimated using microtremor measurement technique, which                             for various purposes, such as site effect evaluation, wave amplifica-
was first introduced by Kanai (1954). Several studies such as, Ohta                     tion estimation, liquefaction vulnerability assessment, sediment
et al. (1978), Lermo et al. (1988), Field et al. (1990), and Field and                  depth estimation, and microzonation studies in different geo-
                                                                                        graphical and geological regions of the world (Field and Jacob,
                                                                                        1993; Bour et al., 1998; Ibs-von Seht and Wohlenberg, 1999;
 ⇑ Corresponding author. Address: Geo-disaster Research Laboratory, Graduate            Delgado et al., 2000; Tuladhar et al., 2004; Hasancebi and Ulusay,
School of Science and Engineering, Ehime University, Bunkyo-3, Matsuyama 790-
                                                                                        2006; Langston et al., 2009; Hardesty et al., 2010; Mucciarelli,
8577, Japan. Tel./fax: +81 89 927 8566.
                                                                                        2011; Paudyal et al., 2012a and Paudyal et al., 2012b). Estimating
   E-mail address: youbrajpaudyal@gmail.com (Y.R. Paudyal).

1367-9120/$ - see front matter ! 2012 Elsevier Ltd. All rights reserved.
http://dx.doi.org/10.1016/j.jseaes.2012.11.011

Please cite this article in press as: Paudyal, Y.R., et al. Basement topography of the Kathmandu Basin using microtremor observation. Journal of Asian Earth
Sciences (2012), http://dx.doi.org/10.1016/j.jseaes.2012.11.011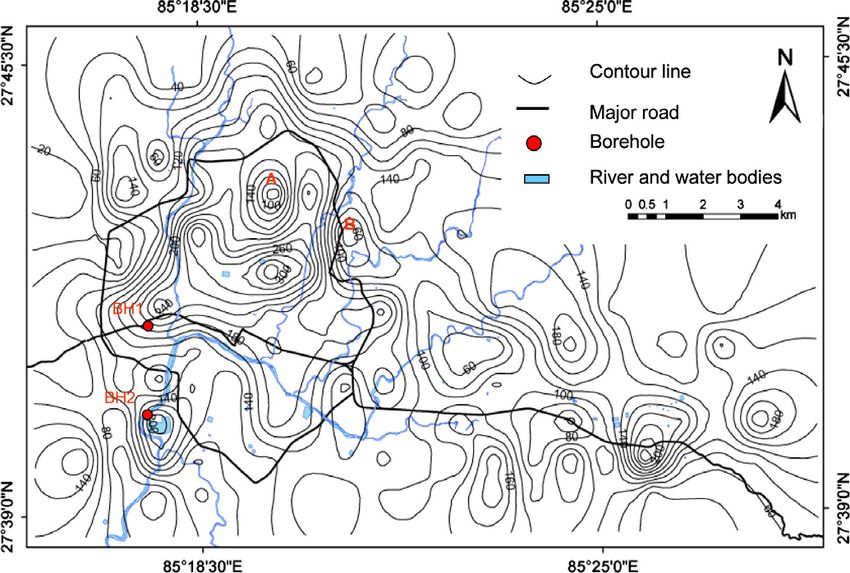
2 Y.R. Paudyal et al. / Journal of Asian Earth Sciences xxx (2012) xxx–xxx
an empirical relationship between fundamental resonant frequen- central part of the valley consist of weakly metamorphosed Phu-
cies and sedimentary cover thickness has become practice since lchauki Group. The basin is filled with upper Pliocene to Quater-
the work of Ibs-von Seht and Wohlenberg (1999) for Cologne area nary clay, silt, sand and gravel (Moribayashi and Maruo, 1980;
in Germany. They proposed that resonance frequency in H/V spec- Yoshida and Gautam, 1988; Sakai, 2001) overlaying the Precam-
tra correlate well with the overall soil thickness; ranging from tens brian Bhimphedi Group and the lower Paleozoic Phulchauki Group
of meters to more than 1000 m. Their developed relationships pro- (Stöcklin and Bhattarai, 1981). Katel et al. (1996) and Sakai et al.
vide a practical means of sediment thickness estimation using a (2002) mention that more than 300 m thick muddy and sandy sed-
microtremor observation. Later, several studies, such as Delgado iments of lacustrine origin are extensively distributed within the
et al. (2000), Parolai et al. (2002), D’Amico et al. (2004), Hinzen Kathmandu Basin (Fig. 3).
et al. (2004), García-Jerez et al. (2006), Birgören et al. (2009), Kathmandu Valley has typical lacustrine sediments of its kind,
Dinesh et al. (2010), Gosar and Lenart (2010), Özalaybey et al. which has attracted many geo-science researchers from various
(2011), and Sukumaran et al. (2011) have applied microtremor parts of the world. For example, Yoshida and Igarashi (1984),
H/V spectral ratio technique for measuring the thickness of soil Dangol (1985), Fujii and Sakai (2002), and Sakai et al. (2002) have
cover over a hard stratum or bedrock. studied the depositional environment and stratigraphy of the sed-
The present investigation is a first attempt to approximate the iment in the valley. Likewise, Katel et al. (1996), Dahal and Aryal
thickness of the soft sediments of lacustrine origin (Sakai et al., (2002), and JICA (2002) have studied the engineering geological
2002) in the Kathmandu Basin using microtremor observations. and geotechnical properties of the Kathmandu lacustrine sediment,
The basin falls under one of the active seismic regions, and has suf- and Rai et al. (2004) and Paudel (2010) have carried out the litho-
fered great losses in the past earthquakes, such as in 1255, 1408, logical and mineralogical evaluation of Kathmandu soils. More re-
1681, 1803, 1810, 1833, 1866, and 1934 (Rana, 1935; Chitrakar cently, Mugnier et al. (2011) have conducted a study on the seismic
and Pandey, 1986; Bilham et al., 1995; Pandey et al., 1995; Upreti response of the Kathmandu Basin and they mention that the soft
and Yoshida, 2009). The latest greatest earthquake of 1934 sediment deformation of the basin is mainly controlled by the
(Mw = 8.1) with a maximum intensity of X in Modified Mercally fluidization of the silty layers during earthquake shaking. Most of
Intensity (MMI) Scale in the Kathmandu Basin reportedly killed these studies are based on the borehole data obtained by different
about 4296 people and destroyed about 19% and damaged about agencies for various purposes, such as water supply project, and
38% of the buildings in the basin alone (Rana, 1935; Pandey and field observation. As these borehole cores were not recovered,
Molnar, 1988). The observations of the damage pattern in the Kath- the precise lithologic characteristics and stratigraphy were not
mandu Basin during this earthquake, in particular, suggest that the confirmed (Sakai, 2001). Moreover, Sakai (2001) mentions that
spectral ground amplification due to fluvio-lacustrine sediments these previous studies faced several important problems of strati-
play a major role in intensifying the ground motion (Pandey and graphic division and nomenclature of the formations, mainly be-
Molnar, 1988; Hough and Bilham, 2008). However, the valley basin cause of lack of information on the subsurface geology and
still lacks adequate information on spatial variation of the lacustrine insufficient description on definition of each formation. To over-
sediments. Moribayashi and Maruo (1980) estimated the basement come this problem, Sakai et al. (2001) conducted a core drilling
topography of the central portion of the basin using gravitational of the basin-fill sediments for the palaeoclimatic study of the Kath-
method by assuming the density contrast of 0.8 g/cm3; i.e., 2.67 g/ mandu Basin. This was the first large-scale drilling project in the
cm3 for bedrock and 1.87 g/cm3 for lacustrine sediments. In reality, valley with full core recovery, and solely dedicated to academic re-
however, the density of the lacustrine sediments is found less (JICA, search purpose. Based on this study, they have divided the history
2002) than the value assumed by Moribayashi and Maruo (1980). In of Palaeo-Kathmandu Lake into seven stages ranging from stage 1 –
addition, the density contrast may not be constant everywhere for a prior to the appearance of the lake to stage 7 – draining out of the
basin like the Kathmandu Valley, where the thickness and properties lake-water (Sakai et al., 2001). Subsequent details of the different
of sediments vary significantly within the short distances. In this stages of changes of lithology and sedimentary facies of the sedi-
sense, the actual floor variation of the basement rock in a wider area ment can be found in Sakai et al. (2001). Based on the available
of the Kathmandu Basin is still debatable. So, the objective of this data from the previous study and paleoclimatic study of the Kath-
study is to derive an empirical relationship between the resonance mandu Basin, Sakai (2001) has divided the sediments in the valley
frequencies obtained from the H/V technique and the thickness of into three groups: (1) marginal fluvio-deltaic facies in the northern
the lacustrine sediments, and then generate an approximate base- part, (2) open lacustrine facies in the central part, and (3) alluvial
ment topography of the Kathmandu Basin. This information is criti- fan facies in the southern part, as shown in Fig. 1c.
cally important for earthquake ground motion simulation studies,
especially because the densely populated urban area of the valley
is under a great earthquake threat. 3. Methodology
3.1. Field observations
2. Study area and geology
Microtremor measurement survey was carried out at 172 1-km
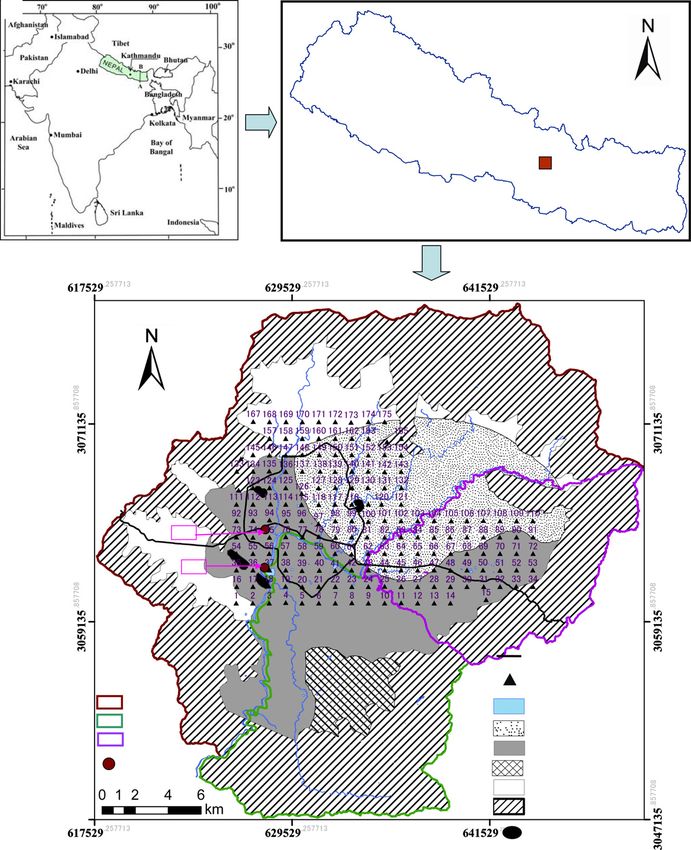
Geologically, the Kathmandu Basin (Fig. 1) lies on the Kath- grid points in the study area (Fig. 1c) with the help of a portable
mandu Nappe (Hagen, 1969; Upreti, 1999), which is located along velocity sensor. This sensor is capable of recording three compo-
the southern slopes of the Himalaya. It is one of the several tec- nents of vibration: two horizontal, i.e., east–west and north–south
tonic intermontane basins developed in the Lesser Himalayan belt and one vertical (Fig. 4). At each survey point, the microtremor
(Sakai et al., 2002) as shown in Fig. 2. The Kathmandu Nappe is data were recorded for 300 s at a sampling frequency of 100 Hz
composed of the Shivapuri Gneiss and marbles of the Bhimphedi (i.e., 30,000 samples at each point). Fourier analysis of each win-
Group (Stöcklin and Bhattarai, 1981). As illustrated in Fig. 2, the dow (after removing unwanted noise) was carried out using Fast
early Paleozoic Tethyan rocks, named as the Phulchauki Group, Fourier Transform (FFT) computer program, and the obtained spec-
overlie the Bhimphedi Group in the Kathmandu region. Total thick- tra were smoothed using Parzen window of bandwidth 0.5 Hz. The
ness of both these groups attains 13 km (Stöcklin and Bhattarai, average spectral ratio of the horizontal component of vibration to
1981). The northern slope of the Kathmandu Valley is mainly com- vertical (i.e., H/V) in each window was derived from the following
posed of gneiss, schist and granite, but the other slopes and the equation (Delgado et al., 2000):
Please cite this article in press as: Paudyal, Y.R., et al. Basement topography of the Kathmandu Basin using microtremor observation. Journal of Asian Earth
Sciences (2012), http://dx.doi.org/10.1016/j.jseaes.2012.11.011
Y.R. Paudyal et al. / Journal of Asian Earth Sciences xxx (2012) xxx–xxx                                 3

          (a)                                                                          (b)
                                                       CHINA

                                                                                                   Nepal
                              INDIA

                                                                                                                                                 Kathmandu Valley

                       (c)

                                                           BH1

                                                                BH2

                                                                                                                                            Major roads
                                                                                                                                            Microtremor
                                                                                                                                            observation points
                                                     Kathmandu
                                                                                                                                            Main Rivers
                                                     Lalitpur
                                                                                                                                            Fluvio-deltaic facies
                                                     Bhaktapur
                                                                                                                                            Lacustrine facies
                                                     Borehole
                                                     location                                                                               Fan depositions
                                                                                                                                            Talus deposits
                                                                                                                                            Basement Rocks
                                                                                                                                            Isolated basement
                                                                                                                                            rocks

Fig. 1. Location map of the study area; (a) location map of Nepal in Asia; (b) location of the Kathmandu Valley in Nepal; and (c) map of Kathmandu Valley (study area). A
sediment distribution map of the Kathmandu Valley, microtremor measurement points and borehole location (BH1 and BH2) in the study area are shown (modified after Fujii
and Sakai, 2002).

        qffiffiffiffiffiffiffiffiffiffiffiffiffiffiffiffiffiffiffiffiffiffiffiffiffiffiffiffiffiffiffiffiffiffiffiffiffiffiffiffiffi
                                                                                                        those spectral ratios. Based on the fact that the frequency corre-
H=V ¼    ðF 2NS þ F 2EW Þ=ð2F 2UD Þ                                                          ð1Þ
                                                                                                        sponding to the first peak of the H/V spectrum plot represents fun-
   Here, FNS, FEW and FUD are the Fourier amplitude spectra in the                                      damental resonant frequency of the site (Field and Jacob, 1993;
north–south (NS), east–west (EW) and vertical (UD) direction,                                           SESAME, 2004; Bonnefoy-Claudet et al., 2006), the site specific fun-
respectively.                                                                                           damental frequency for each measurement point was obtained.
   After deriving H/V spectral ratios for all windows of a point, the                                   Typical result of microtremor data analysis and calculation of
H/V ratio for the particular point was obtained by averaging all                                        predominant frequency of the sites in some of the location of

Please cite this article in press as: Paudyal, Y.R., et al. Basement topography of the Kathmandu Basin using microtremor observation. Journal of Asian Earth
Sciences (2012), http://dx.doi.org/10.1016/j.jseaes.2012.11.011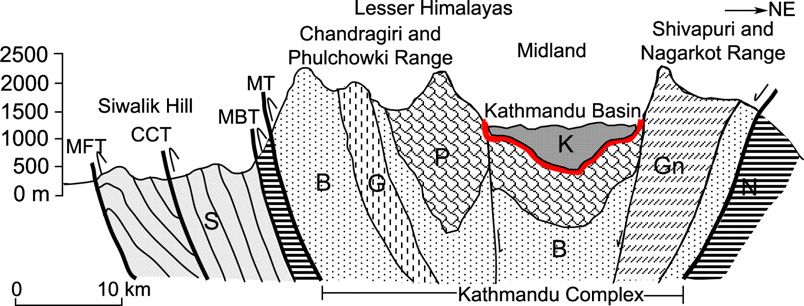
4                                                                 Y.R. Paudyal et al. / Journal of Asian Earth Sciences xxx (2012) xxx–xxx

Fig. 2. A schematic geological cross-section through Central Nepal (after Sakai et al., 2002, and Stöcklin and Bhattarai, 1981). S: Siwalik Group, B: Bhimphedi Group, P:
Phulchauki Group, N: Nawakot Complex, G: Granite, Gn: Gneiss Complex, K: Kathmandu Complex, MFT: Main Frontal Thrust, CCT: Central Churia Thrust, MBT: Main
Boundary Thrust, MT: Mahabharat Thrust.

                                                                                                     Black Clay

                                                      Sand and gravel bed

Fig. 3. A schematic geological cross-section of the Kathmandu Basin, showing north–south sediment distribution through the center of the Kathmandu Valley (after Katel
et al., 1996; Sakai et al., 2002).

                    0.004
                              (a)                                                  Noise
    Vel. (cm/s)

                    0.002
                          0
                   - 0.002
                   - 0.004
                         0.00       20.48   40.96    61.44      81.92     102.40      122.88    143.36     163.84     184.32     204.80      225.28   245.76   266.24   286.72   307.20

                                                                                                  Time (T) Sec

                                                                                Noise
                              (b)
     Vel. (cm/s)

                                                                                                  Time (T) Sec

                              (c)                                                  Noise
     Vel. (cm/s)

                                                                                                  Time (T) Sec

                  Fig. 4. Typical pattern of measured microtremor data; (a) in east–west direction (X-axis); (b) in north–south direction (Y-axis); (c) in up-down direction (Z-axis).

Kathmandu Basin are shown in Fig. 5. In this study, the fundamen-                                        where ‘h’ and ‘fr’ are the depth of the Quaternary sediments and fun-
tal resonant frequency of the soil layer is used to calculate the                                        damental resonant frequency, and ‘a’ and ‘b’ are the standard errors
thickness of the soft sediments in the Kathmandu Basin.                                                  of the correlation coefficients.
                                                                                                             Ibs-von Seht and Wohlenberg (1999) have studied both param-
3.2. Theoretical calculation                                                                             eters (i.e, h and fr) and demonstrated that it is possible to establish
                                                                                                         a direct functional relationship between them without knowing
   Ibs-von Seht and Wohlenberg (1999) showed that the funda-                                             the shear wave velocity (Vs). They estimated the value of ‘a’ and
mental resonant frequency of the soil layer is closely related to                                        ‘b’ and proposed an empirical relationship (Eq. (3)) between the
thickness of the soil layer as given in the following equation:                                          fundamental resonant frequency (fr) and the thickness of soft sed-
                      b                                                                                  iment cover (h) (Quaternary sediments), based on 34 boreholes
h ¼ af r                                                                                       ð2Þ       ranging in depth from 15 m to 1257 m and data from 102 seismic

Please cite this article in press as: Paudyal, Y.R., et al. Basement topography of the Kathmandu Basin using microtremor observation. Journal of Asian Earth
Sciences (2012), http://dx.doi.org/10.1016/j.jseaes.2012.11.011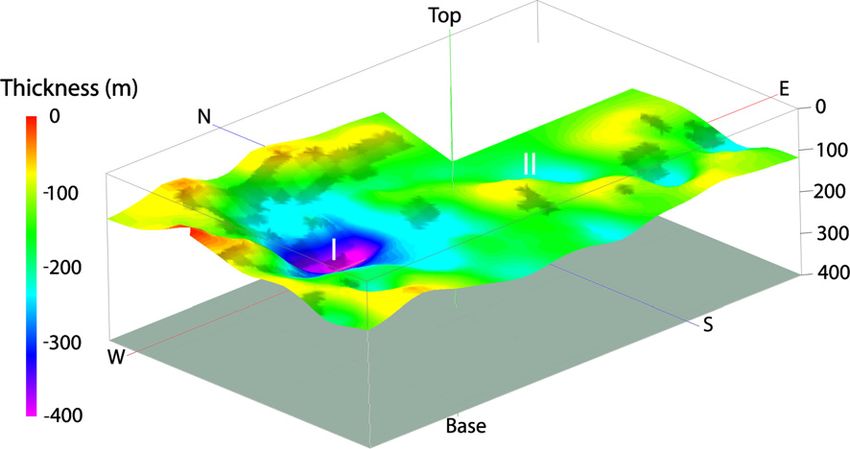
Y.R. Paudyal et al. / Journal of Asian Earth Sciences xxx (2012) xxx–xxx                                       5

                                             10                                                                10
                                                     P 10                                                                      P 40

                                 H/V Ratio

                                                                                                  H/V Ratio
                                              1                                                                 1

                                             0.1                                                              0.1
                                               0.1                       1                   10                  0.1                  1           10
                                                              Frequency (Hz)                                                   Frequency (Hz)

                                             10                                                                10
                                                     P 54                                                           P 84
                                 H/V Ratio

                                                                                                  H/V Ratio
                                              1                                                                 1

                                             0.1                                                              0.1
                                               0.1                   1                  10                       0.1                  1          10
                                                             Frequency (Hz)                                                    Frequency (Hz)
                                                                                                               10
                                             10
                                                  P 100                                                             P 134
                                                                                                  H/V Ratio
                                 H/V Ratio

                                              1                                                                 1

                                             0.1                                                              0.1
                                               0.1                   1                 10                       0.1                       1            10
                                                                                                                                Frequency (Hz)
                                                             Frequency (Hz)
                                                                                                              100
                                             10                                                                        P 163
                                                     P 144
                                                                                                               10
                                                                                                  H/V Ratio
                                 H/V Ratio

                                              1
                                                                                                                1

                                             0.1                                                              0.1
                                               0.1                       1                   10                  0.1                  1           10
                                                              Frequency (Hz)                                                   Frequency (Hz)

Fig. 5. Typical H/V spectral ratio of some microtremor measurement points in the study area. Red line is the mean value and black and blue lines are ± standard deviation.
Black pointed triangle represents the predominant frequency taken from H/V spectral ratio. (For interpretation of the references to colour in this figure legend, the reader is
referred to the web version of this article.)

stations in the western Lower Rhine Embayment in Germany,                                               stations and 405 – point gravity measurements and derived an
which is covered with Tertiary and Quaternary sediments overlay-                                        equation (Eq. (6)) for sediment cover in Izmit Basin in Turkey
ing Palaeozoic bedrock. Similarly, Parolai et al. (2002) developed an                                   which has the sedimentary cover thickness about 1200 m at the
empirical relationship (Eq. (4)) between thickness of sediment                                          deepest part.
with resonant frequency for the Cologne area in Germany based
on 32 boreholes with a depth range from 20 m to 402 m and                                               h ¼ 96fr%1:388                                                     ð3Þ
337 data from seismic stations. Recently, Birgören et al. (2009)
have derived yet another empirical relationship (Eq. (5)) between                                       h ¼ 108fr%1:551                                                    ð4Þ
the thickness of Tertiary–Quaternary sediments overlying Palaeo-
zoic bedrock and their resonance frequencies for the Istanbul re-                                       h ¼ 150:99fr%1:1531                                                ð5Þ
gion based on the H/V ratio from 15 measurements at the
borehole locations and velocity profile of two microtremor array
measurements sites. The results obtained by Birgören et al.                                             h ¼ 141fr%1:27                                                     ð6Þ
(2009) show a very strong relationship (R2 value: 0.995) between                                           So as to map the soft sediment thickness in the Kathmandu
the resonant frequency and the thickness of the sediment which                                          Basin, we adopt terrain specific equations given by the above
varies from 20 m to 449 m. Similarly, Özalaybey et al. (2011) have                                      researchers. A theoretical thickness for the sediments of the
investigated 3-D basin structures and site response frequencies in                                      Kathmandu Basin is calculated using above equations, based on
the Izmit Bay area of Turkey by microtremor measurement in 239                                          the fundamental frequency (fr) obtained for each station using

Please cite this article in press as: Paudyal, Y.R., et al. Basement topography of the Kathmandu Basin using microtremor observation. Journal of Asian Earth
Sciences (2012), http://dx.doi.org/10.1016/j.jseaes.2012.11.011
6 Y.R. Paudyal et al. / Journal of Asian Earth Sciences xxx (2012) xxx–xxx
400 400
350 350
300 300
Thickness (m)
Thickness (m)
250 250
200 200
150 150
100 100
50 50
0 0
0 20 40 60 80 100 120 140 160 180 200 0 20 40 60 80 100 120 140 160 180 200
Microtremor observation points Microtremor observation points
Fig. 6. Comparison between depths calculated using Ibs-von Seht and Wohlenberg Fig. 8. Comparison between depths calculated using Birgören et al. (2009) and
(1999), Parolai et al. (2002), Birgören et al. (2009) and Özalaybey et al. (2011) Özalaybey et al. (2011) relationships (Eqs. (5) and (6)). The circle indicates the
relationships (Eqs. (3)–(6)). The circle indicates the average value whereas the average value whereas the length of the line suggests deviation from the average.
length of the line suggests deviation from the average.
h ¼ 146:01fr%1:2079 ð7Þ
microtremor observations. In this study, it is assumed that the H/V
spectral ratio depends primarily on the source/site characteristics The obtained equation (i.e. Eq. (7)) is further used for obtaining
rather than geographical location. primary information on the relative depth variation (refer Supple-
It has been observed that the variations of estimated depth, mentary Table 2) of the interface between the two physically con-
based on above four equations, were not much comparable with trasting layers of lacustrine sediment and the underlain hard strata
each other, and analysis clearly showed an average standard devi- (or bedrock) in the Kathmandu Basin.
ation of 41.88 m in thickness as shown in Fig. 6. In order to mini- This observation is validated by comparing the results of the
mize the value of standard deviation and thereby to obtain the gravity contour map proposed by Moribayashi and Maruo (1980)
reliable results, the depth estimated based on the non-linear and also with the depth of the bedrock based on the borehole
regression equation proposed by the four researchers were divided drilled for academic purposes (Sakai et al., 2001) in the Kathmandu
into two groups emphasizing the less variations of the estimated Basin.
depth in each group. The standard deviation of each group is ob-
tained as shown in Figs. 7 and 8. These figures show that the stan-
dard deviation (i.e., 48.55 m in thickness) of First Group (i.e. Ibs- 4. Results and discussion
von Seht and Wohlenberg, 1999; Parolai et al., 2002) (Fig. 7) is
higher than (i.e., 7.44 m in thickness) the Second Group (Birgören The results of this study are expressed in terms of thickness of
et al., 2009; Özalaybey et al., 2011) (Fig. 8). The results also showed the lacustrine sediment and its variation in different areas of the
that the values of thickness obtained from Birgören et al. (2009) Kathmandu Basin. The sediment depth in various locations in the
and Özalaybey et al. (2011) are more compatible with each other. basin is calculated using Eq. (7). The contour map of the estimated
In other words, the depths calculated using Birgören et al. (2009) soft sediment thickness and a digital elevation model (DEM) for the
and Özalaybey et al. (2011) show significantly smaller variations study area (Kathmandu Basin) are shown in Figs. 9–11. The calcu-
in the thickness due to the comparable geotechnical characteristics lated values give a deep interface of soft sediment (unconsolidated)
of the geological formation. Table 1 shows the comparative study and basement layer in the center of the Kathmandu Basin and shal-
of the geological characteristics of the geological formation of low in and around the outskirts of the valley. The sudden abrupt
Kathmandu Basin, Izmit Basin and Istanbul area. change in the sediment thickness is found at points A (i.e. thickness
We further averaged the values estimated using Eqs. (5) and (6) of sediment about 48 m) and B (i.e. thickness of sediment about
to obtain the best fit equation which we purposed for the 30 m) (Fig. 9), which are about 2 km and 3 km along north and east
Kathmandu Basin as follows: from the central part of the Kathmandu respectively, which indi-
cates the presence of basement rock in the shallow depth in those
areas.
The calculated depth of the interface between two layers is used
400
to plot the cross-profiles and digital elevation model (DEM) for the
Kathmandu Basin. Fig. 11a and b shows the profiles along west to
350
east and south to north direction respectively. The west to east
300 profiles (Fig. 11a) along P167–P175, P157–P165, P144–P154,
Thickness (m)
250 P133–P143, P54–P72, P35–P53, P16–P34, and P1–P15 show gentle
200 slope of basement topography, whereas the profiles along P122–
P132, P111–P121, P92–P110, and P73–P91 show steeper slope
150
and increase in the soft sediment thickness mainly towards the
100 center location. The variation of the soft sediment thickness in
50 the valley can also be described using Fig. 11b in which the profiles
0 along P3–P168, P4–P169, P5–P170, and P6–P171 give information
0 20 40 60 80 100 120 140 160 180 200 about the distribution of sediment thickness along south–north
Microtremor observation points direction, and they clearly indicate a steeper slope of the basement
floor and increase of sediment thickness towards the center. The
Fig. 7. Comparison between depths calculated using Ibs-von Seht and Wohlenberg
(1999), and Parolai et al. (2002) relationships (Eqs. (3) and (4)). The circle indicates
DEM of the hard stratum further reveal that the thicknesses of
the average value whereas the length of the line suggests deviation from the the sediment in depression (I) (refer Figs. 1c and 10 and Supple-
average. mentary Table 2) at points P94, P95, P96, P114, P115, P116,
Please cite this article in press as: Paudyal, Y.R., et al. Basement topography of the Kathmandu Basin using microtremor observation. Journal of Asian Earth
Sciences (2012), http://dx.doi.org/10.1016/j.jseaes.2012.11.011Y.R. Paudyal et al. / Journal of Asian Earth Sciences xxx (2012) xxx–xxx 7
Table 1
Comparative study of the geotechnical characteristics of the geological formation of Kathmandu Basin, Izmit Basin and Istanbul area.
Descriptions Kathmandu Basin Izmit Basin Istanbul area
Basement rock Palaeozoic Tethyan rock Moribayashi and Paleozoic rock Karkas and Coruk (2010) Palaeozoic rocks Ündül and Tugrul
Maruo (1980) (2006)
Sediment Lacustrine and fluvial in origin Katel et al. Quaternary alluvial and fluvial deposits Halic and Bosphorus sediments
(1996); Sakai et al. (2001) Karkas and Coruk (2010) Ündül and Tugrul (2006)
Maximum estimated depth of 347 (current study) 1200 Özalaybey et al. (2011) 449 Birgören et al. (2009)
soft sediment (m)
Shear wave velocity of sediment 188–310 JICA (2002) 180–360 Zor et al. (2010) 80–375 Bozdag and Kocaoglu (2005)
up to 30 m (m/s)
Predominant frequency (Hz) 0.448–8.89 (current study) 0.23–5 Özalaybey et al. (2011) 0.44–5 Birgören et al. (2009)
Variation of SPT N value up to 2–42 JICA (2002) 2–43 Karkas and Coruk (2010) 5–>50 Dalgic (2004)
30 m
Specific gravity of soil 2.34–2.77 Katel et al. (1996) 2.55–2.78 Sawicki and Swidzinski (2006) 2.42–2.79 Ündül and Tugrul (2006)
Liquid limit (%) 30–108 Katel et al. (1996) 33–66 Olgun et al. (2008) 35–98 Ündül and Tugrul (2006)
Plasticity index (%) 5–43 Katel et al. (1996) 10–37 Olgun et al. (2008) 7–50 Ündül and Tugrul (2006)
Fig. 9. Contour map of the basement topography of the Kathmandu Basin.
Fig. 10. Bedrock-soft sediment palaeo-topography of the Kathmandu Valley Basin (the vertical scale is 15 times exaggerated). I and II are the depressions carved over
Bedrock-soft sediment surface forming the sites of thickest deposit in the study area.
Please cite this article in press as: Paudyal, Y.R., et al. Basement topography of the Kathmandu Basin using microtremor observation. Journal of Asian Earth
Sciences (2012), http://dx.doi.org/10.1016/j.jseaes.2012.11.0118 Y.R. Paudyal et al. / Journal of Asian Earth Sciences xxx (2012) xxx–xxx Fig. 11. Cross profiles showing the contact of soft sediment and bedrock, and variations of soft sediment (the vertical scale is 15 times exaggerated); (a) W–E profiles, and (b) S–N profiles. P117, P125, P126, P127, P128 show relative depth variations of basement rock in the Kathmandu Basin. The calculated depth 260 m, 214 m, 233 m, 253 m, 279 m, 347 m, 278 m, 309 m, may not necessarily indicate the presence of hard rock, rather it 197 m, 166 m, 233 m and depression (II) at points P50, P86, is a representation of the presence of basement layer at that depth, P103, P104, P105, P132 show the depth variations of 194 m, beyond which the sediment do/may not contribute to the amplifi- 214 m, 166 m, 173 m, 173 m, 166 m respectively. cation of the ground motion. From geotechnical point of view, this The digital elevation model suggests that the sediment distribu- contrast corresponds to the bedrock. Secondly, although Figs. 9 and tion in the basin is far from uniform and have an undulating topog- 10 show a number of small depressions in the whole study area, raphy with steep relief in many locations in the basin. Hagen two large depressions are found. First depression at the central part (1969) mentioned that during the pre-lake formation in the Kath- of the Kathmandu City denoted by I in Fig. 10, which is wider and mandu Basin, drainage systems originating in the northern slope of deeper represents the main ancient lake of the Kathmandu Basin the Shivapuri hill and termed as ‘‘Proto Bagmati River’’ were very while other is along the eastern part denoted by II which is rela- active. These river systems were responsible for the deposition of tively shallow and its catchments area elongated from northwest coarse-grained sediments (gravels and coarse sand) below the lake to southeast. Similarly, there are a number of buried ridges which deposits in the entire valley. The influence of Proto Bagmati river separate/connect the depressions. The longest buried ridge, which systems appear more in the northern and central part than in the separates/connects the central large and deep depression with the other part of the valley. According to Yoshida and Igarashi eastern shallow depression extends from northwest to southeast (1984), this deposition took place some 2.5 Ma ago (i.e., during part of the valley (Fig. 10). middle to late Pliocene period). In order to verify the estimated sediment thickness distribution After analyzing the digital elevation model of the basement map of the Kathmandu Basin, the thickness variation profile along topography in the Kathmandu Basin, there arise mainly two possi- south–north direction (Fig. 11b, profiles P5–P170) through the cen- ble explanations. Firstly, the calculated depth of the sediment rep- ter of the Kathmandu Basin was compared with the borehole resents the total depth of lake deposit which is underlain by exploration-based ground profile (Fig. 3) proposed by Sakai et al. Please cite this article in press as: Paudyal, Y.R., et al. Basement topography of the Kathmandu Basin using microtremor observation. Journal of Asian Earth Sciences (2012), http://dx.doi.org/10.1016/j.jseaes.2012.11.011
Y.R. Paudyal et al. / Journal of Asian Earth Sciences xxx (2012) xxx–xxx                                    9

                                                                                        show that the depth of the basement rock (or hard sediment) esti-
                                                                                        mated from the result of microtremor observation is at 196 m be-
                                                                                        low the surface at borehole BH1 and 188 m at borehole BH2. The
                                                                                        difference in depth of the bedrock with the estimated value may
                                                                                        be due to the change in basement topography abruptly in nearby
                                                                                        areas of these boreholes. Due to marginal area of the bowl shaped
                                                                                        Kathmandu Basin, the basement contour values also vary abruptly
                                                                                        within a short distance in and around these borehole locations.
                                                                                        Borehole BH2 lies at the edge of the Kathmandu Basin and a steep
                                                                                        slope of basement topography is observed in west, north and south
                                                                                        directions (Fig. 9). Moreover, the calculated depth of the basement
                                                                                        rock at microtremor observation points near the borehole BH1 is
                                                                                        found 260 m and near the borehole BH2, it is 233 m (refer
                                                                                        Figs. 1c and 9, and Supplementary Table 2). This indicates that
                                                                                        the depth estimated in this study provides comparatively accurate
                                                                                        result for the basement topography of the Kathmandu Basin and
                                                                                        confirms the conclusions of previous studies (e.g., Ibs-von Seht
                                                                                        and Wohlenberg, 1999; Delgado et al., 2000; Parolai et al., 2002;
                                                                                        Hinzen et al., 2004; García-Jerez et al., 2006; D’Amico et al.,
                                                                                        2004; Birgören et al., 2009; Dinesh et al., 2010; Gosar and Lenart,
                                                                                        2010; Özalaybey et al., 2011; Sukumaran et al., 2011) and encour-
                                                                                        ages the use of microtremor observations for an approximate esti-
                                                                                        mation of sediment depth over wide basin areas.

Fig. 12. Gravity contour map in the Kathmandu Valley (redrawn after Moribayashi
and Maruo (1980))
                                                                                        5. Conclusions

(2002). These two sections correlate well and show that the distri-                         In order to explore the hazard level as well as to estimate the
bution of the sediment thickness based on this study is in good                         risk of next expected earthquake disaster in the Kathmandu Valley,
agreement with the distribution of the soft sediment proposed                           a study on the floor variation of the lacustrine sediments in the
by Sakai et al. (2002).                                                                 Kathmandu Basin was done. Due to lack of adequate and precise
   We further compared the basement topography estimated in                             scientific studies on the floor variation of sediments in the basin,
this study with the gravity contour map (Fig. 12) prepared by Mor-                      however, it is always difficult to ascertain their characteristics dur-
ibayashi and Maruo (1980) for the central area of the Kathmandu                         ing earthquakes, which ultimately leads to erroneous and assumed
Basin. The basement topography obtained from the microtremor                            data for ground modeling as well as analysis and design of the
observations in this study (Fig. 9) is found quite similar with the                     infrastructures. This study attempts to fill this gap by proposing
results of the gravity survey conducted by Moribayashi and Maruo                        an approximate basement topography of the Kathmandu Basin
(1980) because the low gravity is obtained in the center of the val-                    using microtremor observation at 172 locations. This study also
ley where the thickness of the lacustrine sediments is high and                         enables to estimate the soft sediment variation in the Kathmandu
gradually increases towards the marginal area where the sediment                        Basin using a non-linear regression equation (h ¼ 146:01fr%1:2079 ),
thickness is low. Moreover, the first depression along north to                         and provides the hidden basement topography of the Kathmandu
south through central part of the valley and second depression                          Basin. The sediment/rock below this basement topography may
along northwest to southeast proposed in this study matched quite                       not take part for the amplification of the ground motion during
well with the gravity data as mentioned by Moribayashi and Mar-                         earthquake in the Kathmandu Valley.
uo (1980).                                                                                  The distribution of sediment indicates that the deepest part of
   In order to compare the calculated depth of the basement rock                        the lake existed mainly in the central part of Kathmandu, where
based on microtremor observation with the actual depth of the                           the main core city exists at present, and is one of the oldest resi-
Kathmandu Basin, two boreholes (BH1 and BH2) used also by Sakai                         dential areas in the Kathmandu Valley. It also accommodates a
et al. (2001) for academic purposes were considered, as shown in                        number of departmental stores, Government Offices, historical
Fig. 13. According to Stöcklin and Bhattarai (1981) and Sakai                           monuments including UNESCO cultural world heritage sites. More-
et al. (2001), the basement of the Kathmandu Valley consists of                         over, due to an increasing population and developing as a greater
weakly metamorphosed Phulchauki Group (Fig. 2), which consists                          commercial hub, the central part has seen a sharp rise in the num-
of Paleozoic sandstone, phyllite and weathered rocks. Moreover,                         ber of mid-height to tall buildings, which are constructed without
Sakai et al. (2001) have mentioned that almost all sand and gravels                     adequate geotechnical investigation. Depending upon the type and
at the lower part of the core are composed of detritus to weakly                        stories of buildings, the predominant frequencies are different. The
metamorphosed sedimentary rocks derives from the underlying                             thickness distribution map shows that the main lake part (i.e. cen-
Kathmandu Complex. There is always confusion in the type of lith-                       tral part) has a considerable thickness of the soft sediments, and
ological layer below the clay (unconsolidated) layer; hence, it is al-                  hence, it is prone to higher amplification of seismic wave at the
ways difficult to differentiate the sediment of bedrock with the                        corresponding predominant frequencies.
basal conglomerate or gravelly soil in the Kathmandu Basin from                             The map thus depicted shall not be meant as a detailed and
the borehole data. Fig. 13a and b shows the lithostratigraphy in                        highly constrained representation of the valley bedrock; however,
two boreholes (BH1 and BH2) (Sakai, 2001, and Sakai et al.,                             it represents the first reliable reconstruction of the subsurface
2001), in which the depth of the basement rock is shown at about                        morphology of the Kathmandu Basin, which shows a good consis-
252 m in borehole BH1 (Fig. 13a) and thick layer of the sand is                         tency with available geological/log data. This study represents a
shown below 232 m in borehole BH2 (Fig. 13b). These figures also                        useful starting point for future research and investigation

Please cite this article in press as: Paudyal, Y.R., et al. Basement topography of the Kathmandu Basin using microtremor observation. Journal of Asian Earth
Sciences (2012), http://dx.doi.org/10.1016/j.jseaes.2012.11.011
10 Y.R. Paudyal et al. / Journal of Asian Earth Sciences xxx (2012) xxx–xxx
tem’ (Team Leader: Ryuichi Yatabe, Ehime University, AY2009–
AY2011) and supported financially by the Government of Japan un-
der Grant-in-Aid for Overseas Scientific Research and Investigation.
Appendix A. Supplementary material
Supplementary data associated with this article can be found,
in the online version, at http://dx.doi.org/10.1016/j.jseaes.2012.
11.011.
References
Birgören, G., özel, O., Siyahi, B., 2009. Bedrock depth mapping of the coast south of
Istanbul: comparison of analytical and experimental analyses. Turkish Journal
of Earth Science 18, 315–329.
Bilham, R., Bodin, P., Jackson, M., 1995. Entertaining a great earthquake in western
Nepal: historic inactivity and geodetic tests for the present state of strain.
Journal of Nepal Geological Society 11, 73–78.
Bonnefoy-Claudet, S., Cornou, C., Bard, P.Y., Cotton, F., Moczo, P., Kristek, J., Fäh, D.,
2006. H/V ratio: a tool for site effects evaluation results FROM 1-D noise
simulations. Geophysical Journal International 167, 827–837.
Bour, M., Fouissac, D., Dominique, P., Martin, C., 1998. One the use of microtremor
recordings in seismic microzonation. Soil Dynamics and Earthquake
Engineering 17, 465–474.
Bozdag, E., Kocaoglu, A.H., 2005. Estimation of site amplification from shear-wave
velocity profiles in Yesilyurt and Avcilar, Istanbul, by frequency–wavenumber
analysis of microtremor. Journal of Seismology 9, 87–98.
Chitrakar, G.R., Pandey, M.R., 1986. Historical earthquakes of Nepal. Bulletin
Geological Society of Nepal 4, 7–8.
Dahal, R.K., Aryal, A., 2002. Geotechnical properties of soil of Sundhara and Jamal
area of Kathmandu. Journal of Nepal Geological Society 27, 77–86 (special
issue).
Dalgic, S., 2004. Factors affecting the greater damage in the Avcilar area of Istanbul
during the 17 August 1999 Izmit earthquake. Bulletin of Engineering Geology
and the Environment 63 (3), 221–232.
Delgado, J., Casado, C.L., Lopez, Giner, J., Estevez, A., Cuenca, A., Molina, S., 2000.
Microtremors as a geophysical exploration tool: applications and limitations.
Pure and Applied Geophysics 157, 1445–1462.
Dinesh, B.V., Nair, G.J., Prasad, A.G.V., Nakkeeran, P.V., Radhakrishna, M.C., 2010.
Estimation of sedimentary layers shear wave velocity using micro-tremor H/V
ratio measurements for Bangalore city. Soil Dynamics and Earthquake
Engineering 30, 1377–1382.
Dangol, G.M.S., 1985. Geology of the Kathmandu fluvio-lacustrine sediments in the
light of new vertebrate fossil occurrences. Journal of Nepal Geological Society 3,
43–47.
D’Amico, V., Picozzi, M., Albarello, D., Naso, G., Tropenscovino, S., 2004. Quick
Fig. 13. (a) Litho-stratigraphic section in central part of the Kathmandu Basin, on estimates of soft sediment thicknesses from ambient noise horizontal to
the basis of drill-cores (BH1) (refer Figs. 1c and 9) collected by the Paleo- vertical spectral ratios: a case study in southern Italy. Journal of Earthquake
Kathmandu Lake Project in 2000; (b) Litho-stratigraphic section of borehole BH2 Engineering 8 (6), 895–908.
(refer Figs. 1c and 9). Downward black arrows show the depth of the basement as Field, E.H., Hough, S.H., Jacob, K.H., 1990. Using Microtremors to assess potential
per present study. earthquake site response: a case study in Flushing Meadows New York City.
Bulletin of the Seismological Society of America 80, 1456–1480.
Field, E., Jacob, K., 1993. The theoretical response of sedimentary layers to ambient
seismic noise. Geophysical Research Letters 20 (24), 2925–2928.
activities, such as detailed surveys, numerical modeling, and seis- Finn, W.D.L., 1991. Geotechnical engineering aspects of microzonation. In:
mic hazard or microzonation studies. Proceedings of the 4th International Conference on Seismic Zonation vol. 1,
pp. 100–159.
Fujii, R., Sakai, H., 2002. Paleoclimatic changes during the last 2.5 myr recorded in
Acknowledgements the Kathmandu Basin, Central Nepal Himalayas. Journal of Asian Earth Sciences
20, 255–266.
The authors are grateful to Mr. Ramhari Dahal (The Department García-Jerez, A., Luzón, F., Navarro, M., Pérez-Ruiz, J.A., 2006. Characterization of the
Sedimentary cover of the Zafarraya Basin, Southern Spain, by means of ambient
of Education, Government of Nepal) and Mr. Prakash Poudyal noise. Bulletin of the Seismological Society of America 96 (3), 957–967.
(Kathmandu University) for their help during the extensive micro- Gosar, A., Lenart, A., 2010. Mapping the thickness of sediments in the Ljubljana
tremor survey in the Kathmandu Valley. The help provided by Ms. Moor basin (Slovenia) using microtremors. Bulletin of Earthquake Engineering
8, 501–518.
Manita Timilsina (PhD candidate, Graduate School of Science and Hagen, T., 1969. Report on the geological survey of Nepal. Denkschr
Engineering, Ehime University) in preparing a few GIS-based maps Schweizerischen Naturforschenden Gesellschaft 81, 185.
is greatly appreciated. The authors would also like to express their Hardesty, K., Wolf, L.W., Bodin, P., 2010. Case history, noise to signal: a microtremor
study at liquefaction sites in the New Madrid Seismic Zone. Geophysics 75 (3),
special appreciation to Dr. Shinichiro Mori (Associate Professor, B83–B90.
Graduate School of Science and Engineering, Ehime University) Hasancebi, N., Ulusay, R., 2006. Evaluation of site amplification and site period using
for enabling the first author to analyze the microtremor survey different methods for an earthquake-prone settlement in Western Turkey.
Engineering Geology 87, 85–104.
data. The authors also appreciate the comments and suggestions
Hinzen, K.-G., Weber, B., Scherbaum, F., 2004. On the resolution of H/V
provided by the anonymous reviewers, which help to modify the measurements to determine sediment thickens, a case study across a normal
manuscript. fault in the Lower Rhine Embayment. Germany. Journal of Earthquake
This is a part of the study entitled ‘Integrated approach to Engineering 8 (6), 909–926.
Hough, S.E., Bilham, R., 2008. Site response of the Ganges basin inferred from re-
studying rain- and earthquake-induced disasters in the Himalayan evaluated macroseismic observations from the 1897 Shillong, 1905 Kangra, and
Watersheds and development of a strategic disaster education sys- 1934 Nepal earthquakes. Journal of Earth System and Science 117, 773–782.
Please cite this article in press as: Paudyal, Y.R., et al. Basement topography of the Kathmandu Basin using microtremor observation. Journal of Asian Earth
Sciences (2012), http://dx.doi.org/10.1016/j.jseaes.2012.11.011Y.R. Paudyal et al. / Journal of Asian Earth Sciences xxx (2012) xxx–xxx 11
Ibs-von Seht, M., Wohlenberg, J., 1999. Microtremor measurements used to map Resources, Infrastructures, Climate Change and Natural Disasters 15–17
thickness of soft sediments. Bulletin of the Seismological Society of America 89, November 2010, Kathmandu, Nepal.
250–259. Paudyal, Y.R., Yatabe, R., Bhandary, N.P., Dahal, R.K., 2012a. A study of local
JICA, 2002. The Study on Earthquake Disaster Mitigation in the Kathmandu Valley amplification effect of soil layers on ground motion in the Kathmandu Valley
Kingdom of Nepal. Japan International Cooperation Agency (JICA) and Ministry using microtremor analysis. Journal of Earthquake Engineering and Engineering
of Home Affairs His Majesty’s Government of Nepal, vol. I: Summary, and vol. Vibration 11 (2), 257–268.
IV: Appendix. Paudyal, Y.R., Bhandary, N.P., Yatabe, R., 2012b. Seismic Microzonation of densely
Kanai, K., 1954. Measurements of Microtremors. Bulletin of Earthquake Research populated area of Kathmandu Valley of Nepal using microtremor observations.
Institute, Tokyo University vol. 32, 199–210. Journal of Earthquake Engineering 16 (8), 1208–1229.
Karkas, A., Coruk, O., 2010. Liquefaction analysis of soils in the Western Izmit Basin Rai, S.M., Upreti, B.N., Guillot, S., Pêcher, A., Fort, P.L., 2004. Mineral chemistry
Turkey. Environmental and Engineering Geoscience 16 (4), 411–430. (biotite, muscovite, garnet, and plagioclase) in the Kathmandu and Gosainkund
Katel, T.P., Upreti, B.N., Pokharel, G.S., 1996. Engineering properties of fine grained regions, central Nepal Himalaya. Journal of Nepal Geological Society 30, 55–66.
soils of Kathmandu Valley Nepal. Journal of Nepal Geological Society 13, 121– Rana, B.J.B., 1935. Nepal Ko Maha Bhukampa (Great Earthquake of Nepal). Jorganesh
138. Press.
Kramer, S.L., 1996. Geotechnical Earthquake Engineering. Prentice Hall (Chapter 3 Sakai, H., 2001. Stratigraphic division and sedimentary facies of the Kathmandu
and 8). Basin Group, central Nepal. Journal of Nepal Geological Society 25, 19–32
Langston, C.A., Chiu, Shu-Chioung C., Lawrence, Z., Bodin, P., Horton, S., 2009. Array (special issue).
observations of microseismic noise and the nature of H/V in the Mississippi Sakai, H., Fujii, R., Kuwahara, Y., Upreti, B.N., Shrestha, S.D., 2001. Core drilling of the
Embayment. Bulletin of the Seismological Society of America 99 (5), 2893– basin-fill sediments in the Kathmandu Valley for paleoclimatic study:
2911. preliminary results. Journal of Nepal Geological Society 25, 9–18 (special issue).
Lermo, J., Rodríguez, M., Singh, S.K., 1988. The Mexico earthquake of september 19, Sakai, H., Fujii, R., Kuwahara, Y., 2002. Changes in the depositional system of the
1985 – natural period of sites in the valley of Mexico from microtremor Paleo-Kathmandu Lake caused by uplift of the Nepal Lesser Himalayas. Journal
measurements and strong motion data. Earthquake Spectra 4, 805–814. of Asian Earth Sciences 20, 267–276.
Moribayashi, S., Maruo, Y., 1980. Basement topography of the Kathmandu Valley, Sawicki, A., Swidzinski, W., 2006. A study on liquefaction susceptibility of some
Nepal – an application of the gravitational method to the survey of a tectonic soils from the cost of Marmara Sea. Bulletin of the Polish Academy of Sciences
basin in the Himalaya. Journal of Japan Society of Engineering Geology 21, 30–37. Technical Sciences 54 (4), 405–418.
Mucciarelli, M., 2011. Ambient noise measurements following the 2011 Seed, H.B., Idriss, I.M., 1969. Influence of soil conditions on ground motions during
Christchurch earthquake: relationships with previous microzonation studies, earthquakes. Journal of the Soil Mechanics and Foundation Division, ASCE 95,
liquefaction, and nonlinearity. Seismological Research Letters 82 (6), 919–926. 99–137.
Mugnier, J.L., Huyghe, P., Gajurel, A.P., Upreti, B.N., Jouanne, F., 2011. Seismites in SESAME, 2004. Guidelines for the implementation of the H/V spectral ratio
the Kathmandu basin and seismic hazard in central Himalaya. Tectonophysics technique on ambient vibrations Measurements, processing and
509, 33–49. interpretation. In: SESAME European Research Project Wp12 – Deliverable
Nakamura, Y., 1989. A method for dynamic characteristics estimation of subsurface d23.12, European Commission – Research General Directorate, Project No.
using microtremor on the ground surface. Quarterly Report of the Railway EVG1-CT-2000-00026. .
Technical Research Institute vol. 30, 25–33. Stöcklin, J., Bhattarai, K.D., 1981. Geology of Kathmandu area and central
Ohta, Y., Kagami, H., Goto, N., Kudo, K., 1978. Observation of 1 to 5-s microtremors Mahabharat Range, Nepal Himalaya. United Nations Development Program,
and their application to earthquake engineering. Part I: Comparison with long- Mineral Exploration Nepal (DP/UN/NEP-73-019/3). p. 64.
period accelerations at the Tokachi-oki earthquake of 1968. Bulletin of the Sukumaran, P., Parvez, I.A., Sant, D.A., Rangarajan, G., Krishnan, K., 2011. Profiling of
Seismological Society of America 68 (3), 767–779. late tertiary–early quaternary surface in the lower reaches of Narmada valley
Olgun, C.G., Sezen, A., Kayali, S., Martin II, J.R., Polito, C.P., Yildirim, H., 2008. using microtremors. Journal of Asian Earth Sciences 41, 325–334.
Dynamic behavior of fine grained soils – 1999 Kocaeli earthquake case history. Tuladhar, R., Yamazaki, F., Warnitchai, P., Saita, J., 2004. Seismic microzonation of
In: The 14th World Conference on Earthquake Engineering, Beijing, China, pp. the greater Bangkok area using microtremor observations. Earthquake
817–833. Engineering and Structure Dynamics 33, 211–225.
Özalaybey, S., Zor, E., Ergintav, S., Tapırdamaz, M.C., 2011. Investigation of 3-D basin _
Ündül, Ö., Tugrul, A., 2006. The Engineering Geology of Istanbul, Turkey. IAEG 2006,
structures in the Izmit Bay area (Turkey) by single-station microtremor and Paper 392.
gravimetric methods. Geophysical Journal International 186, 883–894. Upreti, B.N., 1999. An overview of the stratigraphy and tectonics of the Nepal
Pandey, M.R., Molnar, P., 1988. The distribution of intensity of the Bihar–Nepal Himalaya. Journal of Asian Earth Sciences 17, 577–606.
earthquake 15 January 1934 and bounds of the extent of the rupture zone. Upreti, B.N., Yoshida, M., 2009. Seismic Hazard and Mitigation Activities in Nepal –
Journal of Nepal Geological Society 5, 22–44. with Emphasis on Kathmandu Valley. Journal of South Asia Disaster Studies 2
Pandey, M.R., Tandukar, R.P., Avouac, J.P., Lavé, J., Massot, J.P., 1995. Interseismic (1), 1–19.
strain accumulation on the Himalayan crustal ramp (Nepal). Geophysical Yoshida, M., Igarashi, Y., 1984. Neogene to Quaternary lacustrine sediments in the
Research Letters 22 (7), 751–754. Kathamandu Valley Nepal. Journal of Nepal Geological Society 4, 73–100.
Parolai, S., Bormann, P., Milkereit, C., 2002. New relationship between vs, thickness Yoshida, M., Gautam, P., 1988. Magnetostratigraphy of Plio-Pleistocene lacustrine
of sediments, and resonance frequency calculated by the H/V ratio of seismic deposits in the Kathmandu valley, central Nepal. Proceedings of the Indian
noise for the Cologne area (Germany). Bulletin of the Seismological Society of National Science Academy 54A, 410–417.
America 92 (6), 2521–2527. Zor, E., Özalaybey, S.C., Karaaslan, A., Tapirdamaz, M.C., Özalaybey, S.C., Tarancioglu,
Paudel, M.R., 2010. Lithological and mineralogical variations: indicator of A., Erkan, B., 2010. Shear wave velocity structure of the Izmit_ Bay area (Turkey)
provenance and paleoenvironmental change of the Kathmandu Basin fill estimated from active–passive array surface wave and single-station
sediments, Nepal. In: Sixth Nepal Geological Congress on Geology, Natural microtremor methods. Geophysical Journal International 182, 1603–1618.
Please cite this article in press as: Paudyal, Y.R., et al. Basement topography of the Kathmandu Basin using microtremor observation. Journal of Asian Earth
Sciences (2012), http://dx.doi.org/10.1016/j.jseaes.2012.11.011You can also read