Computer Mouse Movements as an Indicator of Work Stress: Longitudinal Observational Field Study
←
→
Page content transcription
If your browser does not render page correctly, please read the page content below
JOURNAL OF MEDICAL INTERNET RESEARCH                                                                                                        Banholzer et al

     Original Paper

     Computer Mouse Movements as an Indicator of Work Stress:
     Longitudinal Observational Field Study

     Nicolas Banholzer1, MSc; Stefan Feuerriegel1, Prof Dr; Elgar Fleisch2,3, Prof Dr; Georg Friedrich Bauer4, Prof Dr;
     Tobias Kowatsch2,3, PhD
     1
      Department of Management, Technology and Economics, ETH Zurich, Zurich, Switzerland
     2
      Centre for Digital Health Interventions, Department of Management, Technology and Economics, ETH Zurich, Zurich, Switzerland
     3
      Centre for Digital Health Interventions, Institute of Technology Management, University of St. Gallen, Zurich, Switzerland
     4
      Center for Salutogenesis, Epidemiology, Biostatistics and Prevention Institute, University of Zurich, Zurich, Switzerland

     Corresponding Author:
     Tobias Kowatsch, PhD
     Centre for Digital Health Interventions
     Department of Management, Technology and Economics
     ETH Zurich
     Weinbergstr 56/58
     Zurich, 8092
     Switzerland
     Phone: 41 799129133
     Email: tkowatsch@ethz.ch

     Abstract
     Background: Work stress affects individual health and well-being. These negative effects could be mitigated through regular
     monitoring of employees’ stress. Such monitoring becomes even more important as the digital transformation of the economy
     implies profound changes in working conditions.
     Objective: The goal of this study was to investigate the association between computer mouse movements and work stress in
     the field.
     Methods: We hypothesized that stress is associated with a speed-accuracy trade-off in computer mouse movements. To test
     this hypothesis, we conducted a longitudinal field study at a large business organization, where computer mouse movements from
     regular work activities were monitored over 7 weeks; the study included 70 subjects and 1829 observations. A Bayesian regression
     model was used to estimate whether self-reported acute work stress was associated with a speed-accuracy trade-off in computer
     mouse movements.
     Results: There was a negative association between stress and the two-way interaction term of mouse speed and accuracy (mean
     −0.32, 95% highest posterior density interval −0.58 to −0.08), which means that stress was associated with a speed-accuracy
     trade-off. The estimated association was not sensitive to different processing of the data and remained negative after controlling
     for the demographics, health, and personality traits of subjects.
     Conclusions: Self-reported acute stress is associated with computer mouse movements, specifically in the form of a speed-accuracy
     trade-off. This finding suggests that the regular analysis of computer mouse movements could indicate work stress.

     (J Med Internet Res 2021;23(4):e27121) doi: 10.2196/27121

     KEYWORDS
     work stress; psychological stress; stress indicator; computer mouse movements; human-computer interactions

                                                                                  monitored and managed. The need for workplace stress
     Introduction                                                                 management increases even further as the digital transformation
     Stress in the workplace is responsible for over 120,000 deaths               of the economy implies profound changes in working conditions
     and US $187 billion in annual health care spending in the United             [2]. At the same time, digital transformation offers opportunities
     States [1]. To mitigate this burden, work stress must be                     for better stress management. Human-computer interactions
                                                                                  with ubiquitous digital devices could be used for real-time

     https://www.jmir.org/2021/4/e27121                                                                       J Med Internet Res 2021 | vol. 23 | iss. 4 | e27121 | p. 1
                                                                                                                            (page number not for citation purposes)
XSL• FO
RenderX
JOURNAL OF MEDICAL INTERNET RESEARCH Banholzer et al
monitoring of work-related stress. In particular, it has been
shown that the computer mouse responds to changes in muscular
Methods
activity as a result of stress [3-6]. Thus, previous studies have Study Design
investigated the association between stress and the use of the
computer mouse [7-11], for instance, by analyzing computer A 7-week longitudinal field study was conducted at a large
mouse movements [8,10,11]. However, the evidence from these European technology company. The company’s human resources
studies is, so far, based on lab experiments using artificially director asked 496 employees from different service units (ie,
designed computer tasks. Hence, it remains unclear whether an accounting, human resources, information technology,
association between stress and the use of the computer mouse marketing, quality management, logistics, and business
can also be observed in the field. development) to participate through an email invitation. The
invitation described the study’s objective of understanding the
For this study, we hypothesized that there is an association association between computer mouse movements and work
between stress and computer mouse movements. Our stress.
hypothesized association is based on the theory of neuromotor
noise [12-16]. Stress, induced by time pressure or multitasking, Subjects were not offered financial incentives. However, they
leads to higher neuromotor noise [15,16], which is the noise in were invited to a debriefing event at the end of the study, where
control signals steering motor movements. Lower signal-to-noise the aggregated results were presented. Further, their self-reports
ratios and limited capacity to process information lead to were made available to them through graphical diagrams so
adaptive movement behavior [12]. For instance, if subjects are they could monitor their stress levels over the course of the
required to execute fast movements, then neuromotor noise will study.
lead to greater variability in the direction of movement [15]. Among all invited employees, 71 subjects decided to participate.
The reason for this is that high or low execution speeds induce They installed our study software by clicking on a link in the
neuromotor noise, which makes it more difficult to hit the invitation. When subjects first opened the study software, a
intended target of the movement accurately and requires more tutorial explained how the software was used to report stress.
or fewer corrections, respectively, along the trajectory [13,14]. During the 7-week study period, the study software asked
That is, the accuracy of the movement has to adjust relative to subjects twice a day to report their stress level. The timings
the movement speed. were randomly triggered by our software, namely, once between
In short, the previous literature suggests that stress induces 9 AM and 11 AM and once between 2 PM and 4 PM. Prior to
neuromotor noise, resulting in a speed-accuracy trade-off in these self-reports, our software recorded all computer mouse
motor movements. This trade-off is particularly documented in movements for 30 minutes. If subjects were not using their
rapid aimed movements [13,14]; based on this, we can expect computer at that time (eg, due to a meeting), then no data were
that it also applies to computer mouse movements. We tested recorded.
our hypothesis with data from a longitudinal observational field Data about subjects’ computer mouse movements and
study that included 70 subjects and 1829 observations. Thereby, self-reports were securely transferred to a server at the
we collected computer mouse movements and self-reported organization, from which they were gathered by our research
stress levels from employees during their regular office work team to perform subsequent analyses. At the beginning of the
for 7 weeks. Using a Bayesian regression model, we present study, subjects were further asked to report their
findings that support our hypothesis that work stress is sociodemographics (ie, age, gender, and education), behavioral
characterized by a speed-accuracy trade-off in computer mouse attributes regarding health and nutrition (ie, sports, nutrition,
movements. smoking, and drinking habits), and expression of the big five
personality traits as measured by an established inventory [17].
All variables are described in Table 1.
https://www.jmir.org/2021/4/e27121 J Med Internet Res 2021 | vol. 23 | iss. 4 | e27121 | p. 2
(page number not for citation purposes)
XSL• FO
RenderXJOURNAL OF MEDICAL INTERNET RESEARCH Banholzer et al
Table 1. Variables and descriptions.
Variable Description
Target variable
Valence Self-reported valence on a scale from 1 (low) to 7 (high)
Arousal Self-reported arousal on a scale from 1 (low) to 7 (high)
Stress Dummy with 1 if valence 4 (stress), 0 otherwise (no stress)
Mouse movements
Speed Distance computer mouse is moved divided by the duration of the movement
Accuracy Proportion of mouse events where the movement direction remained equal along the x-axis and y-axis
Mouse events
Clicks Proportion of mouse tracks with clicks in a recording
Wheels Proportion of mouse tracks with wheels in a recording
Recording time
Weekday Categorical {1: Monday, 2: Tuesday, 3: Wednesday, 4: Thursday, 5: Friday, 6: Saturday and Sunday}
Daytime Dummy with 1 if recording was in the morning, 0 otherwise (in the afternoon)
Sociodemographics
Age Subject age
Gender Dummy with 1 if male, 0 otherwise (female)
Education Dummy with 1 if university degree, 0 otherwise (ie, high school or lower)
Health and nutrition
Sport Hours of sport per week
Nutrition Number of fruits or vegetables consumed per day
Alcohol Categorical {1: never, 2: 2-4 times per month, 3: 2-3 times per week, 4: more than 4 times per week}
Smoking Categorical {1: daily, 2: occasionally, 3: not anymore, 4: never smoked}
Personality traits The big five personality traits, each measured on a scale from 1 (low expression of the trait) to 10 (high
expression of the trait), based on an established inventory [17]
Mouse speed was computed as the total distance the mouse
Processing Computer Mouse Movements moved between the start time t=1 of a trajectory and its end
A Java application was developed to record computer mouse time T divided by the trajectory’s total duration T. Hence, this
movements (ie, timestamp and x- and y-coordinates) and mouse yielded the following:
events (ie, movement, click, and wheel). The application was
built on the Windows operating system’s standard software
drivers with a sample rate of approximately 125 Hz. Computer
mouse movements were recorded for 30 minutes and processed Mouse accuracy is the relative frequency of how often the
in the following way. Each recording was split into separate movement in x- and y-directions was not changed. It is
trajectories, where a trajectory started with a mouse movement formalized by the following:
and ended with a different mouse event (ie, a click or wheel).
Thereby, trajectories were only considered if their duration was
between 1 and 10 seconds. This approach was beneficial, as it
omitted trajectories that were extremely short or included
temporary phases where the mouse was not moving. For each where the variable eqdirt indicates whether the movement in
trajectory, two variables were computed: (1) mouse speed, which both x- and y-directions remained equal at time t. It returns a
is the average movement speed, and (2) mouse accuracy, which value of 1 if this is the case and 0 otherwise. Formally, it is
is the proportion of mouse events where the direction of the specified by the following:
movement remained equal along the x- and y-axes (ie, the
proportion of times the movement direction was not corrected).
Both variables were then averaged over all trajectories. These Accordingly, the larger the accuracy value is, the less the
provided the features that were inserted into our regression movement direction was altered. If the value for accuracy is 1,
model. then the movement direction was never altered, and if the value
for accuracy is 0, then the movement direction was always
https://www.jmir.org/2021/4/e27121 J Med Internet Res 2021 | vol. 23 | iss. 4 | e27121 | p. 3
(page number not for citation purposes)
XSL• FO
RenderXJOURNAL OF MEDICAL INTERNET RESEARCH Banholzer et al
altered. In other words, the more accurate movement was the simultaneous decrease in mouse speed and increase in mouse
one with fewer corrections. This directly relates our measure accuracy is associated with a higher probability of stress.
of accuracy to the theory of neuromotor noise, which predicts
Further independent variables were included in the above
more corrections as the movement speed is increased.
regression model as part of the sensitivity analysis. For instance,
The proportion of direction changes is commonly used as a to control for mouse usage, we computed the number of events
measure of accuracy in related work [18,19]. Another measure where the mouse was clicked or wheeled. Note that access to
for accuracy is the deviation from an optimal trajectory [19,20]. other human-computer interactions (eg, keyboard strokes) was
However, the theoretical model underlying the speed-accuracy not granted in this study due to privacy concerns.
trade-off predicts that higher movement speed leads to more
corrective submovements [13,14], not necessarily to a larger
Model Estimation
deviation from the optimal line between the start and end point A Bayesian approach was used for model estimation. Compared
of the trajectory. For that reason, we specifically chose the to classical statistics, the Bayesian approach requires the
proportion of direction changes as our measure of accuracy in specification of priors for all model parameters. When choosing
this study. flat priors, the classical and Bayesian approaches are the same.
However, when choosing a Bayesian prior (eg, a normal prior),
Stress Measurement the results are different, and sign errors are less frequent with
Acute stress was measured according to the circumplex model a Bayesian prior [25]. In other words, a Bayesian approach is
of affect [21]. This model relates affective states to two less prone to making wrong claims about the sign of a parameter.
underlying neurophysiological systems: valence, a In our study setting, this would most likely give more
pleasure-displeasure continuum, and arousal or alertness [22]. conservative estimates; hence, a Bayesian approach was used
Both were collected using self-assessment manikins [23] on a for data analysis. We chose weakly informative priors for all
7-point Likert scale, with a value of 1 referring to a very model parameters, thereby following recommendations on the
negative valence (very low arousal) and a value of 7 indicating choice of priors [26]. Our priors are as follows:
a very positive valence (very high arousal). Acute stress was
then defined as a combination of low valence and high arousal,
which has been shown to be related to work stressors in
empirical research [24]. Specifically, stress is encoded as a
dichotomous variable that equals 1 if subjects reported low
valence and high arousal (ie, valence below the neutral midpoint
of 4 and arousal above the neutral midpoint of 4) and 0
otherwise. Hence, our encoding translates into an analysis that The model was estimated with Markov chain Monte Carlo using
focuses on distinguishing negative stress from positive or no four chains. Each chain performed 2000 iterations divided into
stress. 1000 iterations for a warm-up and 1000 iterations for sampling.
Samples were drawn with the No-U-Turn Sampler [27].
Statistical Analysis Thereby, it was ensured that all Markov chains converged
A logistic regression model was estimated with stress as the successfully so that inference could be performed. In the Results
dichotomous outcome variable and with features from computer section, we report the posterior distribution, the posterior mean,
mouse movements as the independent variables. The model is and the 95% highest posterior density interval (HPDI) of the
specified as follows: estimated parameters.
Statistical analysis was performed with the programming
language R, version 4.0.2 (The R Foundation), and the
where stressik is the dichotomous outcome variable for subject probabilistic programming language Stan, version 2.21.0 [28],
i=1,...,M and recording k=1,...,N. Subject-specific variation in using the interface provided by the R package brms, version
average stress levels is captured by the varying intercept αi. 2.13.5 [29].
Note that subject-specific characteristics such as age or gender
could explain between-subject variation of average stress levels,
Data Inclusion and Exclusion
but beyond that, time-varying variables such as computer mouse All participants deciding to participate were included in the
movements are needed to explain within-subject variation of study (ie, no additional inclusion or exclusion criteria were
stress levels over time. The association of mouse speed and applied). Our raw data contained 2029 recordings from 71
accuracy with stress is estimated by β1 to β3. In particular, the subjects. The number of recordings per subject varied due to
two-way interaction between mouse speed and accuracy (β3) absences or because the subjects decided to stop participating.
tests whether a speed-accuracy trade-off in computer mouse Further, recordings were excluded when no computer mouse
movements is associated with stress. Note that mouse speed movements were recorded (5 recordings), the recorded computer
and accuracy were centered and scaled by their empirical mean mouse movements contained tracking errors (ie, incorrect time
and standard deviation. By centering both variables, the sign of stamps) (92 recordings), or when the recordings contained less
β3 indicates the direction of the speed-accuracy trade-off. That than 10 computer mouse trajectories (200 recordings). This led
to the removal of 297 recordings from 62 subjects—between 1
is, a negative sign of β3 would indicate that a simultaneous
increase in mouse speed and decrease in mouse accuracy or a
https://www.jmir.org/2021/4/e27121 J Med Internet Res 2021 | vol. 23 | iss. 4 | e27121 | p. 4
(page number not for citation purposes)
XSL• FO
RenderXJOURNAL OF MEDICAL INTERNET RESEARCH Banholzer et al
and 12 per subject—and the exclusion of 1 subject from the with a median age of 39.5 years (IQR 31.0-49.0). Further, 46%
study. (32/70) of the participants were female, and 59% (41/70) held
a university degree; all others had high school diplomas or
Data and Code Availability lower. Recordings were roughly balanced by daytime hours
Preprocessed data and a script to replicate all model results are (951/1829, 52.0% in the morning and 878/1829, 48.0% in the
provided [30]. Raw data may be used to identify individual afternoon) and weekdays (329/1829, 18.0% to 384/1829, 21.0%
study participants (eg, because mouse movements can be very per weekday and 18/1829, 1% on the weekend).
specific to a person or may reveal sensitive information, such
as passwords, when using a software keyboard) and, thus, cannot Both valence and arousal varied across subjects (see Figure 1).
be made available; this decision was made by the research team Average valence per subject was slightly above the neutral
and the institutional review board that evaluated the study. midpoint (mean 4.53, SD 0.98), and average arousal was slightly
below the neutral midpoint (mean 3.28, SD 1.02). When
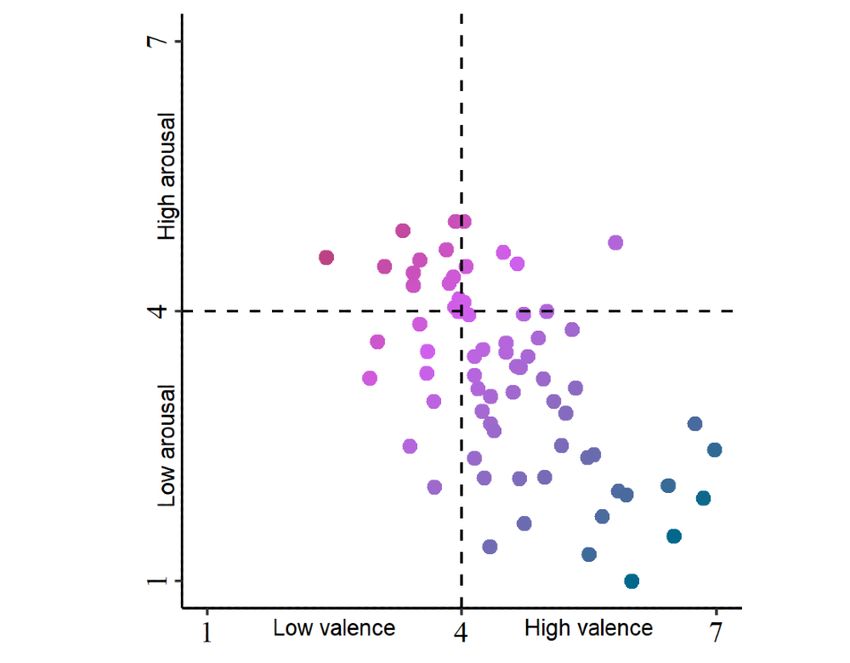
Results averaged over the study period, a combination of low valence
and high arousal (the top-left quadrant in Figure 1) was observed
Subject Statistics in 12 out of the 70 (17%) subjects. Applying our encoding of
stress following the circumplex model of affect [21], 185 out
Our results are based on 70 subjects and 1829 recordings (mean
of the 1829 self-reports (10.1%) were classified as stressful.
26.13, SD 14.33). Subjects were between 20 and 61 years old,
Figure 1. Perceived valence and arousal by subject. Shown are the average self-reported valence and arousal levels by subject in the field study. Red
points indicate high levels and blue points indicate low levels of average stress.
computer mouse movements were typically characterized by a
Association Between Stress and Computer Mouse trade-off where the mouse was moved quickly but less
Movements accurately (ie, many direction changes) or slowly but more
It was hypothesized that stress is characterized by a accurately (ie, few direction changes). Descriptives for average
speed-accuracy trade-off. This trade-off is illustrated in Figure mouse speed and accuracy are provided in Multimedia Appendix
2. When subjects perceived no stress, computer mouse 1, Figure S1.
movements were typically not characterized by a speed-accuracy
trade-off. In contrast to that, when subjects perceive stress,
https://www.jmir.org/2021/4/e27121 J Med Internet Res 2021 | vol. 23 | iss. 4 | e27121 | p. 5
(page number not for citation purposes)
XSL• FO
RenderXJOURNAL OF MEDICAL INTERNET RESEARCH Banholzer et al
The estimated parameters of mouse speed and accuracy were Figure 4 depicts the partial dependence of both mouse speed
as follows. The individual parameters of mouse speed (β1) and and mouse accuracy on the probability of perceiving stress.
accuracy (β2) were not significant based on the observation that Based on the plot, two findings can be derived. First, stress was
the 95% HPDIs include zero (see Figure 3). However, the more likely when there was a speed-accuracy trade-off. Second,
parameter for the two-way interaction between speed and this trade-off seemed slightly more prevalent for low mouse
accuracy (β3) was significant (mean −0.32, 95% HPDI −0.58 speed and high mouse accuracy, as indicated by a higher share
to −0.08). On average, a simultaneous 1 SD increase in mouse of observations in the lower-right corner. This means that
speed and 1 SD decrease in mouse accuracy, or vice versa, was although both directions of the trade-off are present in our data,
associated with a change in the odds for perceiving stress by subjects perceiving stress were slightly more frequently
1.53. In other words, work stress was characterized by a increasing accuracy at the cost of speed.
speed-accuracy trade-off.
Figure 2. Illustrative examples of the speed-accuracy trade-off in computer mouse movements. Shown are typical computer mouse movements (blue
dot: beginning of movement; red dot: click) from the field study. Circles correspond to recordings at 125 Hz. When subjects perceived no stress, computer
mouse movements were typically not characterized by a speed-accuracy trade-off. When subjects perceived stress, computer mouse movements were
typically characterized by a speed-accuracy trade-off. Mouse speed and accuracy were standardized to indicate the direction of the trade-off; that is,
high speed (+) and low accuracy (−) or low speed (−) and high accuracy (+).
https://www.jmir.org/2021/4/e27121 J Med Internet Res 2021 | vol. 23 | iss. 4 | e27121 | p. 6
(page number not for citation purposes)
XSL• FO
RenderXJOURNAL OF MEDICAL INTERNET RESEARCH Banholzer et al
Figure 3. Association between work stress and computer mouse movements. Shown is the estimated effect (posterior and prior density and mean as
solid and dashed grey lines, respectively, and 95% highest posterior density interval as shaded area) of mouse speed (β1), mouse accuracy (β2), and the
two-way interaction between mouse speed and accuracy (β2).
Figure 4. Probability (Prob.) of perceived stress based on mouse speed and accuracy. Shown is the partial dependence of stress on mouse speed and
accuracy in the range of −2 SD to +2 SD. Red areas indicate high levels and blue areas indicate low levels of stress.
Second, the sensitivity of the estimated parameter for the
Sensitivity Analysis speed-accuracy trade-off was assessed with respect to the
The sensitivity of the estimated parameters was assessed in the inclusion of varying slopes for computer mouse movement
following ways. First, different processing of the data led to variables and additional controls, such as mouse events and
conclusive findings. In the above analysis, recordings were sociodemographics. Including varying slopes or adding more
removed when fewer than 10 computer mouse trajectories were controls led to comparable estimates for the parameter of the
counted over 30 minutes. When varying this number, the mouse speed-accuracy trade-off (see Multimedia Appendix 1,
estimated parameter of the mouse speed-accuracy trade-off Figure S4).
remained stable (see Multimedia Appendix 1, Figure S2).
Similarly, the maximum duration for a trajectory was set to 10 Third, the association of computer mouse movements with
seconds. When varying the maximum duration from 5 to 20 valence, arousal, and a discrete measure of stress (defined as
seconds, the estimated parameter of the mouse speed-accuracy arousal – valence + 6) was estimated. Results from Poisson
trade-off also remained stable (see Multimedia Appendix 1, regressions with the same model specification showed no
Figure S3). Furthermore, recordings from 2 subjects revealed significant associations but a tendency that arousal and the
unusually low mouse accuracy (see Multimedia Appendix 1, discrete measure of stress were negatively associated with the
Figure S1). Excluding all recordings from these subjects slightly speed-accuracy trade-off (see Multimedia Appendix 1, Figure
reduced the size of the estimated parameter for the trade-off S5). However, the results from the regression with the discrete
(mean −0.22, 95% HPDI −0.42 to −0.03). measure of stress as the outcome should be interpreted with
caution, as an arousal level of 7 and valence level of 4 would
https://www.jmir.org/2021/4/e27121 J Med Internet Res 2021 | vol. 23 | iss. 4 | e27121 | p. 7
(page number not for citation purposes)
XSL• FO
RenderXJOURNAL OF MEDICAL INTERNET RESEARCH Banholzer et al
result in the equivalent level of stress as an arousal level of 5 work involves computer tasks; as such, computer mouse
and a valence level of 2, whereas only the second self-report movement data are readily available. Unlike other forms of
would be labeled as stress according to the circumplex model stress monitoring, computer mouse movements present a viable
of affect. tool for monitoring stress at scale because they can be collected
in an unobtrusive fashion and continuously over time [10]. The
Fourth, the possibility of selection bias was investigated, with
latter becomes important when offering on-demand stress
a statistical comparison between those subjects with few (n≤10)
management interventions by organizations and for monitoring
and many (n>10) recordings. The proportion of recordings with
their effectiveness [31]. It is also possible to monitor stress by
stress from subjects with few recordings (6/43, 14%) was higher
monitoring physiological changes (eg, heart rate variability or
than the proportion of recordings with stress from subjects with
skin conductivity) through wearable devices. However, when
many recordings (188/1986, 9.5%). However, the difference
introduced by employers, the broad usage of physiological data
was not statistically significant (χ21=0.5, P=.47). This result in a corporate context raises issues regarding their acceptance
suggests that participation intensity was not significantly related and legitimacy [32]. When compared to such physiological
to stress. Other than that, it could not be investigated whether stress measurements, many employees might consider the
individuals outside this study were more or less stressed than measurement of computer mouse movements as a clearly
the subjects participating in this study. work-related behavior and as a less intrusive and more legitimate
monitoring method at work. As computer mouse movements
Discussion are bound to currently performed work, their measurement will
trigger a more balanced action on the part of employees to
Principal Findings mitigate work stress: both reducing their own receptivity to
The goal of this study was to examine whether computer mouse stress and improving the underlying working conditions, as it
movements indicate work stress. Data from a 7-week is also recommended by the European Union [33]. Thus, the
longitudinal field study supported the hypothesis. Despite the measurement of computer mouse movements offers a valuable,
heterogeneity of computer tasks and the resulting complexity complementary approach to physiological measurements.
of computer mouse movements, we found a significant
association with work stress. That is, work stress was
Limitations
characterized by a speed-accuracy trade-off in computer mouse Our study also has limitations. First, our work constitutes an
movements. observational study with an explanatory analysis of the data.
As a consequence, a causal interpretation of the estimated
Comparison With Prior Work association is precluded. Second, computer mouse movements
This is the first study to infer stress from the computer mouse were only linked to the presence of stress, which was defined
in the field (ie, at the workplace). In prior work, lab studies were according to the circumplex model of affect [21]. The severity
conducted to investigate the association between stress and the of stress could not be assessed due to the low prevalence of high
use of the computer mouse [7-11]. In these lab studies, subjects levels of stress. Third, computer mouse movements were only
performed artificial tasks (eg, point-and-click tasks) in a linked to acute stress. The association of computer mouse
controlled environment. In contrast to that, our data were movements with chronic stress is subject to future work. Fourth,
collected unobtrusively while subjects were performing office the outcome of this study was psychological stress, which was
work in a real-world environment. On the one hand, this made measured based on self-reports. It is unclear if, and to what
data processing and analysis challenging. On the other hand, it extent, psychological and physiological measures of stress are
provided us with the unique opportunity to present the first alternative or complementary by nature [34]. Thus, collecting
empirical evidence as to whether stress is associated with physiological data from wearable devices to monitor stress
computer mouse movements in the field. [35,36] could be used to validate the association with computer
mouse movements. Fifth, the sources of stress were not
A drawback of our field study in comparison to the lab studies
identified, which is important for managing stress. However,
is that we are not able to estimate a causal link. The reason is
other work suggests that human-computer interactions also
that there are potentially unmeasured confounders. In particular,
correlate with workplace stressors [37]. Sixth, the determinants
computer mouse movements as well as stress may depend on
for the directions of the speed-accuracy trade-off were not
the difficulty of the task, with more difficult tasks resulting in
explored. This would probably require a different research
higher levels of stress. In the lab, it is possible to control which
setting, most likely a controlled lab experiment, in order to
task is performed, whereas this is not possible in the field
investigate what causes subjects to increase speed at the cost of
without obtrusive monitoring of tasks. However, precisely
accuracy, or vice versa.
because unobtrusive and continuous monitoring of tasks is not
feasible in the field, computer mouse movements may be a good Conclusions
proxy for how stressful a task is perceived and may thus provide To summarize, the findings of this study suggest that the
an indirect way to measure stress. computer mouse can be used to infer work stress. These findings
Benefits could be combined with findings from other forms of
human-computer interactions (eg, computer trackpads [38] or
Monitoring of computer mouse movements provide a number
keyboard strokes [39]) in order to develop digital tools for
of benefits for stress management in the workplace. Most office
detecting stress.
https://www.jmir.org/2021/4/e27121 J Med Internet Res 2021 | vol. 23 | iss. 4 | e27121 | p. 8
(page number not for citation purposes)
XSL• FO
RenderXJOURNAL OF MEDICAL INTERNET RESEARCH Banholzer et al
Acknowledgments
We would like to thank Andreas Filler for developing the software that allowed us to perform the computer mouse movement
and self-report recordings. NB and SF acknowledge funding from the Swiss National Science Foundation outside of this study.
Conflicts of Interest
EF and TK are affiliated with the Center for Digital Health Interventions, a joint initiative of the Department of Management,
Technology and Economics at ETH Zurich and the Institute of Technology Management at the University of St. Gallen, which
is funded in part by the Swiss health insurer CSS. EF and TK are also cofounders of Pathmate Technologies, a university spin-off
company that creates and delivers digital clinical pathways. However, Pathmate Technologies was not involved in the study
described in this paper.
Multimedia Appendix 1
Supplementary figures for descriptives and sensitivity analyses.
[DOCX File , 142 KB-Multimedia Appendix 1]
References
1. Goh J, Pfeffer J, Zenios SA. The relationship between workplace stressors and mortality and health costs in the United
States. Manage Sci 2016 Feb;62(2):608-628. [doi: 10.1287/mnsc.2014.2115]
2. Stacey N, Ellwood P, Bradbrook S, Reynolds J, Williams H, Lye D. Foresight on New and Emerging Occupational Safety
and Health Risks Associated with Digitalization by 2025. Luxembourg: European Agency for Safety and Health at Work;
2018. URL: https://osha.europa.eu/pt/publications/
foresight-new-and-emerging-occupational-safety-and-health-risks-associated [accessed 2021-03-16]
3. Wahlström J, Hagberg M, Johnson P, Svensson J, Rempel D. Influence of time pressure and verbal provocation on
physiological and psychological reactions during work with a computer mouse. Eur J Appl Physiol 2002 Jul;87(3):257-263.
[doi: 10.1007/s00421-002-0611-7] [Medline: 12111287]
4. Wahlström J, Lindegård A, Ahlborg G, Ekman A, Hagberg M. Perceived muscular tension, emotional stress, psychological
demands and physical load during VDU work. Int Arch Occup Environ Health 2003 Oct;76(8):584-590. [doi:
10.1007/s00420-003-0454-5] [Medline: 12898271]
5. Laursen B, Jensen B, Garde AH, Jørgensen AH. Effect of mental and physical demands on muscular activity during the
use of a computer mouse and a keyboard. Scand J Work Environ Health 2002 Aug;28(4):215-221 [FREE Full text] [doi:
10.5271/sjweh.668] [Medline: 12199422]
6. Visser B, De Looze MP, De Graaff MP, Van Dieën J. Effects of precision demands and mental pressure on muscle activation
and hand forces in computer mouse tasks. Ergonomics 2004 Feb 05;47(2):202-217. [doi: 10.1080/00140130310001617967]
[Medline: 14660213]
7. Hernandez J, Paredes P, Roseway A, Czerwinski M. Under pressure: Sensing stress of computer users. In: Proceedings of
the 32nd Annual ACM Conference on Human Factors in Computing Systems (CHI ’14). 2014 Presented at: 32nd Annual
ACM Conference on Human Factors in Computing Systems (CHI ’14); April 26-May 1, 2014; Toronto, ON p. 51-60. [doi:
10.1145/2556288.2557165]
8. Sun D, Paredes P, Canny J. MouStress: Detecting stress from mouse motion. In: Proceedings of the 32nd Annual ACM
Conference on Human Factors in Computing Systems (CHI ’14). 2014 Presented at: 32nd Annual ACM Conference on
Human Factors in Computing Systems (CHI ’14); April 26-May 1, 2014; Toronto, ON p. 61-70. [doi:
10.1145/2556288.2557243]
9. Wang J, Fu EY, Ngai G, Leong HV, Huang MX. Detecting stress from mouse-gaze attraction. In: Proceedings of the 34th
ACM/SIGAPP Symposium on Applied Computing (SAC ’19). 2019 Presented at: 34th ACM/SIGAPP Symposium on
Applied Computing (SAC ’19); April 8-12, 2019; Limassol, Cyprus p. 692-700. [doi: 10.1145/3297280.3297345]
10. Freihaut P, Göritz AS. Using the computer mouse for stress measurement – An empirical investigation and critical review.
Int J Hum Comput Stud 2021 Jan;145:102520. [doi: 10.1016/j.ijhcs.2020.102520]
11. Pepa L, Sabatelli A, Ciabattoni L, Monteriu A, Lamberti F, Morra L. Stress detection in computer users from keyboard
and mouse dynamics. IEEE Trans Consum Electron 2021 Feb;67(1):12-19. [doi: 10.1109/tce.2020.3045228]
12. Fitts PM. The information capacity of the human motor system in controlling the amplitude of movement. J Exp Psychol
1954;47(6):381-391. [doi: 10.1037/h0055392]
13. Meyer DE, Abrams RA, Kornblum S, Wright CE, Smith JE. Optimality in human motor performance: Ideal control of
rapid aimed movements. Psychol Rev 1988 Jul;95(3):340-370. [doi: 10.1037/0033-295x.95.3.340] [Medline: 3406245]
14. Meyer DE, Smith JEK, Kornblum S, Abrams RA, Wright CE. Speed-accuracy tradeoffs in aimed movements: Toward a
theory of rapid voluntary action. In: Proceedings of the Thirteenth International Symposium on Attention and Performance.
Mahwah, NJ: Lawrence Erlbaum Associates, Inc; 1990 Presented at: Thirteenth International Symposium on Attention and
Performance; June 27-July 2, 1988; Arc-et-Senans, France p. 173-226. [doi: 10.4324/9780203772010-6]
https://www.jmir.org/2021/4/e27121 J Med Internet Res 2021 | vol. 23 | iss. 4 | e27121 | p. 9
(page number not for citation purposes)
XSL• FO
RenderXJOURNAL OF MEDICAL INTERNET RESEARCH Banholzer et al
15. Van Galen GP, Van Huygevoort M. Error, stress and the role of neuromotor noise in space oriented behaviour. Biol Psychol
2000 Jan;51(2-3):151-171. [doi: 10.1016/s0301-0511(99)00037-x]
16. Van Gemmert AWA, Van Galen GP. Stress, neuromotor noise, and human performance: A theoretical perspective. J Exp
Psychol 1997;23(5):1299-1313. [doi: 10.1037/0096-1523.23.5.1299]
17. Rammstedt B, John OP. Measuring personality in one minute or less: A 10-item short version of the Big Five Inventory in
English and German. J Res Pers 2007 Feb;41(1):203-212. [doi: 10.1016/j.jrp.2006.02.001]
18. Grimes M, Jenkins J, Valacich J. Exploring the effect of arousal and valence on mouse interaction. In: Proceedings of the
34th International Conference on Information Systems (ICIS) in Human-Computer Interaction. 2013 Presented at: 34th
International Conference on Information Systems (ICIS) in Human-Computer Interaction; December 15-18, 2013; Milano,
Italy.
19. Yamauchi T, Xiao K. Reading emotion from mouse cursor motions: Affective computing approach. Cogn Sci 2018
Apr;42(3):771-819. [doi: 10.1111/cogs.12557] [Medline: 29131372]
20. Hibbeln MT, Jenkins JL, Schneider C, Valacich J, Weinmann M. How is your user feeling? Inferring emotion through
human-computer interaction devices. MIS Q 2017 Jan 1;41(1):1-21. [doi: 10.25300/misq/2017/41.1.01]
21. Russell JA. A circumplex model of affect. J Pers Soc Psychol 1980;39(6):1161-1178. [doi: 10.1037/h0077714]
22. Posner J, Russell JA, Peterson BS. The circumplex model of affect: An integrative approach to affective neuroscience,
cognitive development, and psychopathology. Dev Psychopathol 2005 Nov 1;17(03):715-734. [doi:
10.1017/s0954579405050340]
23. Bradley MM, Lang PJ. Measuring emotion: The self-assessment manikin and the semantic differential. J Behav Ther Exp
Psychiatry 1994 Mar;25(1):49-59. [doi: 10.1016/0005-7916(94)90063-9]
24. Van Katwyk PT, Fox S, Spector PE, Kelloway EK. Using the Job-Related Affective Well-Being Scale (JAWS) to investigate
affective responses to work stressors. J Occup Health Psychol 2000;5(2):219-230. [doi: 10.1037/1076-8998.5.2.219]
25. Gelman A, Tuerlinckx F. Type S error rates for classical and Bayesian single and multiple comparison procedures. Comput
Stat 2000 Sep 1;15(3):373-390. [doi: 10.1007/s001800000040]
26. Stan Development Team. Prior choice recommendations. GitHub. 2020. URL: https://github.com/stan-dev/stan/wiki/
Prior-Choice-Recommendations [accessed 2021-03-15]
27. Hoffman MD, Gelman A. The No-U-Turn Sampler: Adaptively setting path lengths in Hamiltonian Monte Carlo. J Mach
Learn Res 2014 Jan;15(1):1593-1623 [FREE Full text] [doi: 10.5555/2627435.2638586]
28. Carpenter B, Gelman A, Hoffman MD, Lee D, Goodrich B, Betancourt M, et al. Stan: A probabilistic programming language.
J Stat Softw 2017;76(1):1-32 [FREE Full text] [doi: 10.18637/jss.v076.i01]
29. Bürkner PC. brms: An R package for Bayesian multilevel models using Stan. J Stat Softw 2017;80(1):1-28 [FREE Full
text] [doi: 10.18637/jss.v080.i01]
30. Banholzer N, Feuerriegel S, Fleisch E, Bauer GF, Kowatsch T. Data and code: Computer mouse movements as an indicator
of work stress: Longitudinal observational field study. OSF. 2021. URL: https://doi.org/10.17605/OSF.IO/HE3F2 [accessed
2021-03-15]
31. Ganster DC, Rosen CC. Work stress and employee health. J Manage 2013 Feb 19;39(5):1085-1122. [doi:
10.1177/0149206313475815]
32. Lupton D. Health promotion in the digital era: A critical commentary. Health Promot Int 2015 Mar;30(1):174-183. [doi:
10.1093/heapro/dau091] [Medline: 25320120]
33. Leka S, Jain A. Mental Health in the Workplace in Europe.: EU Compass for Action on Mental Health and Well-being;
2017. URL: https://www.lisboninstitutegmh.org/assets/files/Mental%20health%20in%20the%20workplace%20in%20Europe.
pdf [accessed 2021-03-15]
34. Tams S, Hill K, Guinea A, Thatcher J, Grover V. NeuroIS—Alternative or complement to existing methods? Illustrating
the holistic effects of neuroscience and self-reported data in the context of technostress research. J Assoc Inf Syst 2014
Oct;15(10):723-753. [doi: 10.17705/1jais.00374]
35. Smets E, Rios Velazquez E, Schiavone G, Chakroun I, D'Hondt E, De Raedt W, et al. Large-scale wearable data reveal
digital phenotypes for daily-life stress detection. NPJ Digit Med 2018;1:67 [FREE Full text] [doi: 10.1038/s41746-018-0074-9]
[Medline: 31304344]
36. Natarajan A, Pantelopoulos A, Emir-Farinas H, Natarajan P. Heart rate variability with photoplethysmography in 8 million
individuals: A cross-sectional study. Lancet Digit Health 2020 Dec;2(12):e650-e657. [doi: 10.1016/s2589-7500(20)30246-6]
37. Eijckelhof BHW, Huysmans MA, Blatter BM, Leider PC, Johnson PW, van Dieën JH, et al. Office workers' computer use
patterns are associated with workplace stressors. Appl Ergon 2014 Nov;45(6):1660-1667. [doi: 10.1016/j.apergo.2014.05.013]
[Medline: 25005311]
38. Goel R, An M, Alayrangues H, Koneshloo A, Lincoln ET, Paredes PE. Stress tracker-detecting acute stress from a trackpad:
Controlled study. J Med Internet Res 2020 Oct 23;22(10):e22743 [FREE Full text] [doi: 10.2196/22743] [Medline: 33095176]
39. Vizer LM, Zhou L, Sears A. Automated stress detection using keystroke and linguistic features: An exploratory study. Int
J Hum Comput Stud 2009 Oct;67(10):870-886. [doi: 10.1016/j.ijhcs.2009.07.005]
https://www.jmir.org/2021/4/e27121 J Med Internet Res 2021 | vol. 23 | iss. 4 | e27121 | p. 10
(page number not for citation purposes)
XSL• FO
RenderXJOURNAL OF MEDICAL INTERNET RESEARCH Banholzer et al
Abbreviations
HPDI: highest posterior density interval
Edited by G Eysenbach; submitted 13.01.21; peer-reviewed by A Göritz, J Zhang; comments to author 05.02.21; revised version
received 16.02.21; accepted 25.02.21; published 02.04.21
Please cite as:
Banholzer N, Feuerriegel S, Fleisch E, Bauer GF, Kowatsch T
Computer Mouse Movements as an Indicator of Work Stress: Longitudinal Observational Field Study
J Med Internet Res 2021;23(4):e27121
URL: https://www.jmir.org/2021/4/e27121
doi: 10.2196/27121
PMID: 33632675
©Nicolas Banholzer, Stefan Feuerriegel, Elgar Fleisch, Georg Friedrich Bauer, Tobias Kowatsch. Originally published in the
Journal of Medical Internet Research (http://www.jmir.org), 02.04.2021. This is an open-access article distributed under the terms
of the Creative Commons Attribution License (https://creativecommons.org/licenses/by/4.0/), which permits unrestricted use,
distribution, and reproduction in any medium, provided the original work, first published in the Journal of Medical Internet
Research, is properly cited. The complete bibliographic information, a link to the original publication on http://www.jmir.org/,
as well as this copyright and license information must be included.
https://www.jmir.org/2021/4/e27121 J Med Internet Res 2021 | vol. 23 | iss. 4 | e27121 | p. 11
(page number not for citation purposes)
XSL• FO
RenderXYou can also read