Interferometric and fluorescence analysis of shock wave effects on cell membrane - Nature
←
→
Page content transcription
If your browser does not render page correctly, please read the page content below
ARTICLE
                  https://doi.org/10.1038/s42005-020-0394-3                OPEN

                  Interferometric and fluorescence analysis of shock
                  wave effects on cell membrane
                  Yusuke Ito 1, David Veysset                  2,3,   Steven E. Kooi3, Dmitro Martynowych2,3, Keiichi Nakagawa                             4,5 ✉   &
                  Keith A. Nelson2,3 ✉
1234567890():,;

                  Shock waves generated by laser pulses have been gaining attention for biological and medical
                  applications in which shock-induced cell membrane deformation influences cell permeation.
                  However, the mechanisms through which the deformation of cell membranes affects per-
                  meability remain mostly unknown because of the difficulty of observing in real time the
                  transient and dynamic behaviors of the shock waves and the cells. Here we present an all-
                  optical measurement method that can quantitatively capture the pressure distribution of the
                  propagating shock wave and simultaneously monitor the dynamic behavior of cell mem-
                  branes. Using this method, we find that the profile of the shock wave dictates the cell
                  membrane permeation. The results suggest a possible mechanism of membrane permeation
                  where sharp pressure gradients create pores on the membrane. Our measurement will foster
                  further understanding of the interaction of shock waves with cells, while the proposed
                  mechanism advances biological and medical applications of shock waves.

                  1 Department of Mechanical Engineering, The University of Tokyo, Tokyo 113-8656, Japan. 2 Department of Chemistry, Massachusetts Institute of

                  Technology, Cambridge, MA 02139, USA. 3 Institute for Soldier Nanotechnologies, Massachusetts Institute of Technology, Cambridge, MA 02139, USA.
                  4 Department of Bioengineering, The University of Tokyo, Tokyo 113-8656, Japan. 5 Department of Precision Engineering, The University of Tokyo, Tokyo 113-

                  8656, Japan. ✉email: kei@bmpe.t.u-tokyo.ac.jp; kanelson@mit.edu

                  COMMUNICATIONS PHYSICS | (2020)3:124 | https://doi.org/10.1038/s42005-020-0394-3 | www.nature.com/commsphys                                             1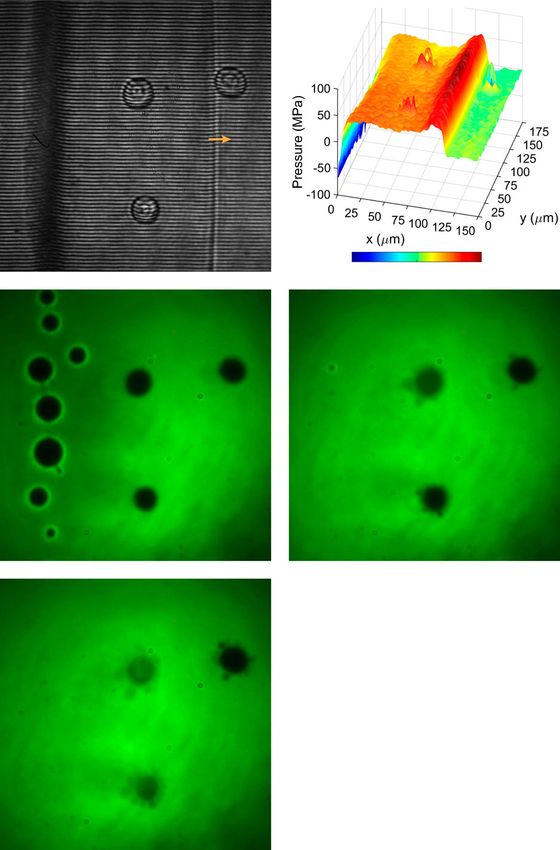
ARTICLE                                                                            COMMUNICATIONS PHYSICS | https://doi.org/10.1038/s42005-020-0394-3

B
       iological and medical applications of shock waves have been                        duration, 800-nm wavelength) was focused into a thin phosphate-
       attracting interest in both clinical and scientific studies1–3.                     buffered saline (PBS) liquid layer that included carbon nano-
       The applications involve a broad range of techniques, such                         particles, fluorescent dyes, and HeLa cells. Using a cylindrical lens
as damage induction on cancer cells4,5, delivery of DNA vaccines                          with a 200-mm focal length and an achromatic doublet with a
or anticancer chemotherapeutics into diseased cells6,7, treatment                         30-mm focal length, as shown in Fig. 1b, the focused laser line
of tissues3,8, and transformation of filamentous fungi9–11 and                             had a length of 750 µm and a width of 6 µm. The liquid was
bacteria12–15. The cell membrane, which works as a barrier and                            confined between 100-µm-thick and 200-µm-thick glass windows
also as a gate between the interior of a cell and outside envir-                          separated by a 10-µm polymer spacer, yielding a 10–20-µm thick
onment, plays an important role in mediating such physiological                           liquid layer. Upon laser absorption by the carbon nanoparticles,
effects. Membranes are sensitive to mechanical force and expected                         two counter-propagating planar shock waves were generated in the
to deform under the mechanical constraints resulting from the                             liquid layer and remained mostly confined in the plane due to the
interaction with a shock16,17. However, because the direct                                impedance mismatch between the liquid and the glass substrates21.
observation of the interaction in real time has not been achieved,                           To perform quantitative measurement of the shock pressure
the determinative mechanisms causing the membrane permea-                                 distribution with both high spatial and temporal resolution,
tion remain largely unclear.                                                              interferometric images were acquired with a Mach-Zehnder
   Better understanding has been impeded by the incompatibility                           interferometer and a variably-delayed probe laser pulse. The
of conventional medical shock wave devices based on piezo-                                probe pulse, generated by another amplified Ti:sapphire system
electric, electrohydraulic, or electromagnetic methods8 or of                             (150-fs pulse duration, 400-nm wavelength), was synchronized
hydrophone measurement of underwater shock profiles18 with                                 with the pump pulse and delivered to the liquid layer colinearly
direct real-time observation of individual cells as they interact                         with the pump pulse, as shown in Fig. 1b. The time delay between
with and respond to shock. Additionally, in biological studies,                           the pump and the probe pulses was adjusted using a delay
shock waves are commonly generated in petri dishes or vials                               generator controlling the timing of the two laser systems. Because
containing a number of cells in a culture solution, and the effects                       the jitter of the synchronization was 20 ns, the time difference
of shock waves are investigated after removing the culture solu-                          between the pump and probe pulses was measured by photo-
tion19, preventing monitoring of the dynamic behavior of indi-                            detectors in every experiment. By comparing the interferograms
vidual cells. In contrast, shock waves generated by focused                               obtained before and after the generation of shock waves, the
ultrashort laser pulses can be microscopically targeted4,6,19,20 and                      change in refractive index induced by the density change in the
synchronized with real-time optical probes.                                               liquid following the shock front was directly extracted. Note that
   Here we present an optically-based system that can produce                             a short probe pulse duration was necessary to avoid blurring of
controlled shock waves on a microscopic scale, acquire the shock                          the shock image, but precise timing between the pump and probe
pressure distribution quantitatively, and monitor the dynamic                             pulses was not needed.
behavior of cell membranes in response to shock. Our measure-                                To visualize the dynamic behavior of the cell membrane, we
ments allow changes of cell membranes to be associated with                               distributed outside the cells fluorescent dyes having no cell
quantitative characteristics of shock waves.                                              membrane permeability under normal conditions. The mem-
                                                                                          brane was observed as the interface between fluorescent and dark
                                                                                          regions. Transport of dye molecules from outside to inside the
Results                                                                                   cells resulting from shock-induced membrane permeability was
Experimental method. Figure 1 shows the experimental setup.                               observed as the appearance and increase of fluorescence inside
We generated planar shock waves by cylindrically focusing the                             the cell. In this study, fluorescein isothiocyanate (FITC) dextran
pump laser beam into a line, as illustrated in Fig. 1a. A picose-                         of average molecular weight 3000–5000 Da was used; the
cond laser pump pulse (amplified Ti:sapphire system, 300-ps                                molecules can permeate into cells when the size of the pores on

      a                                Cylindrically focused     b
                                            pump pulse                    Probe pulse                                 Argon-ion laser
                                                                     λ = 400 nm, τ = 150 fs                           λ = 488 nm, CW
                                                                                              BS

                                                                                                             Liquid                          f300
                                                                                   f300                      layer

                                                                                Cylindrical                f30    f30     DM            DM
                                                    Glass                                                                                      f500
                                                                                  f200
                                                  substrates
                                                                                                                                                               CCD
                                                                                              DM
                                                                          Pump pulse
                                                   10–20 μm                                        f30                                          Fluorescence
                                                                     λ = 800 nm, τ = 300 ps                  Sample
                                                  Liquid layer                                                                                   λ = 518 nm
                                                                                                   f30
                                                                                                                               f1000
                                          Cells
       Propagating     Laser-focused                                                                                                                  CCD
       shock waves          line                                                                                          BS

Fig. 1 Optical apparatus for analyzing cell membrane interactions with and responses to shock. a Sample assembly. Cells are placed in a thin liquid layer
that contains fluorescent dyes. A cylindrically focused pump pulse (red beam) irradiates a line in the plane of the liquid layer. Two counter-propagating
shock waves are launched and remain confined in the plane. b Optical setup. A cylindrical-lens configuration shapes the pump pulse into a line focus.
Interferometric imaging is performed using a Mach-Zehnder configuration and a variably-delayed probe pulse (blue beams). The probe beam is split into
two arms and recombined using two beam splitters (BS). The sample plane is imaged onto a charge-coupled device (CCD) using a two-lens telescope. A
continuous-wave (CW) argon-ion-laser beam (azure) is delivered to the sample plane through a dichroic mirror (DM) to induce dye fluorescence (green)
which is imaged onto another CCD. For each laser and fluorescence, λ is the wavelength. τ is the pulse duration of each laser. The focal length of lens is
indicated such as f300 where 300 is measured in millimeters.

2                           COMMUNICATIONS PHYSICS | (2020)3:124 | https://doi.org/10.1038/s42005-020-0394-3 | www.nature.com/commsphys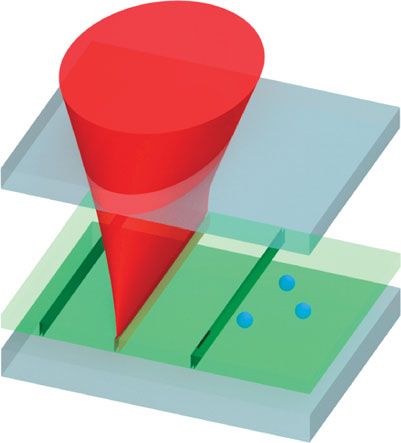
COMMUNICATIONS PHYSICS | https://doi.org/10.1038/s42005-020-0394-3                                                                      ARTICLE

      a   t = 25 ns                        b   t = 47 ns                   c   t = 80 ns                      g

                 Focused line

      d                                    e                               f                                  h

           -50         0        50 (MPa)        -50        0    50 (MPa)        -50        0      50 (MPa)

Fig. 2 Interferograms and analyzed shock waveforms. a–c Interferometric images showing shock wave propagation at three different time delays t.
Arrows indicate the propagation direction of the shock fronts. Bubbles are formed at the laser focused area and appear as a black line on the images. Each
image was recorded from a different sample region. Scale bars, 50 µm. d–f Spatial distributions of pressure extracted from a–c, respectively. g Comparison
of shock waveforms at different time delays as a function of the distance from the laser-focused line. h Full width at half maximum (FWHM) of each shock
waveform as a function of the position of shock front with respect to the laser-focused line. The error bars indicate the standard deviation.

cells becomes larger than that of FITC dextran. The fluorescent                   shock conditions for densities ranging from 1.00 to 1.21 g cm−3.
molecules were excited by a continuous-wave argon-ion-laser                      Shock pressures associated with the measured density changes
beam with a wavelength of 488 nm. Light was emitted with a                       were calculated using the Tait equation of state of water24. The
wavelength of 518 nm and separated from the excitation light                     uncertainty of the pressures is related to the uncertainty of the
using a dichroic mirror. This in situ monitoring was conducted in                density changes, which mainly originated from the uncertainty of
real time with a high-sensitivity charge-coupled device (CCD)                    the liquid thickness l.
camera.                                                                             The calculated pressure distributions with various time delays
                                                                                 corresponding to the three images in Fig. 2a–c are shown
Interferometric analysis. Interferograms of shock waves propa-                   respectively in Fig. 2d–f. x = 0 µm corresponds to the position at
gating in the liquid (in the absence of cells) were recorded to                  the laser-focused line. The pressure drop near x = 0 µm was
characterize the shock waves generated in our setup. Figure 2a–c                 caused by temperature increase (see Supplementary Fig. 2 and
shows images recorded with increasing probe pulse delays at a                    Supplementary Note 2 for details). The shock waveforms along
pump pulse energy of 200 ± 50 µJ. The shock fronts are obser-                    the horizontal line defined by the multiple arrows in Fig. 2a–c are
vable as distortions in the interferogram fringes. To quantitatively             plotted in Fig. 2g. The peak pressures at 25, 47, and 80 ns were
analyze the pressure profile of the shock, the interferometric                    52.8 ± 8.2, 46.3 ± 4.8, and 47.7 ± 3.5 MPa, corresponding to
images were converted to 2D phase images through a 2D Fourier                    density changes of 23.3 ± 3.3 mg cm−3, 20.6 ± 2.0 mg cm−3, and
transform method with a Hann function for spectrum apodiza-                      21.1 ± 1.5 mg cm−3, respectively. The full widths at half max-
tion22. After phase unwrapping, 2D phase images were obtained                    imum (FWHM) of the shock waveforms were 13.2 ± 0.2 µm,
before and after laser excitation and subtracted to obtain the                   16.2 ± 0.8 µm, and 21.3 ± 1.2 µm, respectively. The shock wave
optical phase change profile (see Supplementary Fig. 1 and Sup-                   propagated with a speed of 1458 ± 15 m s−1, which corresponded
plementary Note 1). The extracted phase change Δφ was con-                       to the acoustic speed in water (≈1450 m s−1) (see Supplementary
verted to the change in refractive index Δn based on the relation                Fig. 3a and Supplementary Note 3 for details).
                                                                                    The FWHM of each shock waveform at different propagation
                                       Δφ λ
                                Δn ¼        ;                          ð1Þ       distance is plotted in Fig. 2h. It expanded as the shock wave
                                       2π l                                      propagated. According to the linear fitting shown as the red line,
where λ is the wavelength of the probe pulse and l is the thickness              the initial FWHM at the laser-focused line was estimated to be
of the liquid layer. The thickness of the liquid layer ranged from               9.1 µm, and it expanded with the slope of 0.16. The peak
10 to 20 µm. Although the polymer spacer between the glass                       pressures of shock waves at different propagation distances had
substrates was 10-µm thick, distortion of the substrates caused the              large variations (see Supplementary Fig. 3b and Supplementary
variation of the liquid layer thickness. Therefore, the thickness                Note 3 for details) because of the fluctuations of the thickness of
within the imaging field of view was measured before each                         the liquid layer and the pump pulse energy. Despite the large
experiment with an uncertainty of 1.4 µm. The change in the                      variations in the peak pressures, the FWHM consistently
refractive index Δn was then translated into density change Δρ:                  indicated the clear (and well-known25) lengthening of the tail
                                                                                 of the shock wave with propagation.
                                   Δn
                           Δρ ¼         ½g cm3                       ð2Þ
                                  0:322                                          Fluorescence analysis. To monitor the dynamic behavior of cell
using an empirically determined formula for water23, valid under                 membrane simultaneously with interferometric imaging of the

COMMUNICATIONS PHYSICS | (2020)3:124 | https://doi.org/10.1038/s42005-020-0394-3 | www.nature.com/commsphys                                             3
ARTICLE COMMUNICATIONS PHYSICS | https://doi.org/10.1038/s42005-020-0394-3
a t = 84 ns b capillary forces prevented them from collapsing on a much
Cell #1 shorter time scale. As time increased, the brightness inside cells
Cell #3 #1 and #2, labeled in Fig. 3, increased. The increase in the
Cell #1 Cell #3
Cell #2 brightness indicates that pores were generated in the cell mem-
Pressure (MPa)
branes, and that fluorescent molecules permeated the cell mem-
branes when the pore size increased sufficiently. Pores can be
generated due to a non-uniform pressure distribution on the
Cell #2 membrane28. Blebs, the cellular protrusions, were observed
y (µm) around all three cells after the shock wave passed as shown in
x (µm)
Focused line Fig. 3d, e. Blebbing occurs due to local rupture of
-80 0 80 (MPa) membrane–cytoskeleton attachments in regions of high pressure
c t = 10 s d t = 150 s in cells29. Therefore, the results may indicate that the pressure is
unequally distributed and locally increased on the membrane
Cell #1
Cell #3
Cell #1
Cell #3 during the passage of the shock wave. The brightness changes
inside the cells were plotted in Fig. 3f by averaging the brightness
inside each cell and normalizing it by comparing the brightness
inside and outside the cell. In cells #1 and #2, the brightness
started to increase 94 s and 158 s after the shock, respectively, and
Cell #2 Cell #2 saturated at ~300 s. Permeation was not observed in cell #3
throughout the observation.
Bubbles
Discussion
e t = 300 s f Despite the slight difference between the locations of cells #1 and
Cell #3 #2, the time-dependences of their brightness changes differed
Cell #1
substantially. The difference may stem from either variability
between the cells or in the shock properties. To identify the
origin, we measured the brightness changes of 53 cells located at
different distances away from laser-focused lines in order to
Cell #2 investigate the time dependence of permeation behavior at dif-
ferent distances from the shock excitation region.
The results shown in Fig. 4a clearly indicate that the closer the
cells were located to the laser-focused line, the faster the bright-
ness of the cells increased. Because Fig. 2h showed that FWHM of
Fig. 3 Interferometric and fluorescence analysis. a Interferometric the shock waveform increased with the propagation of the shock
image showing a propagating shock wave and three cells with a time wave, the FWHM may affect the brightness change. To verify this
delay of 84 ns. An arrow indicates the propagation direction of the hypothesis, the cells were divided into two groups; one with
shock front. Scale bar, 50 µm. b Extracted spatial distribution of pressure. permeation of the fluorescent molecules at 300 s after the shock
c–e Fluorescence images showing the permeation behavior of the delivery and the other without permeation. As shown in Fig. 4b,
fluorescent molecules into the cells. Images were recorded c 10 s, d 150 s, the two groups were compared after calculating the FWHM at
and e 300 s after the pump pulse was delivered (time indicated by t). Scale the position of each cell (see Supplementary Fig. 5 and
bars, 50 µm. f Normalized brightness inside the cells with increasing time
after delivering the pump pulse obtained by fluorescence imaging. a b
shock, fluorescence imaging was used. Images were recorded for
300 s or longer with a frame rate of 0.5 Hz in a single experiment.
An interferogram recorded 84 ns after the pump pulse irradiated
the liquid layer, where cells are present, is shown in Fig. 3a. The
pressure distribution extracted from the interferogram is shown
in Fig. 3b. The pressure distribution indicates that the shock wave
propagated with no visible disturbance after encountering the cell;
the impedance mismatch between the water and the cell being
small, the shock was not reflected or attenuated significantly by
the cell26. The difference between the pressure distributions (peak
pressure and pressure at the tail) shown in Figs. 2d–f and 3b Fig. 4 Effect of a shock wave on cell permeation. a Normalized brightness
arises from the fluctuations of the thickness of the liquid layer and inside each cell located at different distance away from the laser-focused
the pump pulse energy independent from the presence of the line and at increasing time after the pump pulse was delivered.
cells. As shown in Fig. 3c–e, we captured the permeation behavior b Comparison of full width at half maximum (FWHM) of shock waveform
of the fluorescent molecules into the cells after cell-shock inter- at the position of each cell belonging to one of two groups: with permeation
action, from which membrane disruption can be inferred argu- (n = 19 cells, red circles) and without permeation (n = 16 cells, blue
ably at scales below the optical resolution. The laser-focused line diamonds) of fluorescent molecules at 300 s after the pump pulse was
observed in Fig. 3a evolved after 10 s into large bubbles (Fig. 3c delivered. The box plot shows the middle value of the data set (central line),
and Supplementary Fig. 4) that collapsed prior to 150 s (Fig. 3d). the 25th percentile (bottom of the box), and the 75th percentile (top of the
Bubbles normally collapse much faster in conventional experi- box) with a set of whiskers determined by the 1.5 interquartile ranges. Data
ments when they are not constrained27; however, because the were compared by conducting a two-tailed t-test using all data points and
bubbles were sandwiched between glass walls in our setup, the by calculating the probability value (p value).
4 COMMUNICATIONS PHYSICS | (2020)3:124 | https://doi.org/10.1038/s42005-020-0394-3 | www.nature.com/commsphysCOMMUNICATIONS PHYSICS | https://doi.org/10.1038/s42005-020-0394-3 ARTICLE
Supplementary Note 4 for details). The results of a t-test diameter, glass substrates (Schott D263®). A photoresist (SU-8 2015, MicroChem®)
demonstrated that there was a significant difference between the was coated and developed on the 200-µm-thick substrate to form a ring-patterned
spacer. The spacer had an outer diameter of 22 mm, an inner diameter of 19 mm,
two groups regarding the FWHM. When the propagation dis- and a thickness of 10 µm to ensure separation between the substrates.
tance is under 70 µm, the FWHM is typically smaller than the
diameter of the cells (~20 µm). Therefore, this suggests that at Cell preparation. HeLa cells were maintained in DMEM supplemented with 10%
short distance the shock wave is narrow enough to create both (v/v) fetal bovine serum and 1% (v/v) Pen Strep at 37 °C and 5% CO2 in a T-75
low- and high-pressure regions within a cell during the passage of flask. When the cells reached ~80% confluence, the growth media was aspirated.
the wave. This non-uniform pressure distribution creates pores Trypsin-EDTA 0.25% (2 mL) was added to the cells and incubated for 15 min at
37 °C and 5% CO2. To quench the trypsin, DMEM supplemented with 10% (v/v)
on the membrane, resulting in fluorescent molecule penetration fetal bovine serum and 1% (v/v) Pen Strep (8 mL) was added to the flask. In all,
into the cell through the pores. On the other hand, when the 7.5 mL of the dissociated cells in media were transferred to a 15 mL falcon tube and
propagation distance of the shock wave becomes larger, the spun at 500 rcf for 3 min. The supernatant was removed and the pellet was
FWHM typically exceeds the diameter of the cells. In this situa- resuspended in 250 µL of PBS.
tion, the cell cytoplasm is more homogeneously compressed and
released rather than being affected by the gradient of the pressure Sample characterization. The thickness of the liquid layer was calculated
field in the cell during the passage of the shock wave, therefore according to the Beer-Lambert law. The thickness l can be expressed as
limiting pore formation in the cell membrane and preserving the 1 I IB
l ¼ log10 ; ð3Þ
membrane impermeability to the fluorescent molecules. This α1 I0 IB
explains why permeation was not observed in cell #3 in Fig. 3f. where α1 is the absorption coefficient of the liquid, I and I0 are the brightness
Although microjets and secondary shock waves can be generated detected by a CCD after the probe pulses transmitted through the liquid sample
when the bubbles collapse30,31, the cells were located away from and a pure water in the glass substrates, respectively, and IB is the brightness of the
background without the probe pulses. α1 = 93 cm−1 was measured for the wave-
the laser-focused line, and therefore, the bubble collapse is length of 400 nm using a UV-VIS spectrometer. The effect of the reflection by the
expected to little effect on the cells. In addition, we anticipate glass surfaces on the accuracy of the thickness measurement was canceled by using
capillary effects to slow down bubble collapse (or prevent it the same glass substrates for the brightness measurements of the liquid sample and
entirely), consequently reducing the emission of secondary shock the pure water. For canceling the variation of the probe pulse energies and the
noise from the CCD, the exposure time of the CCD was set to 20 ms, so that the
wave. variation and the noise were averaged by the 20 probe pulses with a repetition rate
Because most conventional methods could not analyze the of 1 kHz. The thickness was calculated by the brightness of each pixel on the CCD
influence of shock pressure distribution on individual cells, the and averaged. A standard deviation of the thickness was measured to be 1.4 µm. It
key parameter causing membrane permeation has not been was calculated by comparing the 20 different images taken by moving the sample a
few micrometers in a plane before the experiments.
clarified. Although previous studies32–34 suggested the contribu-
tion of peak pressure, rise time or impulse, direct evaluation
Normalization of brightness. For the normalization, the average of the brightness
through quantitative analysis of the shock profile has not been of 100 pixels inside each cell was divided by a reference brightness, which was
achieved. Conversely, our method allows such analyses which the average of the brightness of 100 pixels outside the cell. The reference area was
demonstrate the crucial effect of FWHM. We anticipate that 10 µm away from each cell. The brightness inside the cells was above zero before
future studies considering different shock parameters, as well as the generation of the shock, because the fluorescence from the fluorescent mole-
cules existing between the cells and the glass substrate was detected.
cell conditions, will advance the understanding of the mechan-
isms leading to membrane permeation. Regarding shock para-
Reporting summary. Further information on research design is available in
meters, modulating the spatial and temporal profiles of the laser the Nature Research Reporting Summary linked to this article.
pulse will permit control of not only the FWHM but also the peak
pressure, rise time, fall time, impulse and number of shocks.
Data availability
Because our system allows the generation of shock waves and The data that support the findings of this work are available from the corresponding
quantitative analyses of shock parameters and cell permeability at author upon reasonable request.
the same time, the shock parameters can be further optimized
through direct observations. The optimization will contribute to Code availability
the more effective use of shock waves in the biotechnological and The codes used for the data collection and analysis are available from the corresponding
clinical applications. author upon reasonable request.
In summary, we have presented an all-optical measurement
system that can produce a planer shock wave whose spatial Received: 10 March 2020; Accepted: 17 June 2020;
profile, propagation through cells, and effects on cell membrane
behavior can be monitored. Our results demonstrate the influence
of the profile of the shock wave on membrane permeation, where
shocks that are shorter temporally and spatially are more likely to
make cells permeable to fluorescent dye. The results suggest a References
possible mechanism of membrane permeation due to sharp 1. Seah, B. C.-Q. & Teo, B. M. Recent advances in ultrasound-based transdermal
pressure gradients, i.e. non-uniform pressure distribution in the drug delivery. Int. J. Nanomed. 13, 7749–7763 (2018).
cell that deforms cell membranes and causes pore formation. Our 2. Battula, N., Menezes, V. & Hosseini, H. A miniature shock wave driven micro-
all-optical measurement will foster further understanding of the jet injector for needle-free vaccine/drug delivery. Biotechnol. Bioeng. 113,
2507–2512 (2016).
interaction of shock waves with cells, while the proposed 3. Mani-Babu, S., Morrissey, D., Waugh, C., Screen, H. & Barton, C. The
mechanism may guide the formulation of optimal conditions for effectiveness of extracorporeal shock wave therapy in lower limb
biological and medical applications of shock waves. tendinopathy. Am. J. Sports Med. 43, 752–761 (2015).
4. Steinhauser, M. O. & Schmidt, M. Destruction of cancer cells by laser-induced
shock waves: recent developments in experimental treatments and multiscale
Methods computer simulations. Soft Matter 10, 4778–4788 (2014).
Sample preparation. The liquid sample was made by mixing a 0.4 wt% carbon 5. Moosavi-Nejad, S. F., Hosseini, S. H. R., Satoh, M. & Takayama, K. Shock
nanoparticles, a 2 wt% of FITC dextran of average molecular weight 3000–5000 Da wave induced cytoskeletal and morphological deformations in a human renal
(FD4, Sigma-Aldrich®), and cells in PBS (Sigma-Aldrich®). The carbon con- carcinoma cell line. Cancer Sci. 97, 296–304 (2006).
centration was yielded by diluting black ink (Winsor & Newton Ink®) 50x in PBS. 6. Tirlapur, U. K. & König, K. Cell biology: targeted transfection by femtosecond
The liquid was enclosed between a 100 µm-thick and a 200 µm-thick, 1 inch- laser. Nature 418, 290–291 (2002).
COMMUNICATIONS PHYSICS | (2020)3:124 | https://doi.org/10.1038/s42005-020-0394-3 | www.nature.com/commsphys 5ARTICLE COMMUNICATIONS PHYSICS | https://doi.org/10.1038/s42005-020-0394-3
7. Azagury, A., Khoury, L., Enden, G. & Kost, J. Ultrasound mediated 30. Lauterborn, W. & Vogel, A. Shock wave emission by laser generated bubbles.
transdermal drug delivery. Adv. Drug Deliv. Rev. 72, 127–143 (2014). in Bubble Dynamics and Shock Waves, 67–103 (Springer, Berlin, 2013).
8. Zelle, B. A., Gollwitzer, H., Zlowodzki, M. & Bühren, V. Extracorporeal shock https://doi.org/10.1007/978-3-642-34297-4_3
wave therapy: current evidence. J. Orthop. Trauma 24, S66–S70 (2010). 31. Li, Z. G., Liu, A. Q., Klaseboer, E., Zhang, J. B. & Ohl, C. D. Single cell
9. Magaña-Ortíz, D. et al. A novel and highly efficient method for genetic membrane poration by bubble-induced microjets in a microfluidic chip. Lab
transformation of fungi employing shock waves. Fungal Genet. Biol. 56, 9–16 Chip 13, 1144–1150 (2013).
(2013). 32. Doukas, A. G. & Flotte, T. J. Physical characteristics and biological effects of
10. Gómez-Lim, M. A., Ortíz, D. M., Fernández, F. & Loske, A. M. laser-induced stress waves. Ultrasound Med. Biol. 22, 151–164 (1996).
Transformation of Fungi Using Shock Waves, 209–219 (Springer, Cham, 2015). 33. Mulholland, S. E., Lee, S., McAuliffe, D. J. & Doukas, A. G. Cell loading with
https://doi.org/10.1007/978-3-319-10142-2_21 laser-generated stress waves: the role of the stress gradient. Pharm. Res. 16,
11. Loske, A. M. Medical and Biomedical Applications of Shock Waves. (Springer, 514–518 (1999).
Cham, 2017). https://doi.org/10.1007/978-3-319-47570-7 34. Kodama, T., Hamblin, M. R. & Doukas, A. G. Cytoplasmic molecular
12. Jagadeesh, G., Nataraja, K. & Udayakumar, M. Shock waves can enhance delivery with shock waves: importance of impulse. Biophys. J. 79, 1821–1832
bacterial transformation with plasmid DNA. Curr. Sci. 87, 734–735 (2004). (2000).
13. Divya Prakash, G., Anish, R. V., Jagadeesh, G. & Chakravortty, D. Bacterial
transformation using micro-shock waves. Anal. Biochem. 419, 292–301
(2011). Acknowledgements
14. Loske, A. M., Campos-Guillen, J., Fernández, F. & Castaño-Tostado, E. We thank A. A. Maznev (MIT, USA) for discussion on the project, and C. Fadzen and B.
Enhanced shock wave-assisted transformation of Escherichia coli. Ultrasound Pentelute (MIT, USA) for sample preparation. This material is based upon work sup-
Med. Biol. 37, 502–510 (2011). ported in part by the U. S. Army Research Office through the Institute for Soldier
15. Campos-Guillén, J., Fernández, F., Pastrana, X. & Loske, A. M. Relationship Nanotechnologies, under Cooperative Agreement Number W911NF-18-2-0048.
between plasmid size and shock wave-mediated bacterial transformation.
Ultrasound Med. Biol. 38, 1078–1084 (2012). Author contributions
16. Steinbach, P., Hofstädter, F., Nicolai, H., Rössler, W. & Wieland, W. In vitro D.V., K.N., and K.A.N. designed the experiments. Y.I., D.V., S.E.K., and K.N. constructed
investigations on cellular damage induced by high energy shock waves. the experimental setup. Y.I. and K.N. conducted the experiments. D.V. developed the
Ultrasound Med. Biol. 18, 691–699 (1992). code to extract the pressure distribution from the interferogram. Y.I. analyzed the data.
17. Ohl, C.-D. & Wolfrum, B. Detachment and sonoporation of adherent HeLa- D.M. aided in performing experiments and interpreting the results. D.V., K.N., and
cells by shock wave-induced cavitation. Biochim. Biophys. Acta Gen. Subj. K.A.N. supervised the work. Y.I. wrote the paper and all authors contributed to
1624, 131–138 (2003). improvement of the paper.
18. Schoeffmann, H., Schmidt-Kloiber, H. & Reichel, E. Time-resolved
investigations of laser-induced shock waves in water by use of
polyvinylidenefluoride hydrophones. J. Appl. Phys. 63, 46–51 (1988). Competing interests
19. Chakravarty, P., Qian, W., El-Sayed, M. A. & Prausnitz, M. R. Delivery of The authors declare no competing interests.
molecules into cells using carbon nanoparticles activated by femtosecond laser
pulses. Nat. Nanotechnol. 5, 607–611 (2010).
20. Antkowiak, M., Torres-Mapa, M. L., Stevenson, D. J., Dholakia, K. & Gunn-
Additional information
Supplementary information is available for this paper at https://doi.org/10.1038/s42005-
Moore, F. J. Femtosecond optical transfection of individual mammalian cells.
020-0394-3.
Nat. Protoc. 8, 1216–1233 (2013).
21. Veysset, D., Мaznev, A. A., Pezeril, T., Kooi, S. & Nelson, K. A.
Correspondence and requests for materials should be addressed to K.N. or K.A.N.
Interferometric analysis of laser-driven cylindrically focusing shock waves in a
thin liquid layer. Sci. Rep. 6, 24 (2016).
Reprints and permission information is available at http://www.nature.com/reprints
22. Takeda, M. & Mutoh, K. Fourier transform profilometry for the automatic
measurement of 3-D object shapes. Appl. Opt. 22, 3977 (1983).
Publisher’s note Springer Nature remains neutral with regard to jurisdictional claims in
23. Yadav, H. S. et al. Measurement of refractive index of water under high
published maps and institutional affiliations.
dynamic pressures. J. Appl. Phys. 44, 2197–2200 (1973).
24. Gojani, A. B., Ohtani, K., Takayama, K. & Hosseini, S. H. R. Shock Hugoniot
and equations of states of water, castor oil, and aqueous solutions of sodium
chloride, sucrose and gelatin. Shock Waves 26, 63–68 (2016). Open Access This article is licensed under a Creative Commons
25. Pezeril, T. et al. Direct visualization of laser-driven focusing shock waves. Attribution 4.0 International License, which permits use, sharing,
Phys. Rev. Lett. 106, 214503 (2011). adaptation, distribution and reproduction in any medium or format, as long as you give
26. Kobayashi, K., Yoshida, S., Saijo, Y. & Hozumi, N. Acoustic impedance appropriate credit to the original author(s) and the source, provide a link to the Creative
microscopy for biological tissue characterization. Ultrasonics 54, 1922–1928 Commons license, and indicate if changes were made. The images or other third party
(2014). material in this article are included in the article’s Creative Commons license, unless
27. Akhatov, I. et al. Collapse and rebound of a laser-induced cavitation bubble. indicated otherwise in a credit line to the material. If material is not included in the
Phys. Fluids 13, 2805–2819 (2001). article’s Creative Commons license and your intended use is not permitted by statutory
28. Adhikari, U., Goliaei, A. & Berkowitz, M. L. Mechanism of membrane regulation or exceeds the permitted use, you will need to obtain permission directly from
poration by shock wave induced nanobubble collapse: a molecular dynamics the copyright holder. To view a copy of this license, visit http://creativecommons.org/
study. J. Phys. Chem. B 119, 6225–6234 (2015). licenses/by/4.0/.
29. Charras, G. T., Yarrow, J. C., Horton, M. A., Mahadevan, L. & Mitchison, T. J.
Non-equilibration of hydrostatic pressure in blebbing cells. Nature 435,
365–369 (2005). © The Author(s) 2020
6 COMMUNICATIONS PHYSICS | (2020)3:124 | https://doi.org/10.1038/s42005-020-0394-3 | www.nature.com/commsphysYou can also read