Upregulated expression of leukocyte immunoglobulin like receptor A3 in patients with severe aplastic anemia
←
→
Page content transcription
If your browser does not render page correctly, please read the page content below
EXPERIMENTAL AND THERAPEUTIC MEDICINE 21: 346, 2021
Upregulated expression of leukocyte immunoglobulin‑like
receptor A3 in patients with severe aplastic anemia
HONG YU*, HUI LIU*, YANG ZHAO*, HUAQUAN WANG, CHUNYAN LIU, WEIWEI QI, ZHAOYUN LIU,
YINGYING SUN, SHAN GAO, JINGLIAN TAO, RONG FU and ZONGHONG SHAO
Department of Hematology, Tianjin Medical University General Hospital, Tianjin 300052, P.R. China
Received June 24, 2020; Accepted November 3, 2020
DOI: 10.3892/etm.2021.9777
Abstract. Severe aplastic anemia (SAA) is a rare and poten‑ which may affect the function of mDCs. LILRA3 may have a
tially life‑threatening disease characterized by pancytopenia significant role in the immune pathogenesis of SAA.
and bone marrow (BM) hypoplasia. In a previous study by
our group, increased expression of leukocyte immunoglob‑ Introduction
ulin‑like receptors A (LILRA), LILRA3 in myeloid dendritic
cells (mDCs) and LILRA5 in CD34+ cells in SAA was detected Severe aplastic anemia (SAA) is a rare and potentially fatal
using proteomics techniques, highlighting their potential role disease characterized by pancytopenia and bone marrow
in disease pathogenesis. In the present study, the expression of (BM) hypoplasia (1). Patients frequently experience symptoms
LILRA1‑6 mRNA was assessed in the BM mononuclear cells such as anemia, bleeding and infection, leading to a signifi‑
of patients with SAA using reverse transcription‑quantitative cant decrease in quality of life and eventually death (2). The
(RT‑q)PCR. The expression of homogenic LILRA3 and abnormal activation and hyperfunction of hyper‑activated
LILRA5 isoform on mDCs, as well as CD34 +, CD3+CD8+, effector T lymphocytes are the major immune mechanisms
CD19+ and CD14+ cells, was detected using flow cytometry. in the pathogenesis of primary acquired SAA (3,4). However,
mDCs were then induced, cultured and sorted. The expression the etiology and pathogenesis of SAA have remained to be
of LILRA3 was confirmed using RT‑qPCR and western blot fully elucidated. Previous research by our group has indi‑
analyses. The serum levels of soluble LILRA3 were measured cated that SAA is caused by an unknown antigen substance
using ELISA. Furthermore, the relationship between LILRA3 activating dendritic cells, which increase the number and
expression and disease severity was assessed. The results function of myeloid dendritic cells (mDCs), resulting in the
indicated increased LILRA3 mRNA expression in patients hyperfunction of cytotoxic T lymphocyte (CTL) and T helper
with SAA. The percentage of LILRA3+ in BM mDCs and type 1 (Th1) cells. This causes the release of numerous negative
CD34 + cells was increased. Compared with controls, the hematopoietic regulatory factors. The regulatory T cells and
relative LILRA3 mRNA expression and the relative protein natural killer (NK) cells that induce immune tolerance are
intensity were highly increased in SAA mDCs. The serum consequently severely insufficient and damage hematopoietic
LILRA3 levels in patients with SAA were also increased. target cells, leading to hematopoietic failure (5,6). In the
The proportion of LILRA3 + CD11C+ human leukocyte previous study, mDCs proteomes were investigated using
antigen (HLA)‑DR+/CD11C+HLA‑DR+ cells was positively mass spectrometry and the CD34+ cells using isobaric tags for
correlated with the ratio of LILRA3+CD34+/CD34+ cells and relative and absolute quantification (iTRAQ) labeling and a
the expression of LILRA3 mRNA. Taken together, the expres‑ combination of multidimensional liquid chromatography and
sion of LILRA3 on mDCs of patients with SAA was increased, tandem mass spectrometry (7). In comparison with healthy
controls, the expression of leukocyte immunoglobulin‑like
receptors eukocyte immunoglobulin-like receptor A3
(LILRA3) in mDCs and LILRA5 in CD34+ cells were signifi‑
cantly increased.
Correspondence to: Dr Rong Fu or Dr Zonghong Shao, LILRs are members of the immunoglobulin superfamily
Department of Hematology, Tianjin Medical University General that are mainly expressed on antigen‑presenting cells (APCs).
Hospital, 154 Anshan Street, Heping, Tianjin 300052, P.R. China
The genes are located on chromosome 19q13.4 (8,9). They are
E‑mail: florai@sina.com
E‑mail: shaozonghongtjzyy@163.com
divided into immunosuppressive receptor LILRs (LILRB1‑5)
and immunoreactive receptor LILRs (LILRA1‑6) according
*
Contributed equally to the cytoplasmic structures and transmembrane regions (10).
After binding to major histocompatibility complex I (MHC‑I)
Key words: severe aplastic anemia, myeloid dendritic cells, ligand, it changes the autoimmune‑mediated tissue damage
proteomics, leukocyte immunoglobulin‑like receptor A3 threshold and regulates the immune responses through the
inhibition or activation of cytolysis. MHC‑I molecules are
widely expressed on hematopoietic cells of all lineages. When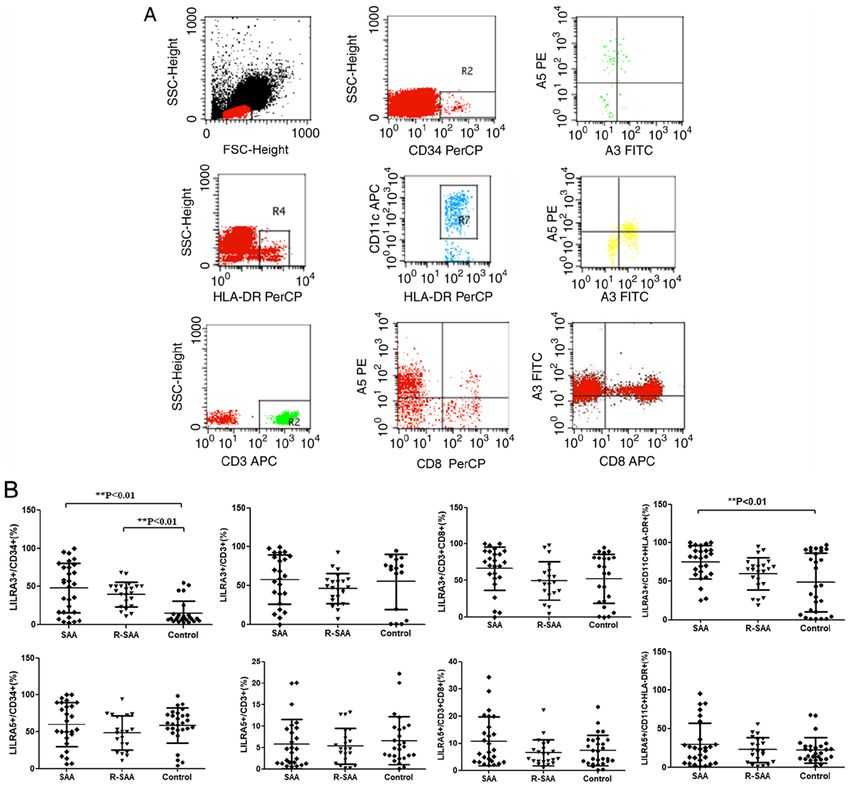
2                                 YU et al: LILRA3 IN PATIENTS WITH SEVERE APLASTIC ANEMIA

the intracellular protein fragment‑short antigen peptide is         (cat. no. 10015‑HNAH; Sino Biological) and 40 ng/ml rhIL‑4.
presented by CTL, the LILRA‑MHC‑I interaction effectively           The culture conditions were 37˚C and 5% CO 2. Media
stimulates T‑cell proliferation and secretes inflammatory           and cytokines were changed every two days. On day 6,
factors (11). Enhancing CTL lysis clears target cells expressing    rhTNF‑α (1,000 µg/ml) was added to mature the mDCs for
autoantigens, making the LILR a novel target for regulating         24 h. Suspended mature mDCs in the culture supernatant
CTL‑mediated autoimmune diseases (12,13). LILRs are                 were then collected on day 7. The collected cells were
associated with autoimmune diseases, malignancies and               stained with PerCP‑conjugated human leukocyte antigen
infections (14,15). However, little is currently known about        (HLA)‑DR (cat. no. 347364) and APC‑conjugated CD11c
the potential role of LILRA genes in patients with SAA. The         monoclonal antibody (cat. no. 340544; all, BD Biosciences).
present study aimed to analyze the expression of LILRAs in          HLA‑DR+ CD11c+ cells were sorted and collected using a
patients with SAA and investigate its role in the pathogenesis      FACS Aria flow cytometer (BD Biosciences).
of SAA by determining its impact on patient‑derived mDCs
and targeted BM CD34+ cells.                                        Reverse transcription‑quantitative (RT‑q)PCR. The mRNA
                                                                    expression of LILRA was analyzed using RT‑qPCR. BMMNCs
Materials and methods                                               of patients with SAA and controls were lysed using TRIzol
                                                                    reagent. RNA was reverse transcribed using the complemen‑
Patients. A total of 48 patients with SAA that were admitted        tary (c)DNA Synthesis Kit (Tiangen). qPCR was performed
to the Hematology Department of Tianjin Medical University          on the BIORAD iQ5 system (Bio‑Rad Laboratories, Inc.).
General Hospital (Tianjin, China) between June 2015 and             GAPDH was used as a housekeeping gene for standardizing
April 2017 were enrolled. Of these, 26 were newly diagnosed,        targeted mRNA expression. A total of 1 µl of each cDNA
untreated patients with SAA (12 males, 14 females) with a           working solution was used with a final volume of 25 µl,
median age of 28 years (range, 7‑69 years). The other 22 patients   which contained 12.5 µl SYBR green solution and 0.75 µl of
were remission‑treated patients with SAA (14 males, 8 females)      upstream and downstream primers (concentration, 10 µM).
with a median age of 31 years (range, 11‑65 years). Patients in     PCR reaction conditions were as follows: LILRA1‑6: 95˚C for
remission were those who improved after immunosuppressive           30 sec, the indicated annealing temperature for 45 sec, 72˚C
therapy (IST, including antithymocyte globulin, cyclosporine        for 30 sec, 45 cycles. The indicated annealing temperature and
and glucocorticoid). All the patients in remission had achieved     primer sequences are listed in Table II. The relative expres‑
bone marrow hematopoietic recovery and had been separated           sion level of the gene of interest was calculated using the
from the infusion of blood products, while some had normal          2‑ΔΔCq method (19).
peripheral blood cell counts but still required drug therapy.
All subjects met the diagnostic criteria (16,17). Patients were     Flow cytometric (FCM) analysis. For phenotype analysis,
excluded if they had complications such as iron overload,           fresh heparinized BM samples were stained with anti‑human
malignancy or other autoimmune diseases or if they were             LILRA3‑FITC (cat. no. IC2574G), LILRA5‑PE mono‑
pregnant. The patients' clinical characteristics are provided in    clonal antibody (mAb; cat. no. FAB6754P; both from
Table I.                                                            R&D Systems), CD34‑PerCP (cat. no. 340430), CD3‑APC/
    All patients received immunosuppressive therapy that            PerCP (cat. no. 340440 or 347344), CD8‑APC/PerCP
included rabbit anti‑thymocyte globulin, cyclosporin and            (cat. no. 340584 or 347314), CD19‑APC (cat. no. 340437),
hematopoietic stimulating factor treatment consisting of            CD14‑PE/FITC mAb (cat. no. 347497 or 347493), CD11c‑APC
erythropoietin, granulocyte colony stimulating factor, throm‑       (cat. no. 340544) and HLA‑DR‑PerCP mAb (cat. no. 347364;
bopoietin and interleukin IL‑11. Treatment efficacy was              all from BD Biosciences). The staining was performed
evaluated based on the Camitta standard (18).                       according to the manufacturer's protocol. The ratios of intra‑
    The healthy controls (13 males and 15 females) included         cytoplasmic LILRA3+ CD11c+HLA‑DR+/CD11c+HLA‑DR+,
had a median age of 28 years (range, 24‑55 years). The present      L I L R A 3 + C D 3 4 + / C D 3 4 +, L I L R A 3 + C D 3 + C D 8 + /
study was approved by the Ethics Committee of Tianjin               CD3 + CD8 +, LILRA3 + CD19 + /CD19 +, LILRA3 + CD14 + /
Medical University (Tianjin, China). Written informed consent       CD14 +, LI LR A5 + CD11c + H LA‑DR+ /CD11c + H LA‑DR+,
was obtained from all study subjects.                               LILRA5+ CD34 +/CD34 +, LILRA5+ CD3+ CD8+/CD3+ CD8+,
                                                                    LI LR A 5 + CD19 + /CD19 + a nd LI LR A 5 + CD14 + /CD14 +
Culture, identification and sorting of mDCs. BM mononuclear         cells were analyzed on a FACS Calibur flow cytometer
cells (BMMNCs) were extracted from patients with SAA and            (BD Biosciences) and CellQuest software version 3.1 software
healthy controls using lymphocyte separation fluid (Solarbio        (BD Biosciences).
Science & Technology) using density gradient centrifugation.
BMMNCs of each subject were plated separately at a density          Western blot analysis. The mDCs of the subjects from the SAA,
of 2x10 6 cells/ml in RPMI‑1640 (Gibco; Thermo Fisher               R‑SAA and healthy control groups were collected and lysed in
Scientific, Inc.) complete medium containing 10% fetal bovine       RIPA buffer supplemented with PMSF. The protein concen‑
serum (Gibco; Thermo Fisher Scientific, Inc.) and 1% mycillin       tration was measured using a BCA kit. The loading volume
and incubated for 2 h at 37˚C in an atmosphere containing           per sample was 40 µg protein. The proteins were separated
5% CO2. Non‑adherent cells were removed. The remaining              on 10% SDS‑PAGE (Beijing Solarbio Science & Technology
cells were cultured in RPMI‑1640 complete medium containing         Co., Ltd.) and transferred to a nitrocellulose membrane.
10% fetal bovine serum, 1% mycillin, 100 ng/ml Recombinant          The membrane was blocked with 10% skimmed milk
Human Granulocyte‑Macrophage Colony Stimulating Factor              (BD Biosciences; cat. no. 232100 for 1 h at room temperature.
EXPERIMENTAL AND THERAPEUTIC MEDICINE 21: 346, 2021 3
Table I. Clinical characteristics of the patients. and 100 µl PBS was added for fluorescence detection on the
flow cytometer (BD Biosciences; FACSCanto II). This was
Item Untreated SAA (n=26) R‑SAA (n=22) performed according to the manufacturer's instructions.
Age (years) 28 (7‑69) 31 (11‑65) Statistical analysis. Statistical analyses were performed
ANC (x109/l) 0.58±0.38 3.01±1.76 using SPSS 22.0 software (IBM Corp.). Data analyses were
Hb (g/l) 58.14±23.32 127.19±38.64 performed with GraphPad Prism 5.0 software (GraphPad
PLT (x109/l) 18.31±11.62 118.84±70.31 Software, Inc.). The normality of the distribution was proven
Ret% 0.41±0.29 2.89±1.97 using a Kolmogorov‑Smirnov test. The mean ± standard
Therapy Not previously IST deviation was used to represent normally distributed data.
treated except for Comparisons between two independent samples were
performed using the t‑test. The rank‑sum test was used to
transfusions
analyze data with a non‑normal distribution and the median
Duration (months) 2 (1‑3) 30 (7‑109)
and interquartile range were used to represent the data. Age
Values are expressed as the mean ± standard deviation or median and duration values are mid (min, max). For correlation tests,
(range). Age and duration values are mid (min, max). R‑SAA, Spearman's rank correlation was used. P0.05), LILRA2 (1.255±1.114 vs. 1.113±1.083 vs.
According to the manufacturer's protocols, the samples were 1.714±1.437; P>0.05), LILRA4 (1.808±1.751 vs. 1.625±1.588
measured and read with a BioTek ELx800 microplate reader vs. 1.213±1.124; P>0.05) and LILRA6 (2.111±2.018 vs.
(BioTek Corp.) at a wavelength of 450 nm. 1.813±1.357 vs. 1.371±1.302; P>0.05) were not significantly
different between patients with SAA and the R‑SAA and
Cytokine detection. A cytokine detection kit (Human controls (Fig. 1).
Th1/Th2 subsets detection kit) was used for this analysis
(cat. no. P010001; Saijishengwu). The venous blood samples Increased frequency of LILRA3 on BM mDCs in patients
were collected in EDTA anticoagulation tubes and centri‑ with SAA. The percentage of LILRA3 and LILRA5 on CD34+
fuged at 1,000 x g for 20 min for later use. Standards were cells, CD3+ cells, CD8+ cells and CD11C+ HLA‑DR+ cells from
configured with the following concentrations: 10, 20, 40, 80, 48 patients with SAA and 28 healthy controls was analyzed by
156, 312, 625, 1,250, 2,500 and 5,000 pg/ml. The captured FCM (Fig. 2A). The fraction of intracytoplasmic LILRA3+ cells
microsphere mixture was centrifuged at 200 x g for 5 min at among mDCs of untreated patients with SAA (73.11±22.54%)
room temperature. The supernatant was aspirated, the same was significantly higher than that of the controls (48.64±38.03%;
volume of microsphere buffer as the aspirated supernatant P0.05; Fig. 2B). The proportion of LILRA5+ cells
of the solution was added to each experimental tube and the among mDCs, the relative expression of LILRA5 mRNA and
sample was vortexed. A total of 25 µl of standard product the relative intensity of LILRA5 in BM mDCs were not signifi‑
and 25 µl of the sample to be tested was added in the same cantly different between patients with SAA and healthy controls
sample tube. Subsequently, 25 µl of the fluorescence detection (P>0.05; Fig. 2B). mDCs were isolated from the BM of patients
reagent was added to each experimental tube and samples with SAA and healthy controls, and the purity of sorted mDCs
were thoroughly mixed and incubated at room temperature was >90% (Fig. 3A). The results further suggested that the rela‑
for 25 min in the dark. Finally, 1 ml PBS was added to each tive expression of LILRA3 mRNA in BM mDCs of untreated
experimental tube, which was then centrifuged at 200 x g for patients with SAA (1.792±1.301) was higher than that of the
5 min at room temperature. The supernatant was aspirated controls (0.773±0.721; P4 YU et al: LILRA3 IN PATIENTS WITH SEVERE APLASTIC ANEMIA
Table II. Sequences of PCR primers and The indicated annealing temperature.
Gene Sequence (5' to 3') Annealing temperature (˚C)
LILRA1 Forward: 5'‑CCTCGGGATTCTGCTATTTG‑3' 62.0
Reverse: 5'‑AAGGCTCCACCACTCTGAAG‑3
LILRA2 Forward: 5'‑TGGGGACCTACAGATGCTACA‑3' 55.5
Reverse: 5'‑CTTGTTTTGTGATGGGCTGA‑3'
LILRA3 Forward: 5'‑CAGCCCACCACAAAACAAG‑3' 61.5
Reverse: 5'‑CTTCAAATGTCCACCCAGGA‑3'
LILRA4 Forward: 5'‑AGGAGGCAAACAGCAGAAAG‑3' 62.0
Reverse: 5'‑CAGCAGACACTTCCCCAACT‑3'
LILRA5 Forward: 5'‑TCTGACTGAGGAAGGAGACCA‑3' 57.0
Reverse: 5'‑CCATAGCATCTGAGCATCCA‑3'
LILRA6 Forward: 5'‑ACCTGCTGTCTTTCCCCAGT‑3' 60.0
Reverse: 5'‑TGTGTAATCCTTGGCGTGTG‑3'
GAPDH Forward: 5'‑TTCCACCCATGGCAAATTCC‑3'
Reverse: 5'‑AGGCCATGCCAGTGAGCTTC‑3'
LILRA, leukocyte immunoglobulin‑like receptors A.
Figure 1. LILRA mRNA expressions in patients with SAA. LILRA mRNA expression was measured using reverse transcription‑quantitative PCR. Values
are expressed as the mean ± standard deviation. Relative mRNA expression levels of (A) LILRA1, (B) LILRA2, (C) LILRA3, (D) LILRA4, (E) LILRA5 and
(F) LILRA6. LILRA, leukocyte immunoglobulin‑like receptors A; R‑SAA, remission‑treated severe aplastic anemia.
the relative intensity of LILRA3 protein in mDCs of the untreated patients with SAA (39.86±19.46%) had increased percentages
SAA group was significantly increased (PEXPERIMENTAL AND THERAPEUTIC MEDICINE 21: 346, 2021 5
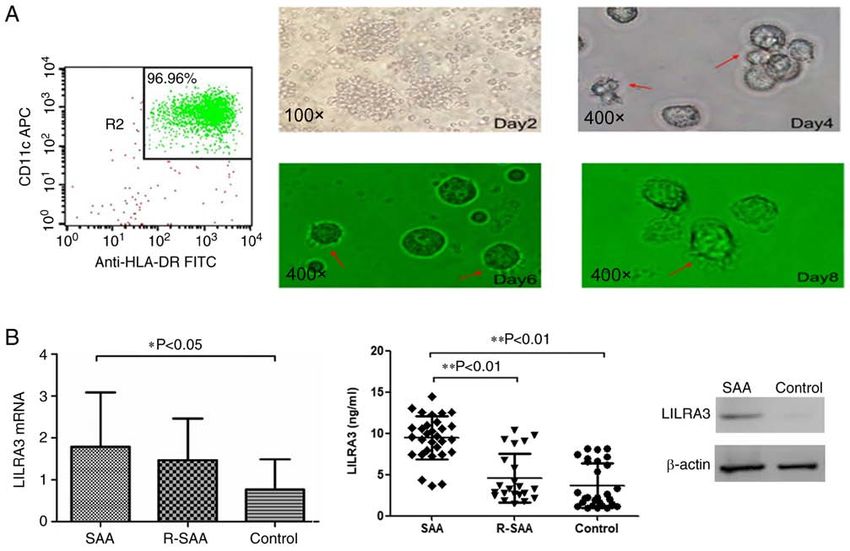
Figure 2. Expression of LILRA3 and LILRA5 on CD34 + cells, CD3+ cells, CD8+ cells and CD11C+ HLA‑DR+ cells. (A) Expression assessed using flow
cytometry. (B) LILRA3 and LILRA5 expression on CD34+, CD3+, CD8+ and CD11C+ HLA‑DR+ cells in patients with SAA and normal controls. LILRA,
leukocyte immunoglobulin‑like receptors A; R‑SAA, remission‑treated severe aplastic anemia; PLT, platelets; HB, hemoglobin; HLA, human leukocyte
antigen; SSC, side scatter.
percentages of LILRA3+ and LILRA5+ cells among the determine whether the frequency of LILRA3 may identify a
CD14+, CD19+ and CD8+ lymphocytes in patients with SAA pathogenically distinct subset of patients with SAA or whether
were not different compared with those of the healthy controls it simply reflects disease activity, clinical indices and evidence
(P>0.05; data not shown). of disease activity in BM were compared with the expression
of LILRA3.
Increased serum LILRA3 levels in patients with SAA. In the SAA group, there were positive correlations
Patients with SAA had increased serum levels of LILRA3 in between the proportion of LILRA3 + CD11C+HLA‑DR+ /
comparison with those of the controls. The serum LILRA3 CD11C+HLA‑DR+ cells and the ratio of LILRA3+CD34+/CD34+,
levels of untreated patients with SAA (9.466±2.629 ng/ml) the expression of LILRA3 mRNA (r=0.330 and 0.344, respec‑
were significantly higher than those of the remission patients tively; P6 YU et al: LILRA3 IN PATIENTS WITH SEVERE APLASTIC ANEMIA
Figure 3. Verification of the mDC phenotype and expression of LILRA3. (A) Analysis of mDCs using flow cytometry (day 7) and microscopy (arrow indicates
gradually maturing dendritic cells). (B) Relative expression of LILRA3 mRNA in mDCs determined using reverse transcription‑quantitative PCR (left).
LILRA3 in serum was measured using ELISA (middle). The relative expression of LILRA3 in mDCs determined using western blot analysis (right). LILRA,
leukocyte immunoglobulin‑like receptors A; mDCs, myeloid dendritic cells; HLA, human leukocyte antigen; R‑SAA, remission‑treated severe aplastic
anemia.
patients with SAA were positively correlated. There was no secretion of cytokines such as IFN‑γ and IL‑2, which promote
significant correlation between LILRA3 mRNA levels and CD8+ CTLs in patients with SAA (26). Thus, it may be inferred
serum cytokine IL‑4 (r=0.356, P>0.05) or IL‑10 (r=0.411, that the pathogenesis of SAA is associated with improved
P>0.05) in untreated patients with SAA (Fig. 4B). function and increased number of mDCs.
Although the understanding of the immune pathogenesis
Discussion of SAA gradually improved over numerous years of research,
the specific antigens, mDCs and T cells involved remained
The present study was the first to indicate an alteration of BM unclear. Previous studies by our group have elucidated
LILRAs in patients with SAA. SAA is a type of BM failure that the immune cascade activation of SAA is closely relevant
mediated by abnormal cellular immunity. To date, the etiology to the upregulation and hyperfunction of mDCs, which may
and pathogenesis of SAA have remained to be fully elucidated. be the initiating factor resulting in the activation of subsequent
Previous studies by our group have confirmed that various immune responses. Liu et al (6) detected changes in protein
immune cells and cytokines constitute an abnormal immune components of BM mDCs in the SAA group by two‑dimen‑
status in patients with SAA (20,21), including the involve‑ sional electrophoresis analysis. Compared with normal
ment of Th1/Th2 subset imbalances, hyperfunctional CTLs, controls, the expression of LILRA3 in mDCs of patients with
insufficiencies in the regulatory T and NK cell populations and SAA increased. Coincidentally, Qi et al (7) also reported on
negative hematopoietic cytokines (22,23). These subsequently the alterations in protein expression levels of BM CD34+ cells
induce excessive apoptosis of CD34+ HSCs and inhibit hema‑ in the SAA group determined by iTRAQ analysis. Compared
topoietic colony formation through the perforin, granzyme B, with that in healthy participants, the expression of LILRA5 in
Fas/FasL and the TNF‑related apoptosis‑inducing ligand path‑ CD34+ cells of patients with SAA also increased.
ways (13). Furthermore, an in‑depth study of its pathogenic LILRs are a family of immune‑modulatory proteins
mechanism suggested that both the numbers and function of that are localized on human chromosome 19 in the region
mDCs were significantly increased in the peripheral blood 19q13.4 (9), principally expressed on NK, myeloid, T and
from individuals with SAA (5,6,24). mDCs secrete IL‑12, a B cells. Receptors on LILRs modulate the maturation of
major stimulator, which induces the differentiation of naive DCs and affect the antigen that presents DC functions, thus
CD4 + T cells into the Th1 phenotype (25). Th1 cells were regulating T‑cell proliferation. LILRs are progressively known
reported to be overly activated subsequent to the excessive as the critical regulators of innate immune responses that actEXPERIMENTAL AND THERAPEUTIC MEDICINE 21: 346, 2021 7 Figure 4. (A) LILRA3 expression was closely associated with the clinical characteristics of patients with SAA. (B) Correlations of LILRA3 mRNA with cytokines TNF‑α, IFN‑γ, IL‑4 and IL‑10 in patients with untreated severe aplastic anemia. LILRA, leukocyte immunoglobulin‑like receptors A. through the threshold modulation and amplitude of lymphoid in patients with rheumatoid arthritis (28), systemic lupus and myelomonocytic cell activation (27). LILRA3 is a soluble erythematosus (29) and Sjögren's syndrome (30), and positively molecule belonging to a household of highly homologous cell correlated with disease activity and severity. In the present surface receptors, principally expressed through mono‑myeloid study, the expression of LILRAs in patients with SAA was cells (9). LILRA3 is unique as such that it lacks cytoplasmic investigated. LILRA3 mRNA expression was increased in and transmembrane domains, and thus, is an exclusively BMMNCs of patients with SAA, whereas others (LILRA1, secreted protein. MHC class I molecules and Nogo 66 are ‑2, ‑4 and ‑6) were not significantly different. Compared with candidates for high‑affinity binding with LILRA3 ligands. The healthy controls, the results verified that the percentage of intra‑ functions of LILRA3 remain to be fully elucidated. However, cytoplasmic LILRA3+ on CD11C+HLA‑DR+ mDCs, the relative studies suggested that it may act as a significant function in intensity of LILRA3 protein in mDCs and the expression of the pathogenesis of autoimmune disorders. Serum LILRA3 LILRA3 mRNA in mDCs were markedly enhanced in patients protein levels are significantly increased and are one of the with SAA. Simultaneously, the percentages of intracytoplasmic strongest independent markers of disease severity in multiple LILRA3+ in CD34+ cells were also augmented, which posi‑ sclerosis. Serum IL‑10 and IFN‑γ are positively correlated with tively correlated with its expression in mDCs. These results LILRA3 levels and negatively associated with serum TNF‑α suggested that LILRA3 was abnormally present upstream and LILRA3 in patients with multiple sclerosis (12). Serum of SAA in mDCs and that there was an abnormal expression LILRA3 concentrations are also significantly upregulated of downstream targets in CD34 + cells. The present results
8                                 YU et al: LILRA3 IN PATIENTS WITH SEVERE APLASTIC ANEMIA

suggested that the expression of LILRA3 was increased in           YS and JT contributed to the experiments and the collection
patients with SAA and that this was positively correlated with     of patients' features. All authors read and approved the final
disease progression, activity and response to therapy.             manuscript.
    The expression of LILRA3 mRNA was higher in patients
with new SAA and remission SAA in comparison with the              Ethics approval and consent to participate
control group, but there were no differences between new SAA
and remission SAA. Although the expression of LILRA3 in            The study was in compliance with the Declaration of Helsinki
remission SAA was not significantly different from that of         and was approved by the Ethics Committee of Tianjin Medical
untreated SAA, the expression of LILRA3 on mDCs of patients        University General Hospital (Tianjin, China). Written informed
with remission SAA was lower than that in the untreated SAA        consent was obtained from all participants.
group. The reason may be that compared with the normal
control group, the cytokine storm period in the remission SAA      Patient consent for publication
group was not over, but it was smaller than that in the patients
with untreated SAA. No statistically significant difference in     Not applicable.
the expression of LILRA3 was obtained between SAA patients
with short‑term remission (≤12 months) and long‑term remis‑        Competing interests
sion (>12 months). A significant risk of relapse was reported
with rapid tapering of cyclosporine in patients with remission     The authors declare that they have no competing interests.
SAA and the treatment should be continued for a long time
until the immunoreaction is completely back to normal (20).        References
LILRA3 upregulated the transcription of IL‑1A, IL‑1B and
IL‑6 and modulated the expression of co‑stimulatory mole‑           1. Young NS: Aplastic anemia. N Engl J Med 379: 1643‑1656, 2018.
cules and MHC in B‑cells and monocytes. Signaling via LILRs         2. Young NS: The etiology of acquired aplastic anemia. Rev Clin
                                                                       Exp Hematol 4: 236‑259, 2000.
affects the maturation and activation of DCs, maintains the         3. Miano M and Dufour C: The diagnosis and treatment of aplastic
antigen‑presenting properties of DCs and regulates immune              anemia: A review. Int J Hematol 101: 527‑535, 2015.
responses (27,30,31). Thus, it may be possible that LILRA3          4. Zeng Y and Katsanis E: The complex pathophysiology of acquired
                                                                       aplastic anaemia. Clin Exp Immunol 180: 361‑370, 2015.
is involved in the CTLs‑mediated autoimmune pathogenesis            5. Zonghong S, Meifeng T, Huaquan W, Limin X, Jun W, Rong F,
of SAA and antagonizing LILRA3 may be a novel strategy                 Hong L and Yuhong W: Circulating myeloid dendritic cells
for addressing disease prevention and progression. However,            are increased in individuals with severe aplastic anemia. Int J
                                                                       Hematol 93: 156‑162, 2011.
the present results provide insight into several hypotheses         6. Liu C, Sheng W, Fu R, Wang H, Li L, Liu H and Shao Z:
about the pathogenesis of SAA. Future studies delineating the          Differential expression of the proteome of myeloid dendritic
exact mechanisms of LILRA3 in the pathogenesis of SAA are              cells in severe aplastic anemia. Cell Immunol 285: 141‑148,
                                                                       2013.
warranted.                                                          7. Qi W, Fu R, Wang H, Liu C, Ren Y, Shao Y and Shao Z:
    In conclusion, the present results suggested that LILRA3           Comparative proteomic analysis of CD34(+) cells in bone
was highly expressed and positively correlated with disease            marrow between severe aplastic anemia and normal control. Cell
                                                                       Immunol 304‑305: 9‑15, 2016.
progression in the mDCs and CD34+ cells of patients with            8. Norman PJ, Carey BS, Stephens HAF and Vaughan RW:
SAA. Taken together, the present results indicate that LILRA3          DNA sequence variation and molecular genotyping of natural
is an important participant in the pathogenesis of SAA and a           killer leukocyte immunoglobulin‑like receptor, LILRA3.
                                                                       Immunogenetics 55: 165‑171, 2003.
potential therapeutic target.                                       9. Brown D, Trowsdale J and Allen R: The LILR family: Modulators
                                                                       of innate and adaptive immune pathways in health and disease.
Acknowledgements                                                       Tissue Antigens 64: 215‑225, 2004.
                                                                   10. Hirayasu K and Arase H: Functional and genetic diversity of
                                                                       leukocyte immunoglobulin‑like receptor and implication for
Not applicable.                                                        disease associations. J Hum Genet 60: 703‑708, 2015.
                                                                   11. Jones DC, Kosmoliaptsis V, Apps R, Lapaque N, Smith I, Kono A,
                                                                       Chang C, Boyle LH, Taylor CJ, Trowsdale J and Allen RL: HLA
Funding                                                                class I allelic sequence and conformation regulate leukocyte
                                                                       Ig‑like receptor binding. J Immunol 186: 2990‑2997, 2011.
This work was supported by the National Natural Science            12. An H, Lim C, Guillemin GJ, Vollmer‑Conna U, Rawlinson W,
                                                                       Bryant K and Tedla N: Serum leukocyte immunoglobulin‑like
Foundation of China (grant nos. 81970116, 81970115, 81870101           receptor A3 (LILRA3) is increased in patients with multiple
and 81500101) and the Tianjin Municipal Natural Science                sclerosis and is a strong independent indicator of disease severity;
Foundation (grant nos. 18JCYBJC91700 and 18ZXDBSY00140).               6.7kbp LILRA3 gene deletion is not associated with diseases
                                                                       susceptibility. PLoS One 11: e0149200, 2016.
                                                                   13. Low HZ, Ahrenstorf G, Pommerenke C, Habermann N,
Availability of data and materials                                     Schughart K, Ordóñez D, Stripecke R, Wilk E and Witte T: TLR8
                                                                       regulation of LILRA3 in monocytes is abrogated in human
                                                                       immunodeficiency virus infection and correlates to CD4 counts
Not applicable.                                                        and virus loads. Retrovirology 13: 15, 2016.
                                                                   14. Sugahara‑Tobinai A, Inui M, Metoki T, Watanabe Y, Onuma R,
Authors' contributions                                                 Takai T and Kumaki S: Augmented ILT3/LILRB4 expression of
                                                                       peripheral blood antibody secreting cells in the acute phase of
                                                                       kawasaki disease. Pediatr Infect Dis J 38: 431‑438, 2019.
RF and ZS designed the study and revised the manuscript. HY,       15. Debebe BJ, Boelen L, Lee JC; IAVI Protocol C Investigators,
HL and YZ performed experiments, analyzed data and wrote               Sanders EJ, Anzala O, Kamali A, Kaleebu P, Karita E,
                                                                       Kilembe W, et al: Identifying the immune interactions underlying
the initial draft of the manuscript. HW, WQ, CL, ZL, SG,               HLA class I disease associations. Elife 9: e54558, 2020.
EXPERIMENTAL AND THERAPEUTIC MEDICINE 21: 346, 2021 9
16. Camitta BM, Storb R and Thomas ED: Aplastic anemia (second 26. Qi W, Yan L, Liu C, Fu R, Wang H and Shao Z: Abnormal histone
of two parts): Pathogenesis, diagnosis, treatment, and prognosis. acetylation of CD8+ T cells in patients with severe aplastic
N Engl J Med 306: 712‑718, 1982. anemia. Int J Hematol 104: 540‑547, 2016.
17. Camitta BM, Storb R and Thomas ED: Aplastic anemia (first of 27. Park JE, Brand DD, Rosloniec EF, Yi AK, Stuart JM, Kang AH
two parts): Pathogenesis, diagnosis, treatment, and prognosis. N and Myers LK: Leukocyte‑associated immunoglobulin‑like
Engl J Med 306: 645‑652, 1982. receptor 1 inhibits T‑cell signaling by decreasing protein
18. Di Bona E, Rodeghiero F, Bruno B, Gabbas A, Foa P, Locasciulli A, phosphorylation in the T‑cell signaling pathway. J Biol Chem 295:
Rosanelli C, Camba L, Saracco P, Lippi A, et al: Rabbit anti‑ 2239‑2247, 2020.
thymocyte globulin (r‑ATG) plus cyclosporine and granulocyte 28. An H, Chandra V, Piraino B, Borges L, Geczy C, McNeil HP,
colony stimulating factor is an effective treatment for aplastic Bryant K and Tedla N: Soluble LILRA3, a potential natural anti‑
anaemia patients unresponsive to a first course of intensive immu‑ inflammatory protein, is increased in patients with rheumatoid
nosuppressive therapy. Gruppo italiano trapianto di midollo osseo arthritis and is tightly regulated by interleukin 10, tumor necrosis
(GITMO). Br J Haematol 107: 330‑334, 1999. factor‑alpha, and interferon‑gamma. J Rheumatol 37: 1596‑1606,
19. Livak KJ and Schmittgen TD: Analysis of relative gene expres‑ 2010.
sion data using real‑time quantitative PCR and the 2(‑Delta Delta 29. Du Y, Sun F, Zhou M, Wu X, Sun W, Jiang Y, Cheng Q, Chen X,
C(T)) method. Method 25: 402‑408, 2001. Wu H and Xue J: The expression and clinical significance of
20. Liu C and Shao Z: Aplastic anemia in China. J Transl Int Med 6: different forms of LILRA3 in systemic lupus erythematosus.
134‑137, 2018. Clin Rheumatol 38: 3099‑3107, 2019.
21. Liu C, Sun Y and Shao Z: Current concepts of the pathogenesis 30. Low HZ, Reuter S, Topperwien M, Dankenbrink N, Peest D,
of aplastic anemia. Curr Pharm Des 25: 236‑241, 2019. Kabalak G, Stripecke R, Schmidt RE, Matthias T and Witte T:
22. Chen T, Zhang T, Liu C, Wang C, Ding S, Shao Z and Fu R: Association of the LILRA3 deletion with B‑NHL and functional
NK cells suppress CD8+ T cell immunity via NKG2D in severe characterization of the immunostimulatory molecule. PLoS
aplastic anemia. Cell Immunol 335: 6‑14, 2019. One 8: e81360, 2013.
23. Liu B, Shao Y, Liu Z, Liu C, Zhang T and Fu R: Bone marrow 31. Nezos A, Evangelopoulos ME and Mavragani CP: Genetic
plasma cytokine signature profiles in severe aplastic anemia. contributors and soluble mediators in prediction of autoimmune
Biomed Res Int 2020: 8789275, 2020. comorbidity. J Autoimmun 104: 102317, 2019.
24. Liu C, Zheng M, Wang T, Jiang H, Fu R, Wang H, Ding K,
Zhou Q and Shao Z: PKM2 is required to activate myeloid This work is licensed under a Creative Commons
dendritic cells from patients with severe aplastic anemia. Oxid Attribution-NonCommercial-NoDerivatives 4.0
Med Cell Longev 2018: 1364165, 2018. International (CC BY-NC-ND 4.0) License.
25. Steinbrink K, Mahnke K, Grabbe S, Enk AH and Jonuleit H:
Myeloid dendritic cell: From sentinel of immunity to key player
of peripheral tolerance. Hum Immunol 70: 289‑293, 2009.You can also read