Environmental impacts of COVID-19 on Victoria, Australia, witnessed two waves of Coronavirus
←
→
Page content transcription
If your browser does not render page correctly, please read the page content below
Environmental Science and Pollution Research
https://doi.org/10.1007/s11356-021-12556-y

    SHORT RESEARCH AND DISCUSSION ARTICLE

Environmental impacts of COVID-19 on Victoria, Australia, witnessed
two waves of Coronavirus
Mahdi Boroujeni 1 & Mohammad Saberian 1 & Jie Li 1

Received: 30 November 2020 / Accepted: 14 January 2021
# The Author(s), under exclusive licence to Springer-Verlag GmbH, DE part of Springer Nature 2021

Abstract
The COVID-19 pandemic not only has created a global health crisis but also has dramatic effects on the environment. To fight the
spread of Coronavirus, governments imposed social distancing policies, which caused negative and positive impacts on the
environment. Victoria, the second-most populated state in Australia, was hit by two waves of COVID-19. During the second
wave of the pandemic, Victoria, especially Melbourne, experienced one of the most stringent and longest lockdowns globally. In
this study, the changes in mobility trends, traffic, air pollution, noise pollution, and waste generation during the first and second
waves of COVID-19 in Victoria are evaluated and compared. It was observed that the pandemic had both positive and negative
impacts on the environment. During the second wave of the pandemic in Victoria, the mobility trends of public transport hubs,
retail and recreation venues, and workplaces experienced a significant drop in movements at respective values of 85%, 83%, and
76% compared to the period of 5 weeks from 3 January to 6 February 2020. PM2.5 levels were lower by 23% at Alphington and
24% at Footscray from 16 March to 1 May 2020 compared with the average PM2.5 levels in the past 4 years. It was estimated that
the respective daily generations of used face masks during the first wave and second wave of the pandemic in Victoria were
approximately 104 and 160 tons.

Keywords COVID-19 . Pandemic . Environmental impacts . Waste generation . Victoria . Melbourne

Introduction                                                                 in nitrogen dioxide concentrations and PM 2.5 levels were
                                                                             observed in major cities of China because of the shutdown
The new Coronavirus (SARS-CoV2) has caused many prob-                        of some industrial facilities and power plants, the curfew,
lems around the world and impacted almost all countries. The                 and strong social distancing measures (Jiang et al., 2021).
virus has spread to more than 83.9 million people and caused                 Similarly, it has been reported that air pollution has signifi-
about 1.8 million deaths (WHO, 2020). Currently, several                     cantly reduced in Europe (Giani et al., 2020). According to
countries are dealing with the second or third wave of the virus             UNCTAD (2020), the global Coronavirus lockdown led to a
with far worse effects than the first wave.                                  5% decrease in greenhouse gas emissions in the first half of
   The COVID-19 pandemic has also affected the environ-                      2020 compared to the same period in 2019. Liu et al. (2020)
ment directly and indirectly. For example, because of the so-                reported that global CO2 emissions reduced by approximately
cial distancing and curfew policies, it has been predicted that              8.8% for the same period.
the greenhouse gas emissions could reduce to levels never                       Although the pandemic has had some indirect and short-
before been observed since the Second World War                              term positive environmental impacts, it caused more severe
(Zambrano-Monserrate et al., 2020). Considerable reductions                  adverse effects on solid waste management and plastic pro-
                                                                             duction. Unfortunately, the COVID-19 pandemic has hit the
                                                                             municipal solid waste management in many countries
Responsible Editor: Lotfi Aleya
                                                                             (Daryabeigi Zand and Vaezi Heir, 2020). For instance, due
                                                                             to the concerns about the spread of the virus, some states in
* Mohammad Saberian
  mohammad.boroujeni@rmit.edu.au                                             the USA temporarily closed recycling centres, suspended
                                                                             curbside recycling pickup, and onboard recyclables collec-
1
                                                                             tions (Staub, 2020). Similarly, in some European countries,
     School of Engineering, RMIT University, Melbourne, Victoria,
     Australia
                                                                             the sorting of household wastes has been prohibited. To fight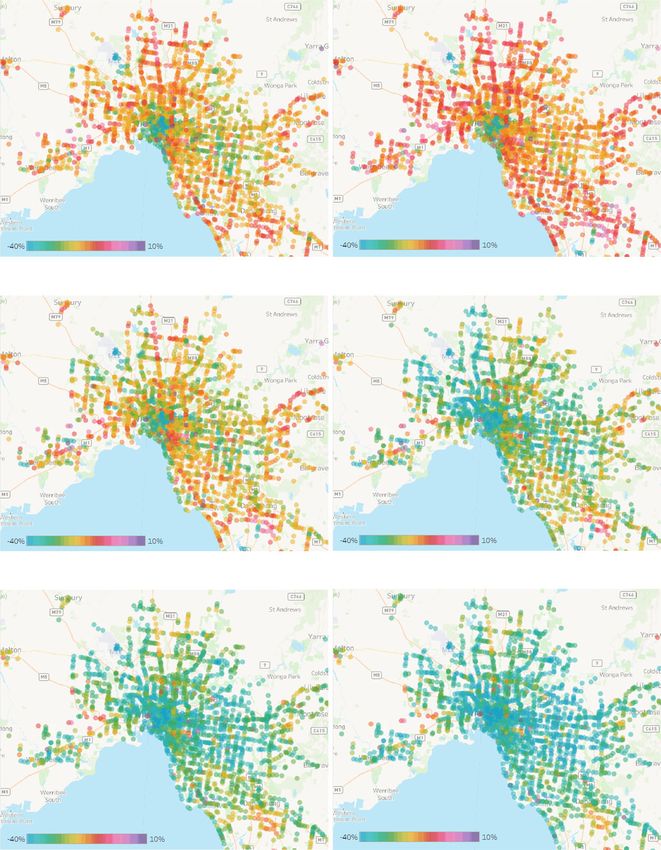
Environ Sci Pollut Res

the spread of the virus, a huge surge in demand for plastic-                was 10 times harder than the first wave, could last for
based products has been observed, and some policies on plas-                more than 5 months. In total, 20,345 confirmed cases
tic production and plastic bag bans have been suspended. This               and 819 deaths were reported in Victoria by 27 October
is simply because of (1) the demand for personal protective                 2020. By the end of the second wave, the number of
equipment (PPE) in the healthcare system and community, (2)                 confirmed COVID-19 cases in Victoria constitutes about
the recommended or mandatory face mask use policies around                  74% of the total number of confirmed cases in Australia,
the world, and (3) the generation of typical packaging plastic              while approximately 90% of the total deaths in Australia
waste because of the significant increase in online shopping                occurred in Victoria (Australian Government Department
and home delivery services (Sharma et al., 2020). Moreover,                 of Health, 2020).
the COVID-19 pandemic has caused huge pressure on the                           During the second wave of COVID-19, strict social dis-
landfills in developing countries, where solid waste materials              tancing measures and curfew policies were applied by the
and hazardous wastes are dumped in poorly managed and                       Victorian Government. In early July, during the stage 3 re-
open landfills, which can pose health and environmental                     strictions, the residents were allowed to leave their homes for
threats (Rowan and Laffey, 2020).                                           only four reasons, including medical care or caregiving, daily
    Victoria is the most densely populated state in Australia,              exercise, work or school, or purchasing food and supplies.
with a population of over 6.68 million. Melbourne, the capital              The face-covering rule became mandatory on 22 July. Due
of the State of Victora, is the second-most populated city in               to the surge in the number of confirmed cases, more strict rules
Australia, having a population of more than 5 million. Similar              were introduced in Victoria from the beginning of August
to highly populated and large states and provinces around the               until the end of October. The rules included curfew from
world, the state of Victoria has not been excluded from the                 8 pm to 5 am, leaving home for shopping within 5 km from
impacts of Coronavirus; however, Australia is among one                     home, 1-hour limitation of exercise per day within 5 km,
the most successful countries in managing and controlling                   schools returned to remote learning, public transport services
the COVID-19 pandemic. The first case of the novel                          reduced, closing of many stores, shops, and retails, etc. The
Coronavirus was confirmed in Victoria on 25 January                         curfew and most of the strict rules were lifted after cases of
2020. Then, the first wave of infections in Victoria                        Coronavirus were eliminated on 27 October 2020. One hun-
emerged during the period of early March 2020 to the                        dred eleven days of lockdown ranks among the toughest in the
mid of May (Fig. 1). Victoria’s second wave of the                          world. However, some rules, such as the mandatory face mask
COVID-19 spread was mainly caused by the hotel quar-                        use in the whole of Victoria, are still in place. Consequently,
antine scandal in Melbourne. Thanks to the efforts of the                   all of the rules and strict policies during the lockdowns had
state’s government and the Australian government, and                       effects on the environment of Victoria, primarily the metro-
endless efforts of healthcare workers as well as the coop-                  politan Melbourne.
eration and patience of people, the Victorians can now                          Previous studies mainly focused on health issues directly
beat the spread of the virus before the situation gets out                  related to the SARS-CoV2 Coronavirus. Little attention has
of control. It is worth to mention that the first restrictions              been directed to the pandemic’s influence on the environment.
came on 13 March 2020, and on 16 March, new rules                           This paper discusses the negative and positive indirect impacts
came into effect and a state of emergency was declared                      of COVID-19 on the environment of the State of Victoria,
by the Victorian Government. The second wave, which                         Australia.

Fig. 1 Daily new Coronavirus                                         800
cases in Victoria from the                                                 New cases
                                                                     700
beginning of the pandemic to the
end of the second wave (from the                                           14-day average
                                               New confirmed cases

                                                                     600
Department of Health and Human
Services, 2021)                                                      500

                                                                     400

                                                                     300

                                                                     200

                                                                     100

                                                                       0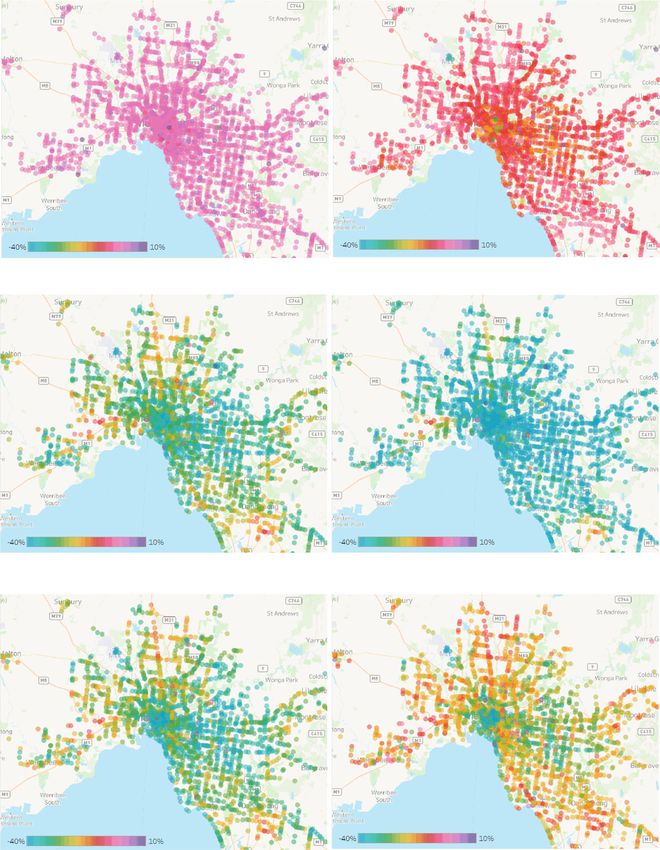
Environ Sci Pollut Res

Indirect impacts of COVID-19                                       February 2020. Also, higher reductions in the mobility trends
on the environment of the State of Victoria                        were observed during the second lockdown compared to the
                                                                   first one (Katestone, 2020a). In Melbourne City, residential
Mobility trends and traffic                                        was the only category that experienced an increase during the
                                                                   pandemic (Google, 2020). The mobility trends for retail and
Figure 2 demonstrates the changes in the mobility trends in        recreation venues, public transport hubs, workplaces, super-
Victoria and Melbourne City. It can be seen that the mobility      markets and pharmacies, and parks dropped significantly from
trends changed significantly compared to the period before the     the beginning of the first wave to the end of the first wave.
Coronavirus outbreak in Victoria due to the strict rules during    However, the mobility trends experienced a mild increase be-
the stage 4 Coronavirus lockdown restrictions in Victoria.         tween the end of the first wave to the beginning of the second
Besides, the mobility trends for retail and recreation venues,     wave. This is mainly because of easing some restrictions be-
public transport hubs, and workplaces dramatically reduced,        tween the first and second lockdown periods. During the sec-
which could be related to the enforced restricting rules, mainly   ond lockdown period, mobility trends decreased slightly and
working from homes, staying within 5 km from homes, and            remained relatively constant.
closing of the shops, stores, and retails.                             During the lockdowns and because of the social distancing
   Compared to the mobility trends in the State of Victoria,       restrictions, peak-hour gridlocks in the most common
more significant changes in the mobility trends were observed      congested areas of Victoria have disappeared. Figure 3 shows
in Melbourne City. For instance, from 11 September to 23           the traffic volume change in Melbourne during the pandemic.
October 2020, public transport hubs, retail and recreation         The traffic in Melbourne dropped significantly during the
venues, and workplaces witnessed a considerable reduction          lockdowns compared to the first 2 weeks of March 2020
in movements at 85%, 83%, and 76%, respectively, compared          (Charting Transport, 2020). An easing of some restrictions
to the baseline, which is the average value of the same day of     after the first wave resulted in an increase in the traffic volume
the week for the period of 5 weeks from 3 January to 6             during 25–31 May and the whole of June. A relatively larger

Fig. 2 Mobility changes in a the
state of Victoria from 11
September to 23 October 2020
and b Melbourne City from 7
February 2020 to 23 October
2020 compared with the baseline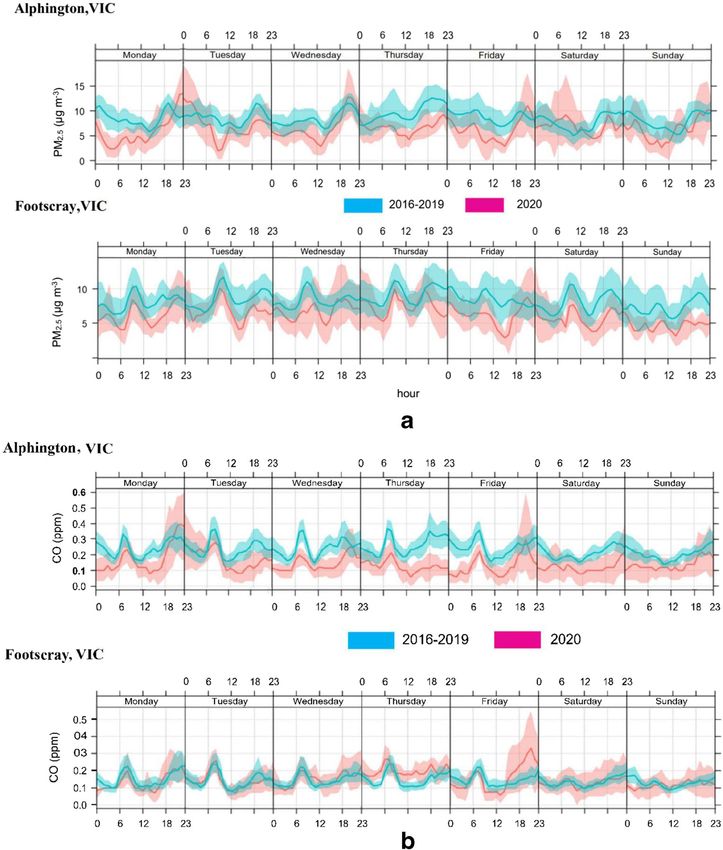
Environ Sci Pollut Res

                                          2-8 March                                      16-22 March

                                          23-29 March                                     6-12 April

                                         18-24 May                                        25-31 May
Fig. 3 Traffic change in Melbourne during the pandemic compared to the first 2 weeks of March 2020 (Charting Transport, 2020)

reduction of the traffic volume occurred during the second                corresponding period in the past 4 years (2016–2019). On
wave period than the first wave period.                                   average, PM2.5 levels were observed to be lower by 23% at
                                                                          Alphington and 24% at Footscray for 2020 compared with the
Air pollution                                                             average PM2.5 levels in the past 4 years. A comparison of the
                                                                          average CO levels revealed that a 39% reduction occurred at
Air quality affects human health or comfort, but more than                Alphington (Katestone, 2020b,c). In Seoul, Korea, PM2.5
90% of the world population lives in poor air quality areas.              showed a considerable drop of 36% in March 2020 compared
When solid particles, liquids, or gases in the air are sufficient         to the same time of 2017–2019 (Seo et al. 2020). A decrease
to cause damage to the environment or adversely impact hu-                of 20.6% in PM2.5 levels in the USA was also observed in
man health, air pollution occurs (Zhang et al., 2017). Salt               March 2020 relative to March 2019. Moreover, pollution con-
spray, wind-blown dust, bushfires, industrial activities, and             centrations reduced by 12.5% for CO and 15.4% for PM2.5 in
exhaust from motor vehicles are the main reasons of air pol-              China from January to March 2020 compared to the same
lutions. Poor air pollution is responsible for about 8% of the            period in 2019 (Liu et al., 2020). A reduction of 28% to
total deaths in the world (Zambrano-Monserrate et al., 2020).             31% for PM10 was reported by Tobias et al. (2020) in
    Figure 4 shows diurnal profiles of PM2.5 and CO at two                Barcelona, Spain, during the March lockdown.
sites of Alphington and Footscray in Melbourne and compares                  On the other hand, it is worthy of evaluating the effects of
the measurements from 16 March to 1 May 2020 with the                     stage 4 lockdown restrictions in Victoria (started from the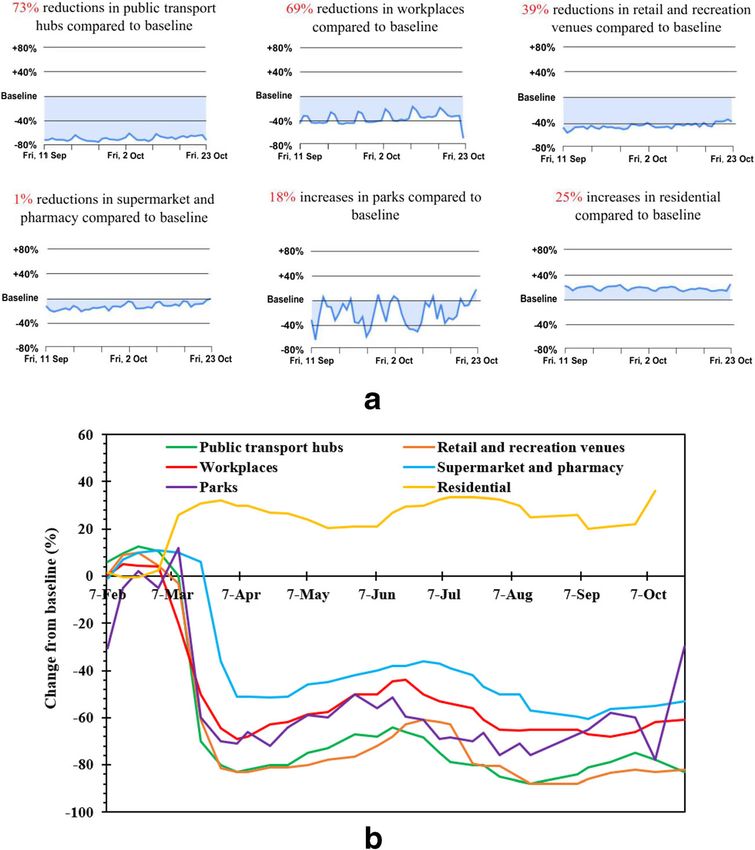
Environ Sci Pollut Res

                                      1-7 June                                    22-28 June

                                       29 June - 5 July                            6-12 July

                                      13-19 July                                   20-26 July
Fig. 3 (continued)

beginning of August 2020) on the air pollution levels. Figure 5    (Singh and Chauhan, 2020). Bauwens et al. (2020) reported a
compares the monthly average NO2 concentrations at two             considerable decrease of 20–38% of NO2 in western Europe.
sites of Footscray and Alphington in 2020 compared to the          During June 2020, the NO2 concentrations returned almost to
monthly average NO2 concentrations in the past 10 years            the average levels, while the NO2 concentrations witnessed an
(2010–2019). As can be seen from the figure, from March to         increase in July 2020 compared to the average levels. This is
April 2020, during the first lockdown, a considerable decrease     simply because of the easing of some restrictions after the first
in NO2 concentrations was observed at both sites compared to       wave of the pandemic. Due to more strict restrictions, the
the monthly average NO2 concentrations in the past 10 years.       concentrations of NO2 during the second lockdown reduced
This can be attributed to the significant drop in the mobility     significantly compared to the first lockdown and previous
trends and traffic volumes from March to April 2020, mainly        years. For instance, in early August 2020, the concentrations
because of the restrictions imposed during the first wave. In      of NO 2 reduced by 31% and 38% at Footscray and
fact, the reduction of fossil fuel combustion and industry emis-   Alphington, respectively, compared to July 2020.
sions resulted in a decrease in nitrogen dioxide (NO2) emis-
sions. A similar decrease of NO2 was reported for the USA          Noise pollution
(14.32%) and China (4.53%) in March 2020 compared to
March 2019 (Liu et al., 2020). A decrease in tropospheric          Environmental noise, which is an unwanted sound, generally
NO2 was also observed in Delhi, India, during the pandemic         generates from industrial, commercial, and construction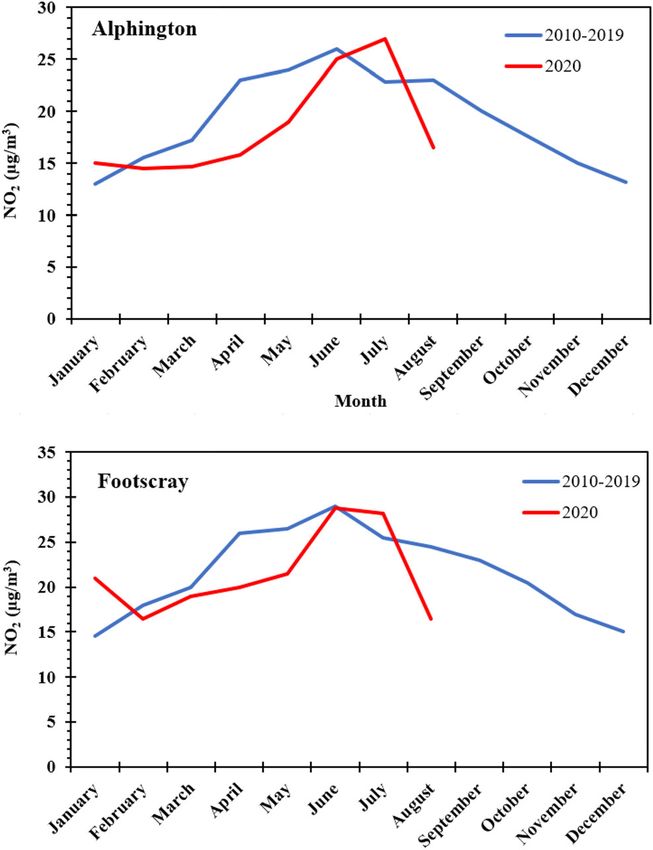
Environ Sci Pollut Res

Fig. 4 The concentrations of a
PM2.5 and b CO in Melbourne
from 16 March to 1 May 2020
compared with the corresponding
period in the past 4 years (2016–
2019)

activities, and traffics. Environmental noise pollution may in-   factories. These changes resulted in a further dropping of en-
crease the risk of many diseases and change the ecosystem’s       vironmental noise levels in Victoria and metropolitan
conditions (Zagubień and Wolniewicz 2021). Lecocq et al.          Melbourne during the second lockdown period compared to
(2020) reported that the COVID-19 restrictions led to signif-     the first lockdown period.
icant changes in human activities, which resulted in the lon-
gest and most prominent global anthropogenic seismic noise        Waste generation
reduction in recorded history and caused a 50% drop in global
median high-frequency seismic ambient noise from March to         The COVID-19 pandemic has caused not only health-related
May 2020.                                                         issues such as mental health problems, job and economy
   During the lockdowns in Victoria, imposing the strict so-      losses, and socio-economic hardships but also waste manage-
cial distancing measures and curfew policies enforced people      ment issues in many countries (Acter et al., 2020; Zandifar
to leave their homes for shopping within specific ranges,         and Badrfam, 2020). It has put immense pressure on the
returned students to remote learning, and obliged many people     existing waste collection and management system and caused
to work from home. Compared to the first lockdown period,         inappropriate waste management strategies such as local burn-
tougher restrictions during the second lockdown led to a re-      ings, mobile incinerations, and direct landfills (Adyel, 2020).
duction in some public transport services, decreasing the traf-   For instance, Singapore households generated extra 1334 tons
fic levels, and closure of many retail stores, restaurants, and   of plastic waste in April 2020, which can be attributed to the
Environ Sci Pollut Res
management issues of the generation of plastic-based PPE
caused by the COVID-19 pandemic (Klemeš et al., 2020).
Wearing a face mask was not mandated in Victoria during
the first lockdown but became mandatory on 22 July 2020
(during the second wave of the virus). There is no exact data
on the number of face masks used in Victoria. Thus, it is
worthy of using the following model proposed by
Nzediegwu and Chang (2020) and Sangkham (2020) to esti-
mate the daily face mask use in Victoria, DFM.
F MGP
DFM ¼ P U P F MAR ð10;000 ) (1)where P is the pop-
ulation of Victoria, which is about 6,689,400 (Australian
Bureau of Statistics, 2020); UP is the urban population in
Victoria, which is about 80%; FMAR is the face masks accep-
tance rate, which is considered 65% during the first lockdown
and 100% during the second lockdown in Victoria; and FMGP
is an assumption that how many masks are used by a person in
the general population each day, which is considered 1 in this
study. Therefore, by using Eq. (1) and the assumptions men-
tioned above, the daily face mask use in Victoria during the
first lockdown and second lockdown can be estimated at
3,478,488 and 5,351,520, respectively. Taking the average
weight of a mask as 30 g, which is the weight of a surgical
mask (lowest weight among other masks), it is estimated that
about 104 and 160 tonnes of used face masks were generated
each day during the first and second wave of the Coronavirus
Fig. 5 The monthly average NO 2 concentrations at two sites in
Melbourne in 2020 compared to the monthly average NO 2 in Victoria, respectively.
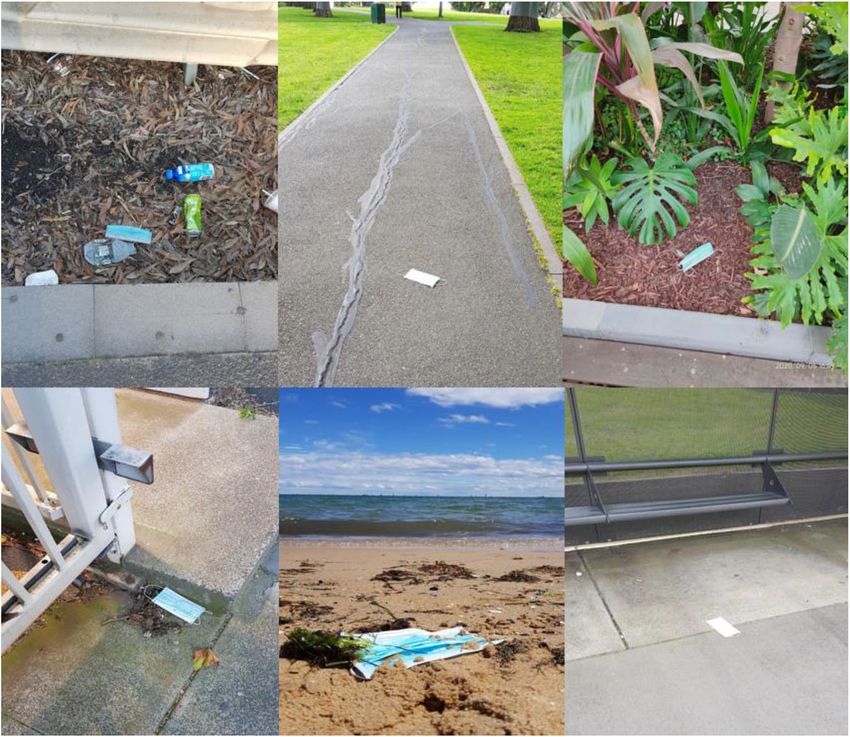
concentrations in the past 10 years As shown in Fig. 6, the used face masks can be spotted
everywhere from parks to streets to beaches due to an uptick in
littering. Even if they are disposed at a landfill, wind and
change in consumer behaviour during the COVID-19 pan-
rainwater can blow or move the lightweight masks into rivers
demic. (Fan et al., 2021). During the first lockdown, the City
and oceans, and the non-biodegradable plastic-based masks
of Melbourne reported a 70% increase in illegally dumped
will be fragmented into microplastics (Prata et al., 2020).
waste in April 2020, compared with the same period in 2019
(Farrer, 2020). This could be related to the rise in home im-
provements and renovations, packing waste from shopping
online, dumping of unwanted possessions, and used PPE such Discussion
as gloves and masks.
Although single-use plastic products are banned in many A comparison of the traffic and air quality data before and
countries, there is a setback in using and management of plas- during the lockdowns revealed that the lockdowns improved
tics in the fight with the Coronavirus pandemic (Naughton, air quality in Victoria substantially since there were far fewer
2020). Using PPE is among one of the effective announced vehicles on the roads during the lockdowns. The reduction in
guidelines for reducing the spread of the Coronavirus, which air pollution can also be attributed to declining industrial/
resulted in mandatory face mask use in more than half of the construction activities and significantly decreasing interna-
countries around the world or recommended face mask use in tional flights due to the border closures. Compared to the first
almost all of the countries (Royo-Bordonada et al., 2020). lockdown, mobility trends and air pollutants reduced consid-
Consequently, huge amounts of plastic-based PPE, such as erably during the second lockdown because of more strict
masks, gloves, waterproof shoes, protective clothing, face restrictions. The reasons mentioned above also contributed
shields, and hand sanitizer bottles and packaging made with to a substantial reduction of environmental noise pollutions
polypropylene and polyethylene terephthalate are produced in Victoria and metropolitan Melbourne. It can be seen from
around the world every day. The improper management of the results that after easing of restrictions, mobility trends, air
plastic-based PPE waste can potentially increase the spread pollution, and traffic shifted to a typical situation before the
of the virus (Mol and Caldas, 2020). Therefore, to avoid the lockdowns within 1–2 month(s). For instance, during July and
further spread of the virus, it is crucial to consider the waste August in Melbourne, the air pollution experienced aEnviron Sci Pollut Res
Fig. 6 Discarded used face masks
in public spaces in Victoria during
the COVID-19 pandemic
considerable increase even higher than before the pandemic. Conclusions and recommendations
Therefore, when the pandemic ends, the lockdown-induced
positive environmental effects will disappear in a relatively Based on the comparative study results of the current work, it
short period. Traffic congestion and air pollution will return can be concluded that the COVID-19 pandemic can cause
to “business as usual”. One possible way to reduce traffic for short-term positive impacts on the environment, but the neg-
the post-COVID-19 pandemic future is to allow more people ative effects are more severe. For example, many countries,
to work from home after the Covid-19 crisis. including Australia, are facing challenges in the waste man-
The social distancing restrictions can lead to higher munic- agement of used PPE which are made of non-biodegradable
ipal solid waste generations, as observed in Melbourne, due to plastics that can take hundreds of years to break down in the
increased home renovations, packing waste related to online environment. According to the estimations of the current
shopping, and single-use plastic-based items. Furthermore, to study, about 104 and 160 tons of used face masks were gen-
control the spread of the virus, a mandated or recommended erated daily during the first and second wave of the pandemic
face mask use policy results in the generation of huge amounts in Victoria. A noticeable decrease of 85%, 83%, and 76% was
of PPE such as masks and gloves. The improper management observed for the respective mobility trends of public transport
of the plastic-based waste results in plastic pollutions and hubs, retail and recreation venues, and workplaces during a
microplastics that cause many environmental issues, such as period of the second wave of the pandemic in Victoria com-
killing animals and marine life (Fadare and Okoffo, 2020). It pared to the period of 5 weeks from 3 January to 6 February
is worth to mention that despite the suspended recycling pro- 2020 (i.e. before the pandemic). Also, PM2.5 levels were
grams in several countries around the world, due to the lower by 23% at Alphington and 24% at Footscray from 16
COVID-19, the planned and ongoing recycling programs in March to 1 May 2020 compared with the average PM2.5
Australia and especially in Victoria have not been stopped. levels in the past 4 years. But decreasing air pollution, traffic,
Victorian government and EPA Victoria declared that the fa- and noise pollution during lockdowns are not sustainable
cilities of waste and recycling industries remain open during ways to improve and clean the environment. More important-
the pandemic, and the industries and councils need to continue ly, as was observed in the case of Victoria, which experienced
to provide waste services to the public (EPA Victoria, 2020). the second wave of the pandemic, the positive environmentalEnviron Sci Pollut Res
impacts related to COVID-19 can be vanished in a short peri- Competing interests The authors declare that they have no conflict of
interest.
od after easing of restrictions. Moreover, similar to the much
worse situation of the second wave compared to the first wave
in terms of the number of cases in most countries, the negative
environmental effects of a given wave of the COVID-19 can
References
be harsher and more long-standing than its previous wave.
Acter T, Uddin N, Das J, Akhter A, Choudhury TR, Kim S (2020)
Therefore, all countries need to pay attention to the impacts Evolution of severe acute respiratory syndrome coronavirus 2
of the pandemic on the environment as it can cause more and (SARS-CoV-2) as coronavirus disease 2019 (COVID-19) pandem-
long-lasting environmental problems. ic: a global health emergency. Sci Total Environ 730:138996
A cross-disciplinary collaborative approach is urgently re- Australian Bureau of Statistics, (2020). National, state and territory pop-
ulation. https://www.abs.gov.au/statistics/people/population/
quired to address the current environmental issues caused by national-state-and-territory-population/latest-release. Accessed
the indirect negative impacts of the COVID-19 pandemic. date: 30 October 2020.
There is a need to reduce the dependency on single-use PPE Australian Government Department of Health, (2020). Coronavirus
and reduce pandemic-generated waste. Repurposing the used (COVID-19) at a glance infographic collection. https://www.
health.gov.au/resources/collections/coronavirus-covid-19-at-a-
PPE is an effective way to prevent a large amount of pandem- glance-infographic-collection. Accessed date: 05 January 2021.
ic-generated waste from ending up in the landfill. The Adyel TM (2020) Accumulation of plastic waste during COVID-19.
authors have already done a feasibility study of using Science 369(6509):1314–1315 Accessed date: 14 November 2020.
the shredded face mask with recycled concrete aggregate Bauwens, M., Compernolle, S., Stavrakou, T., Muller, J.F., van Gent, J.,
as a road pavement material (Saberian et al. 2021). The Eskes, H., Levelt, P.F., Van Der, A.R., Veefkind, J.P., Vlietinck, J.,
Yu, H., Zehner, C., (2020). Impact of coronavirus outbreak on NO2
results show that building a two-lane 1-km-long road pollution assessed using TROPOMI and OMI observations.
would require approximately 3 million used face masks Geophys Res Lett, 47, e2020GL087978.
that would otherwise go to landfill. The feasibility study Charting Transport, (2020). What impact has the 2020 COVID-19 pan-
also found that introducing the used masks to the recycled demic had on road traffic volumes in Victoria? https://
chartingtransport.com/category/road-traffic/.
concrete aggregate can improve the strength, ductility,
Daryabeigi Zand A, Vaezi Heir A (2020) Emerging challenges in urban
and flexibility of pavements base/subbase. To keep air waste management in Tehran, Iran during the COVID-19 pandemic.
and noise pollution at low levels, local governments and Resour Conserv Recycl 162:105051
policymakers should implement emissions and vehicle ef- Department of Health and Human Services, (2021). Victorian coronavi-
ficiency standards, encouraging consumers to use electric rus (COVID-19) data. https://www.dhhs.vic.gov.au/victorian-
coronavirus-covid-19-data. Accessed date: 05 January 2020.
vehicles that produce no carbon dioxide emissions and Fadare OO, Okoffo ED (2020) Covid-19 face masks: a potential source of
less noise compared to conventional vehicles. microplastic fibers in the environment. Sci Total Environ 737:
This paper presents preliminary findings based on the lim- 140279
ited data available. More studies, particularly a large-scale Fan YV, Jiang P, Hemzal M, Klemeš JJ (2021) An update of COVID-19
influence on waste management. Sci Total Environ 754:142014
national or cross-national (regional/international) assessment,
Farrer, M., (2020). Australian councils struggle with huge rise in house-
are required to fully understand the impact of the COVID-19 hold rubbish during Covid-19 lockdown. The Guardian. https://
pandemic on the environment. www.theguardian.com/australia-news/2020/jun/03/australian-
councils-struggle-with-huge-rise-in-household-rubbish-during-
Acknowledgements The authors gratefully acknowledge the help of ex- covid-19-lockdown. Accessed date: 05 January 2021.
perts at Katestone. Giani P, Castruccio S, Anav A, Howard D, Hu W, Crippa P (2020) Short-
term and long-term health impacts of air pollution reductions from
Authors’ contributions Mahdi Boroujeni: methodology, validation, in- COVID-19 lockdowns in China and Europe: a modelling study.
vestigation, writing—original draft, data curation, formal analysis, visu- Lancet Planetary Health 4(10):e474–e482
alization. Mohammad Saberian: methodology, validation, investigation, Google, (2020). COVID-19 community mobility report. AU Victoria
writing—original draft, data curation, formal analysis, visualization. Jie Mobility Report. https://www.gstatic.com/covid19/mobility/2020-
Li: writing—review and editing, supervision, resources, validation, su- 10-23_AU_Victoria_Mobility_Report_en-GB.pdf. Accessed date:
pervision, project administration, conceptualization. All authors contrib- 14 November 2020.
uted to the research article and approved the final version. Jiang P, Fu X, Fan YV, Klemeš JJ, Chen P, Ma S, Zhang W (2021)
Spatial-temporal potential exposure risk analytics and urban sustain-
ability impacts related to COVID-19 mitigation: a perspective from
Data availability Not applicable.
car mobility behaviour. J Clean Prod 279:123673
Katestone, (2020a). A Second Wave? An update on the Australian Air
Compliance with ethical standardsEthical approval Quality after COVID-19 mobility restriction measures. https://
Not applicable. katestone.global/air-quality-covid-19-update3/. Accessed date: 05
January 2021.
Consent to participate Not applicable. Katestone, (2020b). CO, PM2.5 and NO2: which air pollutant best illus-
trates the effect of COVID-19 mobility restrictions on air quality.
Consent to publish Not applicable. https://katestone.global/air-quality-covid-19-update2/. Accessed
date: 05 January 2021.Environ Sci Pollut Res
Katestone, (2020c). Update on the Australian Air Quality after the imple- Sangkham S (2020) Face mask and medical waste disposal during the
mentation of the COVID-19 mobility restrictions. https://katestone. novel COVID-19 pandemic in asia. Case Stud Chem Environ Eng 2:
global/air-quality-covid-19-update1/. . 100052
Klemeš JJ, Fan YV, Tan RR, Jiang P (2020) Minimising the present and Sharma HB, Vanapalli KR, Cheela VRS, Ranjan VP, Jaglan AK, Dubey
future plastic waste, energy and environmental footprints related to B, Goel S, Bhattacharya J (2020) Challenges, opportunities, and
COVID-19. Renew Sust Energ Rev 127:109883 innovations for effective solid waste management during and post
Lecocq T, Hicks SP, Noten KV et al (2020) Global quieting of high- COVID-19 pandemic. Resour Conserv Recycl 162:105052
frequency seismic noise due to COVID-19 pandemic lockdown Seo JH, Jeon HW, Sung UJ, Sohn JR (2020) Impact of the COVID-19
measures. Science 369(6509):1338–1343 outbreak on air quality in Korea. Atmosphere 11:1137
Liu Z, Ciais P, Deng Z, Lei R, Davis SJ, Feng S, Zheng B, Cui D, Dou X, Singh RP, Chauhan A (2020) Impact of lockdown on air quality in India
Zhu B, Guo R, Ke P, Sun T, Lu C, He P, Wang Y, Yue X, Wang Y, during COVID-19 pandemic. Air Qual Atmos Health 13:921–928
Lei Y, Zhou H, Cai Z, Wu Y, Guo R, Han T, Xue J, Boucher O, Staub, C., (2020). Coronavirus pandemic disrupts recycling sector.
Boucher E, Chevallier F, Tanaka K, Wei Y, Zhong H, Kang C, Resour Recycl https://resource-recycling.com/recycling/2020/03/
Zhang N, Chen B, Xi F, Liu M, Bréon FM, Lu Y, Zhang Q, Guan 17/coronavirus-pandemic-disrupts-recycling-sector/. Accessed
D, Gong P, Kammen DM, He K, Schellnhuber HJ (2020) Near-real- date: 05 January 2021.
time monitoring of global CO2 emissions reveals the effects of the
Tobias A, Carnerero C, Reche C, Massagué J, Via M, Minguillon MC,
COVID-19 pandemic. Nat Commun 11:5172
Alastuey A, Querol X (2020) Changes in air quality during the
Mol MPG, Caldas S (2020) Can the human coronavirus epidemic also
lockdown in Barcelona (Spain) one month into the SARS-CoV-2
spread through solid waste? Waste Manag Res 38(5):485–486
epidemic. Sci Total Environ 726:138540
Naughton CC (2020) Will the COVID-19 pandemic change waste gen-
eration and composition?: the need for more real-time waste man- UNCTAD, (2020). COVID-19 stalls progress on Global Goals. https://
agement data and systems thinking. Resour Conserv Recycl 162: unctad.org/news/covid-19-stalls-progress-global-goals. .
105050 WHO, (2020). https://www.who.int/emergencies/diseases/novel-
Nzediegwu C, Chang SX (2020) Improper solid waste management in- coronavirus-2019. .
creases potential for COVID-19 spread in developing countries. Zagubień A, Wolniewicz K (2021) Impact of measuring microphone
Resour Conserv Recycl 161:104947 location on the result of environmental noise assessment. Appl
Prata JC, Patrício Silva AL, Walker TR, Duarte AC, Rocha Santos T Acoust 172:107662
(2020) COVID-19 pandemic repercussions on the use and manage- Zambrano-Monserrate MA, Ruano MA, Sanchez-Alcalde L (2020)
ment of plastics. Environ Sci Technol 54(13):7760–7765 Indirect effects of COVID-19 on the environment. Sci Total
Rowan NJ, Laffey JG (2020) Unlocking the surge in demand for personal Environ 728:138813
and protective equipment (PPE) and improvised face coverings aris- Zandifar A, Badrfam R (2020) Iranian mental health during the COVID-
ing from coronavirus disease (COVID-19) pandemic – implications 19 epidemic. Asian J Psychiatr 51:101990
for efficacy, re-use and sustainable waste management. Sci Total Zhang Q, Jiang X, Tong D, Davis SJ, Zhao H, Geng G, Ni R (2017)
Environ 752:142259 Transboundary health impacts of transported global air pollution
Royo-Bordonada, M.A., García-López, F.J., Cortés, F., Andrés Zaragoza, and international trade. Nature 543:705–709
G., (2020). Face masks in the general healthy population. Scientific
and ethical issuesMascarillas en población general sana Cuestiones
Publisher’s note Springer Nature remains neutral with regard to jurisdic-
científicas y éticas Gaceta Sanitaria, 1-5.
tional claims in published maps and institutional affiliations.
Saberian M, Li J, Kilmartin-Lynch S, Boroujeni M (2021) Repurposing
of COVID-19 single-use face masks for pavements base/subbase.
Sci Total EnvironYou can also read