Pier Francesco Guarguaglini Chairman and CEO Alessandro Pansa Co-General Manager / CFO - Finmeccanica Full Year 2010 Results Presentation
←
→
Page content transcription
If your browser does not render page correctly, please read the page content below
Finmeccanica Full Year 2010
Results Presentation

Pier Francesco Guarguaglini
Chairman and CEO

Alessandro Pansa
Co-General Manager / CFO

London 3 March 2011

                              1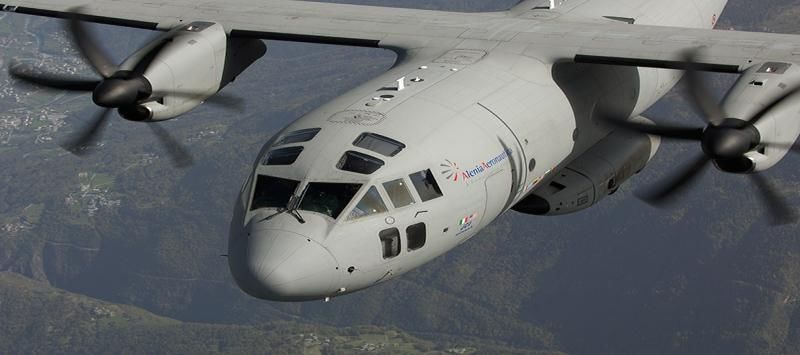
Safe Harbor Statement

NOTE: Some of the statements included in this document are not historical facts but rather statements of
future expectations, also related to future economic and financial performance, to be considered forward-
looking statements. These forward-looking statements are based on Company’s views and assumptions as
of the date of the statements and involve known and unknown risks and uncertainties that could cause
actual results, performance or events to differ materially from those expressed or implied in such
statements. Given these uncertainties, you should not rely on forward-looking statements.

The following factors could affect our forward-looking statements: the ability to obtain or the timing of
obtaining future government awards; the availability of government funding and customer requirements both
domestically and internationally; changes in government or customer priorities due to programme reviews
or revisions to strategic objectives (including changes in priorities to respond to terrorist threats or to
improve homeland security); difficulties in developing and producing operationally advanced technology
systems; the competitive environment; economic business and political conditions domestically and
internationally; programme performance and the timing of contract payments; the timing and customer
acceptance of product deliveries and launches; our ability to achieve or realise savings for our customers or
ourselves through our global cost-cutting programme and other financial management programmes; and
the outcome of contingencies (including completion of any acquisitions and divestitures, litigation and
environmental remediation efforts).

These are only some of the numerous factors that may affect the forward-looking statements contained in
this document.

                                                                                                                2
Contents

     2010 Highlights & 2011 Outlook
     Pier Francesco Guarguaglini

     Financial & Business Review
     Alessandro Pansa

     Business Strategy
     Pier Francesco Guarguaglini

     Appendix

                                      3
2010 Highlights & 2011 Outlook
Pier Francesco Guarguaglini

                                 4
2010 Highlights: Strong Set of Results
In Line or Above our Guidance

• Orders exceeded guidance despite tough pricing competition in growth markets
• FOCF guidance exceeded due to efficient working capital and investment management
• Revenues and Ebita Adj. at the high end of the guidance
• Streamlining the business
   – Driving down costs
   – Improving efficiencies
   – Rationalisation programmes in place to consolidate the Group

• Geographic footprint is now delivering
   – 40% orders coming from RoW, growing to 50% in 2011 and 2012

• Sustaining our domestic markets and proving our resilience in home markets
   – Italy (High Speed, AW101 helicopters)
   – UK (Integrated Operational Support for UK MoD helicopters, Complex weapon contract)
   – US (Electro-optics for ground vehicles, Thermal Weapon Sights and Mast Mounted Sights, C27J JCA)

                              2010 Better Than Expected
                                                                                                    5
2011 – Looking Ahead

• 2011 Guidance
    – Cash flow* €400–500mln
    – Revenues €18.3–19bn
    – Ebita €1,530–1,600mln
    – Orders 2011E >€20bn, maintaining a book to bill solidly > 1

• Reducing debt through
    – Ansaldo Energia
    – Real estate                               Debt reduction of ca. €600-650mln by end of 2011

        Strategic repositioning of DRS aimed at supporting its entrance in new strategic programmes, as well
        as optimising business portfolio in order to better exploit opportunities in the US and international
        markets and to further reduce Group debt

                    Focusing on Cash Generation and Reducing Debt

 *Free Operating Cash Flow: Operating Cash after investments, net financial charges and taxes                   6
Backdrop to Performance in 2011

• Civil unrest in North Africa
• Domestic markets resilient but still tough as cuts take hold

• Security and border control requirements increasing
• Civil aircraft return to growth
• Exploiting our strong footholds in India, Turkey, Russia and Middle East

             Aiming to Deliver on Our Guidance for 2011

                                                                             7
Financial & Business Review
Alessandro Pansa

                              8
Full Year 2010 Results

(Euro mln)         FY 10    FY 09    Change

Revenues           18,695   18,176     2.9%       Strong performance by three pillars

                                                  Increase in Helicopter, D&SE and
EBITA Adj          1,589    1,587      0.1%       Transportation offset reduction in
                                                  Aeronautics and Energy

EBITA Margin Adj   8.5%     8.7%     (0.2) p.p.

                                                  Reduction due to restructuring charges
Net Income          557      718     (22.4%)
                                                  and finance costs

Dividend (Euro)     0.41     0.41       0%        At current prices, Dividend Yield of 4.5%

                                                  2010 performance better than guidance
                                                  due to improved working capital
FOCF                443      563     (21.3%)
                                                  management and investments focused
                                                  on pillars

Net Debt           3,133    3,070      2.1%       FX impact

                                                  Driven by Helicopters, Space, Energy
New Orders         22,453   21,099     6.4%
                                                  and Transportation

Backlog            48,668   45,143     7.8%       Overall order increase and FX impact

                                                                                              9
EBITA Bridge

         (Euro mln)                                                         2010                        2009
         EBIT                                                               1,232                       1,392
         Impairment                                                            -                           -
         Non recurring costs (income)                                        145                          92

         Amortisation of intangible assets acquired
         through a business combination
                                                                              85                          80

         Restructuring Costs                                                 127                          23
         EBITA Adjusted                                                     1,589                       1,587

Non-recurring costs:
Writedowns and provisions for € 94m of which:
€64m in Elsag Datamat (IT & Security) due to significant reduction in backlog for networking systems and refocusing on core
Security business. €30m in Ansaldo Energia for exiting costs from alternative energy fuel cell business
Costs relating to acquisition of PZL (Polish helicopter business) for €3m
Costs in Vehicles for final reconfiguration of trains for Danish railways for €30m and writedowns and extra contractual costs
for €18m caused by financial difficulties of strategic supplier
Restructuring costs: As anticipated at Finmeccanica’s Investor Day, the implementation of a significant 4 year cost
reduction programme has started with headcount reductions in Aeronautics (€62m), costs for reorganisation and right sizing of
assets in Defence Electronics (€30m) and restructuring costs in Helicopters (€24m) and Transport (€8m)
                                                                                                                                10
Strong Attention to Shareholder Remuneration
EPS* Ordinary DPS
in Eurocents in Eurocents
• At current prices, proposed DPS of 41 Eurocents implies a dividend yield of 4.5%
All dividends relating to FY 2005 / 2007 recalculated to take into account the
*EPS after minority interests calculated on average number of shares impact of the Rights Issue completed on 21 November 2008.
** 2010 proposal to be approved by AGM 11Improving Cash-Flow Generation Through Selective
Investments and Disciplined WC Management
Cumulated Gross Investments Capex and Capitalised R&D
2010-2012 2010-2012
Old plan New plan
10% 9%
6% 27% 7% 25% Capitalised
R&D
R&D
€4.3bn €3.6bn* Capitalizzata
41%
24% 25%
Capex
59%
33% 34%
Helicopters Aeronautics Defence & Security Electronics Space & Defence Systems Transportation & Energy
Working Capital Management: significantly lower cash absorption in 2010 through
improved customer collection and inventory reduction
* Of which €1.2bn in 2010
12Sector Results
2010 Revenue 2010 Margin 2010 Order
Sector Revenues Growth Ebita Change vs. Orders Growth
Eur bn vs. 2009 Margin 2009 (bps) Eur bn vs. 2009
Helicopters 3,644 4.7% 11.3% 70 5,982 86.6%
Defence and
7,137 6.2% 10.3% (10) 6,783 (17.4%)
Security Electronics
Aeronautics 2,809 6.4% 7.3% (180) 2,539 (31.8%)
Space 925 1.8% 4.2% (100) 1,912 67%
Defence Systems 1,210 1.3% 8.8% (200) 1,111 (9.5%)
Energy 1,413 (14.5%) 10.3% 50 1.403 13.4%
Transportation 1,962 8.3% 4.9% 140 3,228 13.9%
Finmeccanica 18,695 2.9% 8.5% (20) 22,453 6.4%
13Helicopters
Defence vs. Civil
FY2010 Revenues
(Euro mln) FY 10 Change FY 09
• Order intake (+87% YoY) mainly driven by significant 30%
increase in Military-Gov orders
Revenues 3,644 4.7% 3,480
– 12 AW101 for the Italian MoD 2009
– IMOS contract (AW101Merlin ) and upgrade of 10 Lynx
EBITA Adj 413 11.3% 371
MK9 with UK MoD 70%
– AW101 Indian contract (incl. 5 years of product support)
Margin 11.3% 0.7 p.p. 10,7%
and 9 T129Atak 38%
• Civil-Gov orders include ca.142 helicopters worth € 1.2bn Orders 5,982 86.6% 3,205
2010
• Revenues driven by AW139 (+9.5% YoY) and product
support (+15.5% YoY), i.e. Integrated Operational Backlog 12,162 24.3% 9,786 62%
Support
Defence Civil
• EBITA increase due to revenue growth and product mix
• Backlog equal to 3 years of production
14Helicopters: Large Robust Military Backlog Supports
Future Growth
Market Outlook Key Programmes in 2012 and Beyond
• Recovery of civil market expected by 2012 • Governmental programmes (Italy and export)
• Improvement in world economy led by • Integrated Operational Support for UK MoD rotary wing
emerging nations and oil producing countries fleet (Sea King, Apache)
• Solid US Military market • AW109/AW139 Italy and export (i.e. Middle East, SE
– New tenders expected in M/L term Asia, India, Malaysia, Brazil)
• Main drivers sustaining our growth opportunities: • AW119 export (i.e. Brazil)
– New military requirements (Short term)
– Tilt rotor (S/M term)
– Unmanned helicopters (M/L term)
– Dual use helicopters for security/surveillance
– Opportunity to expand production facilities (i.e. PZL)
Key Programmes in 2011
• Integrated Operational Support for UK MoD rotary wing
fleet (AW159)
• First order for the AW169 (unveiled in July 2010 at
Farnborough Airshow). Purchase agreement signed to
date for 20 a\c
• AW101, AW139, AW109/AW119 export (i.e. Japan,
Spain, South Korea, Qatar, USA, Canada)
• AW149 Turkey
15Defence and Security Electronics
Defence vs. Civil
FY2010 Revenues
• Revenue growth mainly due to 13%
(Euro mln) FY 10 Change FY 09
– Avionics and Electro-optics systems , DRS and value
added applications for Security
Revenues 7,137 6.2% 6,718 2009
• Key contributors to revenues
– Eurofighter DASS and avionic radars EBITA Adj 735 5.3% 698 87%
– Large systems for defence and security (i.e Forza NEC, 19%
Civil Protection), ATC Italy and export
Margin 10.3% (0.1 p.p.) 10,4%
– TETRA
– Electro-optics for ground vehicles (i.e. DVE, IBAS), 2010
Orders 6,783 (17.4%) 8,215
Movement Tracking System
81%
• EBITA growth due to volume increase and cost reduction, Backlog 11,747 (4.3%) 12,280
mainly in C&C and communications Defence Civil
• Key orders include
– Eurofighter tr.3A DASS, Captor and comms
– Panama border control system
– ATC systems both Italy and export
– Thermal Weapon Sights, Mast Mounted Sights and JV-5
computer display for US Army
16Defence & Security Electronics: Well Placed to
Respond to Increasing Worldwide Security Needs
Market Outlook Key Programmes in 2012 and beyond
• The largest market for Finmeccanica (including Defence, • Large systems (i.e. Saudi, Iraq, Italian Forza Nec) and
Security, Gov and Civil systems) cyber security
• Export opportunities for Eurofighter avionics,
• Growth opportunities in cyber security (i.e. Europe and
communication systems and logistics (i.e. Saudi, Turkey,
some growing markets)
India)
• Well positioned to address requirements: • E-scan radar & infrared Search&Track sensors for Gripen
– Ability to become solution providers rather than systems and Eurofighter
suppliers • Tactical UAV
– Through-life management capabilities • Naval C&C systems (i.e. Brazil, Malaysia, UAE)
Key Programmes in 2011 • Air Traffic Control, Italy and export (i.e. Asia)
• Tetra
• Large systems for Homeland Protection in the export
market (i.e. Brazil) • Network, comms solutions & support services for “in
theatre” US forces
• Defence Information Infrastructure for Italian MoD • Electrooptic systems for ground vehicles and Thermal
• Naval C&C systems for Brazil and Algeria weapon sights for US Army
• Eurofighter logistics and Saudi • Joint Battle Commend Platform (JV5) for US Army and
Marines
• Further activities on Tetra programme ( Secure Comms
for Italian Police)
• Mast Mounted Sights for US Army
• Air Traffic Control systems modernisation for Malaysia
17Aeronautics
Defence vs. Civil
FY2010 Revenues
• Key military orders
(Euro mln) FY 10 Change FY 09 44%
– First tranche of JSF Final Assembly and Check Out
(FACO), Tot value €414mln 2009
Revenues 2,809 6.4% 2,641
– 12 M346 Singapore (€250mln) , first delivery expected
in 2012 56%
EBITA Adj 205 (14.9%) 241
– 8 a\c C27J-JCA. Total of 21 a\c ordered so far
• Key civil orders include Margin 7.3% (1.8 p.p.) 9.1% 43%
– Superjet100, 15 a\c for Mexican Interjet. First delivery
expected in 2012 Orders 2,539 (31.8%) 3,725 2010
– 80 ATR a\c (backlog as at FY2010 159 a\c) 57%
Backlog 8,638 (2.4%) 8,850
• Revenue growth mainly driven by military programmes
(EFA, C27J, M346 and G222), including Defence Civil
– Eurofighter tr.2 & logistics (9 a\c delivered to Italian AF)
– C27J: 9 a/c delivered of which 5 JCA
– M346 Italy tranche 1
• Civil revenues driven by B787, 24 fuselages and 17
horizontal stabilizers delivered
• Decline in EBITA mainly due to criticalities in some
industrial processes. Industrial reorganisation and
efficiency plan launched
18Aeronautics
Market Outlook Key Programmes in 2012 and beyond
• Civil aeronautics recovery (mainly for wide-body • Worldwide opportunities for M346 advanced Trainer (i.e.
segment) Italy tranche 2 (9 a/c), UAE (48 a/c), Israel (24 a/c),
– Growth opportunities for B787 Poland (16 a/c), TX in US and other export
• Healthy market for Regional jets and Turboprop • C27J for USA (more than 30 a/c) and export
– Growing opportunities for both Superjet100 and ATR (i.e. Peru, Indonesia, South Africa, Australia, India,
(green technology) Panama and Middle East, for a total of approx. 40 a/c)
• Solid military market (i.e. combat, trainer and • B787 (240 s/s), ATR (>300 a/c) and Superjet100 (140
transport medium) a/c)
– USA and Europe focused on EFA and JSF, and further • EFA export i.e. Saudi, Turkey , India for more than 100
opportunities in India, Middle East (Oman, Qatar), South a/c
America (Brazil)
– Trainer demand addressed mainly to US requirement
for advanced trainers (M346 opportunity)
– C-27J could replace lighter aircraft (i.e.Taiwan,
Malaysia) and also ageing C-130 (in countries with
budget constraints)
• UCAV entry into service expected after 2020 in USA and
around 2025 in Europe
Key Programmes in 2011
• C27J USAF (8 a/c) and export (i.e. Oman 8 a/c, Nigeria 3
a/c)
• ATR MP / ASW (Italy Cost Guard 2 a/c and export 1 a/c)
• B787 (100 s/s), ATR (60 a/c) and Superjet100 (31 a/c)
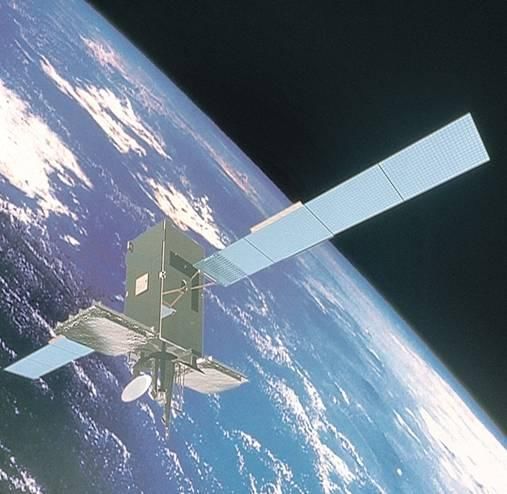
19Space
Defence vs. Civil
FY2010 Revenues
(Euro mln) FY10 Change FY 09
• Order increase mainly due to Earth Observation and
Iridium NEXT contract (81 satellites )
Revenues 925 1.8% 909 16%
• Revenue mainly due to commercial and military comms, 2009
84%
earth observation EBITA Adj 39 (17%) 47
• Slight decrease in profitability mainly due to different mix
in Services Margin 4.2% (1 p.p.) 5.2%
• Services accounting for 33% of total backlog Orders 1,912 67% 1,145 18%
2010
82%
Backlog* 2,568 59.4% 1,611
Key programmes in 2011 and beyond
• Meteosat 3rd generation (earth observation)
Defence Civil
• Military & institutional comms (Sicral 2, Athena fidus,
Syracuse 3)
• Cosmo Sky Med second generation
• EXOMARS (scientific programmes- ESA)
20Defence Systems
Defence vs. Civil
FY2010 Revenues
• Revenue growth mainly driven by Armored vehicles & (Euro mln) FY10 Change FY 09
0%
Naval guns and Missiles, offsetting slight decrease in
Underwater 2009
Revenues 1,210 1.3% 1,195
• Key revenues include Missiles (Aster, Mistral, Exocet, 100%
MEADS and customer support), Land & Naval (VBM,
EBITA Adj 107 (17.7%) 130
PZH2000,Hitfist, 76/62 SR guns, FREMM) Torpedoes
(Black Shark, MU90, A244, FREMM) 0%
Margin 8.8% (2 p.p.) 10.9%
• EBITA slightly down mainly due to lower volumes and
2010
higher costs in Underwater, partially offset by higher Orders 1,111 (9.5%) 1,228
volumes and profitability in Missiles and Armoured 100%
vehicles & Naval guns Backlog* 3,797 (5.3%) 4,010
• Key orders include: Missiles (Meteor France & Sweden, Defence Civil
UK Complex weapon contract and customer support) ;
Land & Naval (38 VBM Italy and Vulcano Programme,
naval guns for Fremm, Hitfist Poland); Underwater (light
torpedoes)
Key programmes in 2011 and beyond
• Armored vehicles & Naval guns. Further opportunities in
Italy (VBM, Forza Nec, Fremm) and worldwide (Naval
guns for Brazil, India, Malaysia)
• Underwater: opportunities for heavy torpedoes (Italy,
India, South America, Far East) and light torpedoes
(India, Singapore, Australia, South Africa)
• Strategic opportunities for Missiles in UK (UK Complex
weapon contract), Europe and UAE 21Energy
Defence vs. Civil
FY2010 Revenues
• Plants & components (P&C) drive key changes yoy (Euro
FY10 Change FY 09
mln) 0%
– Orders Up: Key orders include P&C (i.e. Bangladesh,
Finland, Middle East and North Africa), new service Revenues 1.413 (14.5%) 1,652 2009
solutions (i.e. LTSA Ireland and Tunisia), nuclear plants
and services (i.e. China, Slovakia and France) and 100%
renewable energy (solar and wind Italy) EBITA Adj 145 (10.5%) 162
– Revenues down due to lower volumes in P&C: key
Margin 10.3% 0.5 p.p. 9.8% 0%
revenues include P&C (Algeria, France, Italy), Long
Term Service Agreements (Italy) nuclear activities Orders 1,403 13.4% 1,237
(China, Slovakia, Argentina, France) and renewable 2010
energy (Italy) Backlog 3,305 (2%) 3,374
100%
– Ebita Adj. affected by lower volumes, margins up due to
increased efficiency in P&C
Defence Civil
– Service accounts for ca. 57% of order backlog
• Key programmes in 2011 and beyond
• Plants and Components in Italy, Algeria, South Africa,
Syria, Egypt, Russia, Chile and other European and
African countries
• Service: several Long Term Service Agreement
opportunities in Italy and abroad
• Nuclear: China, Romania, Slovakia, Russia, France and
Italy
• Renewable Energy in Italy
22Transport
Defence vs. Civil
FY2010 Revenues
• Orders up due to Vehicles and Signalling & Systems (Euro mln) FY10 Change FY 09
0%
– Key orders include Signalling & Systems (Copenhagen
Revenues 1,962 8.3% 1,811
driverless metro: Cityringen +O&M, existing lines O&M, 2009
Libya, Kazakhstan, Italy: Naples and Genoa, Australia)
and Vehicles (Italian High Speed, regional trains) EBITA Adj 97 49.2% 65 100%
• Revenues up due to Signalling & Systems Margin 4.9% 1.4 p.p. 3,6%
– Key revenues include Italy, Turkey, Australia, Libya, 0%
Denmark and Saudi Orders 3,228 13.9% 2,834
2010
– Ebita Adj. up mainly due to lower operating loss in
rolling stock and increased volumes in Signalling & Backlog* 7,303 22.7% 5,954 100%
Systems
• Signalling & Systems currently accounts for 62% and Defence Civil
Vehicles for 37% of order backlog
Key Programmes in 2011 and beyond
• Key opportunities in signalling (Italian metro, USA,
Australia and Far East) and vehicles (regional
trains, metros and service Italy, international
opportunities in metro and High Speed trains)
23Guidance for 2011
2011E
Revenues € 18.3-19bn
EBITA €1,530-1,600mln
FOCF* €400-500mln
*Free Operating Cash Flow: Operating Cash after investments, net financial charges and taxes
24Committed to Achieving the Cost Reductions at
Group Level
• As presented during our latest Investor Day in November 2010, we are carrying out a set of
efficiency measures for a total amount of ca. €290mln of costs over 2010-2013, of which
ca.€130mln accounted for in 2010
• All efficiency plans are on track
• Worldwide expected headcount reductions increased from ca. 3,000 cumulated over 2010-
2013 to approx. 3,600 over the same period, of which more than 2,000 finalised in 2010,
mainly in Poland and USA
Due to a more aggressive competitive environment and increased
international presence, cost reduction benefits will be shared with our
customers in order to further strengthen our overall competitiveness
25Defence & Security Electronics Segment
Optimisation
Internal Drivers
• Elimination of existing overlaps
• Improvement of competitiveness
(product portfolio) and synergies
(R&D investments)
• Definition of a business
organisation closer to the market
During 2010 we
completed the 1st • Exploitation of technological
complementarities … 2nd phase
phase of re-
started at the
organisation
External Drivers beginning of
process of D&SE
2011….
• Convergence of IT and TLC
• Market approach oriented to “turn
key solutions”
• Challenging Net-Centric and Cyber
Security requirements
• Dual use approach
26Update on Restructuring Plans (1/2)
Aeronautics short/medium term actions include savings for ca. €125mln by 2013
• Full integration of Aeronautics Sector organisational structure and responsibilities completed.
• 1° Wave of integrated SAP (Alenia and Aermacchi) system completed.
• 2° Wave (business controlling model) to be completed by end of 2011.
• Headcount reduction, approx. 1,000 over two years. Agreements already achieved for over
600 people (including 30 senior managers).
• Reduction of Fixed Operating Cost of €15mln in 2011 vs 2010: target deployed to individual
budgets for function/production site, on track.
• Engineering, industrial and supply chain rationalisation: savings of €110mln by 2013
confirmed. Action plan, metrics and responsibilities deployed, on track.
– Integration of Engineering confirmed (savings €10mln) with offload of non core activities.
– Closure of two sites completed (Brindisi and “Centro Bonifacio” –Naples).
– Closure of one out of two Turin sites undergoing.
– Rationalisation of industrial base defined: industrial plan to be launched soon (savings €20mln).
– Aeronautics Sector Supplier Conference to be held on the 10th of March to share targets of cost savings
(€80mln) and first tier supplier reduction (30%)
27Update on Restructuring Plans (2/2)
Space:
• New Telespazio, reorganisation of Space sector effective as of January 2011
– Restructuring of operations (including portfolio rationalisation), optimised management of
satellite capacity, focused Operation Centres, reduction of controllable costs and reduced
number of legal entities
– Telespazio (Space Services) now operates the space-related activities previously managed
by Elsag Datamat and Selex SI (Vega)
Rolling Stock:
• Restructuring/reengineering process in progress, both internally and externally
(concerning specific critical customers)
28Business Strategy
Pier Francesco Guarguaglini
29Our Current Strategic Guidance
• Market leadership in 3 robust strategic pillars (Helicopters, Aeronautics, Defence & Security
Electronics)
• Resilience and opportunities in domestic markets despite pressure on defence budgets;
reinforcing our positioning, mainly in the UK and in the US, by enlarging our offering and
moving up the value chain
• Rich opportunities in our target growth market by leveraging on our industrial and
commercial footprint
• Wide range of decisive actions creating platform for performance improvement
• Profitable and selective investments in technology and products to support organic growth
• Building the future: new frontiers provide dynamic growth opportunities
30Outstanding Order Intake Boosts Visibility of Our
Future Performance
2010 Orders 2010 Key Orders
Italy
Programme Value Sector
24%
40% UK Product support €2.2bn Helicopters
€22,453mln AW101 €1.6bn Helicopters
14% US
Eurofighter tr. 3A €1.4bn Defence &
and customer Security
22%
RoW
support Electronics
Civ/Gov Helos €1.2bn Helicopters
High speed Italy €0.9bn Transport
ATR €0.7bn Aeronautics
New Units €0.6bn Energy
Service €0.6bn Energy
Iridium €0.5bn Space
JSF €0.4bn Aeronautics
31Solid Backlog Sustained By Strong Commercial
Performance
Major programmes in backlog
Programme Sector
Eurofighter Aeronautics/Defence &
Security Electronics/Defence
Systems
C27J Aeronautics
book to book to AW101 Helicopters
bill ratio bill ratio
ATR Aeronautics
1.16 1.2
B787 Aeronautics
AW139 Helicopters
Large Systems Defence & Security Electronics
FREMM Defence & Security
Electronics/Defence Systems
ATC Defence & Security Electronics
High Speed Transport
Limited Exposure to North
African Countries
32Current Backlog Establishes a Strong Platform for
Further Growth
Revenues
€18.3-19bn
~16% from 2011
Orders ~ 15% from ~ 12% from
2012 Orders 2013 Orders
~ 20% Orders
acquired in 2011 ~ 43% Orders
~ 84% from acquired in 2011-
Orders 2012
acquired
~ 65% from
Orders
~ 45% from
acquired
Orders
acquired
2011E 2012E 2013E
33Orders and Revenues: Geographical Footprint
Enables Us to be Resilient
2010 Orders 2011 – 2012 Orders
19%
Italy 24%
40%
UK Avg p.y. 8%
€22,453mln 51%
>€20bn
US 14%
RoW 22%
22%
2010 Revenues 2011 – 2012 Revenues
20% 22%
45% 2011E
€18,695mln 49%
€18.3-19bn
12% 8%
21%
23%
Maintaining a Book to Bill Firmly Above 1 34USA: Focus on Resource Optimisation
Fewer cuts than anticipated, mainly driven by increased efficiencies. Proposed
spending is up in our programmes (helos, cargo airplanes, tanker, ships, UAV
and cybersecurity).
• Advanced Trainer Replacement programme (TX tender - M346), C27J (9 additional a\c
funded) and US Tanker (DRS and Alenia teaming with Boeing)
• Presidential Helicopter VXX (AW and Boeing agreement signed), Air Force Common Vertical
Lift Support Platform, Air Force HH-60 Recapitalization, Army Armed Aerial Scout, Coast
Guard fleet Recapitalization (Dept. of Homeland Security Budget)
• Procurement and research in military communications, electronics, telecommunications, and
intelligence technologies, Joint Tactical Radio System, 3rd generation Rapid Response
requirements, Electro-optic systems for US Army and Navy, on-board ship electronics
systems
35UK: Focus on Resource Optimisation
UK Budget remains constrained, however…
• Merlin IOS awarded (ca.£570M); AW159 programme on budget and on time (4 completed, 3
flying), SAR-H termination extends life of AW Sea Kings
• Typhoon enhancement plan in development, Afghanistan operations receiving £4B funding
• Developing solutions for the Global Combat Ship programme (T26); Strong government
support to exports (Saudi, Oman, Denmark, Korea, Spain, India, Japan); Group exports from
UK increased to £500M in 2010
Expanding the horizon:
• Launching Finmeccanica Cyber Solutions
• Establishing our footprint in Space solutions (i.e. from CosmoSkyMed)
• Securing qualification for new security solutions
36Italy: Focus on Resource Optimisation
Italy: A Solid Platform on which to build
• Military programmes (and NATO) relying on multiple funding sources (i.e. Ministry of Industry
for Eurofighter, FREMM, VBM, Forza Nec);
• Growing C4ISR sector
• Growing funding opportunities for Security (i.e. Waste Transport Management)
• Defence Information Infrastructure programme to provide integrated network comms to
Armed Forces. Funded by MoD, RFI to be issued shortly
• Additional opportunities underpinned by Public funds (i.e. Nuclear Power and Transportation
- Metro, Regional Trains, Signaling)
37Achievements and Opportunities in Target Growth
Markets: India
India is a priority market for Finmeccanica
Democracy, sustainable economical growth, large industrial base,
well-educated people and competitive costs encourage long-term investments
Order Intake Key Drivers
• 2005-2009 €250mln average/year • Improving competitive position
• 2010 exceeding €750mln (incl 12 VVIP AW101 €560mln) • Facilitating G to G Agreements
• 2011- 2015 expected €500mln average/year • Exploiting R&D collaborations
• Enlarging industrial presence
$11bn expected accessible defence budget in 2011
Current Finmeccanica offers > €8.5bn
Key Campaigns
• Helicopters (MRH/NH90, Sea King and Kamov • Naval & Maritime (Naval Guns, HWT and
upgrds, NUH/AW109, CG/AW139 and commercial) Countermeasures, Radar, Coastal Surv.)
• Aircrafts (MMRCA/Eurofighter, Military • Land (Arm. Veh., Guided Ammo, BMS, TCS)
Transport/C 27J, MRMPA/ATR 72MP, UAV, • Security (Border Control, Mass Transport,
regional civil transport) Airports & Seaports, Police Modernisation)
• Energy and Transportation
38Achievements and Opportunities in Target Growth
Markets: Brazil
Huge Defence & Security and infrastructure Investments
Italy and Brazil have a G-to-G agreement in place
Italian Parliament ratified the agreement in February 2011
Potential opportunities ca. €11bn
• Short-term opportunities ca. €7bn, including FREMM Frigates (Finmeccanica share approx.
€2.5bn), Border Control, Land Defence Systems
• Other opportunities: Security for major events (Olympic Games and World Cup), Trainers,
satellites and radars, battlespace management systems and High Speed Rail (Rio – Sao
Paolo)
39Achievements and Opportunities in Target Growth
Markets: Turkey
Turkey
• Partnerships and JVs (i.e. ATAK Programme between AgustaWestland and two important
Turkish Aerospace Groups (TAI and Aselsan) for the production of T129 helicopter)
• Additional opportunities
– Helicopters (AW149 TUHP)
– Defence &Security Electronics (IBM Integrated Border Management System, Coastal Border
Surveillance System, Software Defined Radio, Tetra)
– Aeronautics (Eurofighter)
– Infrastructure projects (Istanbul and Ankara metro, High Speed rail, power project)
40Achievements and Opportunities in Target Growth
Markets: Russia
Russia
• Partnerships and JVs
– AgustaWestland and Russian Helicopters jointly established a new site to produce and assemble the
civil version of AW139
– Alenia Aeronautics and Russian Sukhoi have jointly developed Superjet100 through SCAC: Russian
certification already obtained, European certification expected by end 2011. 170 a\c ordered so far,
first delivery expected in Q2 2011
– Ansaldo STS signed MoU with Russian Railways; the agreement covers the creation of a JV that will
operate in the high-tech rail transport sector. Combined value up to €1.5bn over the next 10 years,
starting from 2011
• Additional opportunities
– Defence & Security Electronics (Postal Automation, Security)
– Aeronautics (SuperJet100)
– Energy (gas turbines, decommissioning)
– Infrastructural projects (including signalling MOU)
41…On-going Efficiency Actions
• Defence and Security Electronics
segment optimisation process
GROUP’S
EFFICIENCY • Restructuring of Aeronautics,
ACTIONS Rolling Stock and Space segments
We are pursuing selected
actions to increase our
efficiency and
effectiveness, in line with
the Group strategy • Focus enhancement in core
segments of US assets portfolio
: launched : starting
42Defence & Security Electronics Segment
Optimisation
2010 2011
• “Integrated Systems”:
concentration within SELEX SI,
of all key competencies in large
systems, ATMS, CS and Surface
• Establishment of fully
integrated “ICT & Security”
capability through the merger
Radar + of Elsag Datamat and
SELEX Comms, with
• All “Space services and selected competencies in
Operations” capabilities within Cyber Security, ICT and
Telespazio, enlarging its
positioning on the European Automation
Institutional market through
widespread presence in UK,
France, Germany and Spain
• “Avionics and Electro Optics” in
SELEX Galileo, with selected
competencies in Avionics,
Electronic Warfare and Electro
Optics
43Focus Enhancement in
Core Segments of US Asset Portfolio (1/2)
Two years after DRS’ acquisition, we have completed an in depth business
assessment of all the acquired US assets, most of all in terms of growth and
profitability prospects
• As a result, we now aim to strategically reposition our US assets, specifically in the System
Integration arena
• In particular we support DRS’ strategy aimed at entering new programmes in attractive
growth areas through selective acquisitions and divestments
• To initiate this process we have already identified potential candidates for divestment of
certain businesses including those operating in:
• Non-core segments for the Group
• Markets with limited growth opportunities in the near future
• Markets where DRS lacks scale
We are currently initiating the process to
implement this portfolio optimisation by 2011
44Focus Enhancement in
Core Segments of US Asset Portfolio (2/2)
• The proceeds accruing from the successful completion of the divestment plan will be
partially used for debt reimbursement and partially reinvested to support DRS’ growth and
repositioning
• Already identified potential targets characterised by:
– Small / Medium size
– Control of enabling technologies
– Ease of integration within Group products
– Positioning in key DoD programs of interest for the Group that can be effectively integrated within
DRS and foster growth in strategic areas
The combined effect of:
1. divestment of non-core businesses and,
2. selected investments in growth areas, will allow us to progressively
reposition our US assets in more strategic growth areas
45Summary
Strong Value Proposition for Finmeccanica
• Continue to streamline and consolidate the Group
• Well positioned to exploit fast growing security demand leveraging our market-leading
technologies and strong capabilities
• Building on established industrial footholds in emerging growth markets
• Sustainable 9% EBITA margin by 2013
• Increase cash flow operationally and through disposals to reduce debt and enhance
shareholder remuneration
46Appendix
47FY 2010 Results – Profit & Loss
CONSOLIDATED PROFIT AND LOSS ACCOUNT
€mil. 2010 2009 Change % YoY
Revenues 18,695 18,176 2.9%
Costs for purchases and personnel (16,381) (16,125)
Depreciation and amortisation (578) (575)
Other net operating revenues (costs) (147) 111
Adj EBITA (*) 1,589 1,587 0.1%
Adj EBITA (*) margin 8.5% 8.7%
Non-recurring revenues (costs) (169) (92)
Restructuring costs (103) (23)
Impairment - -
PPA amortisation (85) (80)
EBIT 1,232 1,392 -11.5%
EBIT margin 6.6% 7.7%
Net finance income (costs) (366) (297)
Income taxes (309) (377)
Net profit before discontinued operations 557 718 -22.4%
Profit of discontinued operations
Net profit 557 718 -22.4%
Group 493 654
Minorities 64 64
EPS (EUR)
Basic 0.854 1.134
Diluted 0.853 1.133
EPS of continuing operations (EUR)
Basic 0.854 1.134
Diluted 0.853 1.133
(*) Operating result before:
•any impairment in goodw ill;
•amortisations of intangibles acquired under business combination;
•reorganization costs that are a part of significant, defined plans;
•other exceptional costs or income, i.e. connected to particularly significant events that are not related to the ordinary performance of the
business.
48Balance Sheet
BALANCE SHEET
€mil. 31.12.2010 31.12.2009
Non-current assets 13,641 12,956
Non-current liabilities (2,583) (2,639)
11,058 10,317
Inventories 4,426 4,662
Trade receivables 9,242 8,481
Trade payables (12,996) (12,400)
Working capital 672 743
Provisions for short-term risks and charges (762) (595)
Other current net assets (liabilities) (738) (853)
Net working capital (828) (705)
Net invested capital 10,230 9,612
Capital and reserves attributable to equity holders of
the Company 6,814 6,351
Minority interests 284 198
Shareholders’ equity 7,098 6,549
Net debt (cash) 3,133 3,070
(assets)/liabilities held for sale (1) (7)
49Cash Flow
CASH FLOW
€mil. 2010 2009
Cash and cash equivalents at 1 January 2,630 2,297
Gross cash flow from operating activities 2,361 2,222
Financial charges paid (258) (180)
Income taxes paid (335) (392)
Changes in other operating assets and liabilities and provisions
(355) (134)
for risks and charges
Funds From Operations (FFO) 1,413 1,516
Changes in working capital (117) (488)
Cash flow generated from (used in) operating activities 1,296 1,028
Investment in tangible and intangible assets after disposals (853) (465)
Free operating cash flow (FOCF) 443 563
Strategic operations (138) (10)
Change in other investment activities 30 (3)
Cash flow generated (used) by investment activities (961) (478)
Share capital increase - -
Cash flow from financing activities (884) 66
Dividends paid (257) (256)
Cash flow generated (used) by financing activities (1,141) (190)
Exchange gains/losses 30 (27)
Cash and cash equivalents at 31 December 1,854 2,630
50Divisions
Other
Defence and
2010 Defence Activities
Helicopters Security Aeronautics Space Energy Transport Eliminations Total
(€mln) Systems and
Electronics
Corporate
Revenues 3,644 7,137 2,809 925 1,210 1,413 1,962 243 (648) 18,695
Adj EBITA (*) 413 735 205 39 107 145 97 (152) 1,589
Adj EBITA (*) margin 11.3% 10.3% 7.3% 4.2% 8.8% 10.3% 4.9% n.a. 8.5%
Depreciation and amortisation 136 230 154 29 43 26 25 20 663
Investment in non-current assets 175 258 327 45 40 37 53 24 959
Research and development costs 409 810 369 68 260 38 69 7 2,030
New orders 5,982 6,783 2,539 1,912 1,111 1,403 3,228 105 (610) 22,453
Order backlog 12,162 11,747 8,638 2,568 3,797 3,305 7,303 113 (965) 48,668
Headcount 13,573 29,840 12,604 3,651 4,112 3,418 7,093 906 75,197
Other
Defence and
2009 Defence Activities
Helicopters Security Aeronautics Space Energy Transport Eliminations Total
(€mln) Systems and
Electronics
Corporate
Revenues 3,480 6,718 2,641 909 1,195 1,652 1,811 410 (640) 18,176
Adj EBITA (*) 371 698 241 47 130 162 65 (127) 1,587
Adj EBITA (*) margin 10.7% 10.4% 9.1% 5.2% 10.9% 9.8% 3.6% n.a. 8.7%
Depreciation and amortisation 130 240 152 27 42 24 24 16 655
Investment in non-current assets 125 209 335 66 43 60 87 14 939
Research and development costs 328 711 474 87 235 36 110 1 1,982
New orders 3,205 8,215 3,725 1,145 1,228 1,237 2,834 113 (603) 21,099
Order backlog 9,786 12,280 8,850 1,611 4,010 3,374 5,954 172 (894) 45,143
Headcount 10,343 30,236 13,146 3,662 4,098 3,477 7,295 799 73,056
(*) Operating result before:
•any impairment in goodw ill;
•amortisations of intangibles acquired under business combination;
•reorganization costs that are a part of significant, defined plans;
•other exceptional costs or income, i.e. connected to particularly significant events that are not related to the ordinary performance of the business.
51Exchange Rates Adopted / Employee Obligations /
Share Data
Exchange rates adopted At 31 December 2010 At 31 December 2009
average exchange rate for the year exact average exchange rate for the year exact
US dollar 1.32572 1.3362 1.39478 1.4441
Pound Sterling 0.85784 0.86075 0.89094 0.88810
At 31 December 2010 At 31 December 2009
Employee obligations (€mln) Liabilities Assets Net Liabilities Assets Net
Severance obligations 610 0 610 640 0 640
Defined-benefit retirement plans 341 32 309 382 11 371
Share of MBDA joint-venture pension obligation 64 0 64 88 0 88
Short Term defined contribution obligations 26 0 26 26 0 26
1,041 32 1,009 1,136 11 1,125
SHARE DATA
2010 2009 Var. %
Average number of shares in period (thousands) 577,026 576,914 0.0%
Net result (not including minority interests) (€mil.) 493 654
Result of continuing operations (not including minority interests)
493 654
(€mil.)
BASIC EPS (EUR) 0.854 1.134 -24.7%
Average number of shares for the period (in thousands) 577,685 577,573 0.0%
Result adjusted (not including minority interests) (€mil.) 493 654
Adjusted result of continuing operations (not including minority
493 654
interests) (€mil.)
DILUTED EPS (EUR) 0.853 1.133 -24.7%
52Finance Income and Costs
Finance Income and Costs (€mln)
At 31 December 2010 At 31 December 2009
Income Costs Net Income Costs Net
Capital gain on sale of STM 0 0 0 18 0 18
Dividends 3 0 3 6 0 6
Gains on investments and securities 4 0 4 37 0 37
Discounting of receivables, payables and provisions 5 -4 1 6 -12 -6
Interests(*) 26 -330 -304 30 -301 -271
Premiums (paid) received on IRS 77 -35 42 66 -52 14
Commissions (including commissions
8 -59 -51 2 -87 -85
and other non-recourse items)
Fair value adjustments through profit or loss 60 -83 -23 98 -44 54
Premiums (paid) received on forwards 7 -4 3 14 -8 6
Exchange-rate differences 636 -618 18 721 -723 -2
Value adjustments to equity investments 2 -10 -8 0 -1 -1
Interest cost on defined-benefit plans
0 -32 -32 0 -36 -36
(less expected returns on plan assets)
Finance income/costs-related parties 1 -7 -6 6 -7 -1
Otherfinance income and costs 21 -20 1 3 -50 -47
850 -1202 -352 1007 -1321 -314
*of which finance costs arising from the application of the effective (not liquidated) interest rate on bonds in the amount of
€mil 48 (€mil 36 at 31 December 2009).
53Debt Structure
9%
31%
20%
Dollar Bond 69%
Sterling Bond Fixed
71% Euro Bond Floating
• Average Debt Life > 10 years
600
• 600
Average cost
500of debt approximately 5.6%
347
212
•2019 Currently
2022 2025
approx. 2039
70-30% 2040
fixed vs. floating interest cost
• Rating: Fitch = BBB+ Stable Outlook
Moody’s = A3 Stable Outlook
S&P = BBB Negative Outlook(1)
(1) On 6 December 2010 S&P downgraded Finmeccanica (FNC) rating from BBB with a Stable Outlook to BBB with a Negative Outlook 54Long Term Debt Maturity Profile
Dollar Bond 46
Sterling Bond 46
Euro Bond 465 46
1.000 46
ond EIB 500 600 500
225 374
(€mln) 37 46 46 46 46 46 46
374
2011 2012 2013 2014 2015 2016 2017 2018 2019 2020 2021 2022 2025 2039 2040
212 347
• No refinancing needs until end of 2013
2039 2040
• 12-year amortizing EIB Loan drawn in August
600 500 407
244
0
21 2022 • Liquidity
2025 bank 2040 consolidated into a new €2.4bn 5-year Revolving Credit Facility
2039lines
signed in September 2010
No short term refinancing needs and adequate liquidity support
55Long Term Debt Maturity Profile
Dollar Bond
Sterling Bond 46
46
Euro Bond
465 46
ond EIB 1.000 46
(€mln)
500 600 500
225 374
37 46 46 46 46 46 46
374
2011 2012 2013 2014 2015 2016 2017 2018 2019 2020 2021 2022 2025 2039 2040
Bond Available Credit Lines
212 347
Notional Amount Cash Credit Lines Size Oustanding December 2010 Tenor Margin (bps)
Issuer Issue Date Expiry Date Coupon
(€m)
2039 2040 Available Credit Lines Revolving Credit Facility 2400 0 Set 2015 75(1)
Finm. Finance - EMTN 2008-2009 Dec-2013 1000 8,125%
Finm. Finance
Cash Credit- Lines
EMTN Size2003 Oustanding
Dec-2018
September 2010 500Tenor 5,75%(bps)
Margin Confirmed Credit Lines 50 0 18 months* 120*
600 500
Meccanica Holdings USA 2009 July-2019 374 6,25% Unconfirmed Credit Lines 672 0 18 months* 50-100*
Revolving Credit Facility 2400 407
700 Set 2015 75(1)
Finm. Finance - EMTN 2009244 Dec-2019 465 8,0%
0 Confirmed Credit Lines
Finm. Finance - EMTN
50
2009
0
Jan-2022
18 months*
600
120*
5,25%
Total 3122 0
Unconfirmed Credit Lines 690 0 18 months* 50-100* Bank Bonding Lines Size
21 2022 2025
Finmeccanica SpA - EMTN 2039 March-2025
2005 2040 500 4,875%
Total
Meccanica Holdings USA 31402009 700
July-2039 225 7,375% Total 2717
Meccanica
Bank BondingHoldings
Lines USA Size2009 Jan-2040 374 6,25%
Total Totale 2635 4038
Loan
Size Tenor Margin
EIB 500 12 - year amortizing (3) 79,4bps on 6M Euribor / 3,45% (2)
*Average. Expected to be renewed at maturity.
(1) Based on actual rating
(2) Drawn in August 2010 for €200mil at floating rate and €300mil at fixed rate
(3) Of which two years grace period
(4) On 6 December 2010 S&P downgraded FNC rating from BBB with a Stable Outlook to BBB with a Negative Outlook
The amount in GBP and USD are calculated using the exchange rate of 31 December 2010 56Total R&D Expenditure in 2010
€ mln FY 2010 FY 2009
Value % of Revenues Value % of Revenues
R&D Total Expenditure 2,030 11% 1,982 11.0%
of which:
Customer Funded 1,056 930
Government Funded 292 432
Group Expenditure 682 620
€ mln FY 2010 FY 2009
Value % of Revenues Value % of Revenues
Group expenditure 682 3.6% 620 3.4%
of which:
R&D Costs Charged to P&L 362 1.9% 341 1.9%
Gross R&D Capitalised 320 279
57Development Costs Capitalised as Intangible Assets
at 31 December 2010
Self Funded Self Funded
€ mln Total
National Security Other
1 Jan 2010 Opening balance 545 624 1,169
Gross R&D Capitalised 155 165 320
Depreciation and write offs (34) (121) (155)
Other Changes 44 5 49
Net R&D Capitalised 165 49 214
31 Dec 2010 710 673 1,383
582011 Financial Calendar
Date Event
2 March 2011 2010 Full Year Results
Ordinary shareholders’ meeting (first
29 April and 4 May 2011
and second call)
Extraordinary shareholders’ meeting
29 April – 3 and 4 May 2011
(first, second and third call)
28 April 2011 First Quarter 2011 Results
27 July 2011 First Half 2011 Results
3 November 2011 Third Quarter 2011 Results
59IR Contacts
Investor Relations Finmeccanica
investor_relations@finmeccanica.com
Website: http://www.finmeccanica.com/Investor Relations
John D. Stewart Raffaella Luglini
VP Investor Relations Investor Relations Officer
+39 06 32473.290 +39 06 32473.066
john.stewart@finmeccanica.com raffaella.luglini@finmeccanica.com
60You can also read