Ethanol/Water Separation by Linda Type A Membrane
←
→
Page content transcription
If your browser does not render page correctly, please read the page content below
Ethanol/Water Separation by Linda Type A
Membrane
Zhuoqi Zheng
Qingdao Agricultural University https://orcid.org/0000-0003-3758-2756
Yan Li ( 1310757678@qq.com )
Qingdao Agricultural University
Research Article
Keywords: LTA molecular membrane, Membrane filtration loss, ethanol concentration
Posted Date: November 1st, 2021
DOI: https://doi.org/10.21203/rs.3.rs-964893/v1
License: This work is licensed under a Creative Commons Attribution 4.0 International License.
Read Full License
Page 1/27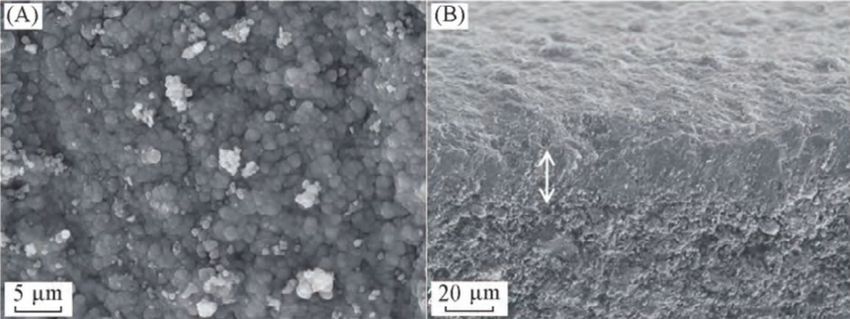
Abstract
Ethanol / Water Separation Technology is a long term research. LTA molecular sieve, which is an
industrially important desiccant as a kind of zeolite molecular sieve. It is always used in the reverse
osmosis method, which is one of the sea water desalination, and extraction of industrial ethanol method
in the world. Membrane separation technology is widely used in cell science[1, 2], human science[1, 2],
microbial science[3], military industry, battery technology[4, 5] and so on. With 2 years invention and
attempts, prototype membrane is finished and the filtered data has also been measured in different side,
such as Linda Type A(LTA) making temperature, raw material ratio of membrane preparation and filter
curves. The physicochemical analysis of the samples before and after filtration was carried out. The
manbrane filtration losses are very low and can be used with food grade filtration

1. Introduction
LTA molecular sieve, which is an industrially important desiccant as a kind of zeolite molecular sieve.
Membrane separation was first used in cytology[6] and is now widely known as its application in
seawater desalination[7, 8]. The field of biotechnology is developing rapidly, but 4A molecular sieves is
rarely used in food. The design and experiment are based on food-grade applications, and the food-grade
filtration membrane was synthesized innovatively, then the loss of membrane filtration was also
analyzed.

Membrane separation technology

The technology of membrane separation apply to different pressure and different concentration, then
separate substances as potential differences[9, 10]. That is to say, molecular sieving and selective
adsorption[11] and separation molecular sieving[12] mainly apply to the voids in the membrane layer to
sieving substances to achieve separation. The difference in particle size of the material is used to select a
membrane material with a suitable pore structure with a particle size larger than the pore size.
Substances smaller than the membrane pore size pass through the membrane to the other side under the
driving force. According to different retention, it is divided into surface retention and internal retention[13].

Now, there are several methods for alcohol free beer or low alcohol beer production. physical methods
such as vacuum distillation[14], Reverse Osmosis[15, 16] and Osmotic Distillation[17]. Membrane-based
processes include Reverse Osmosis, Nanofiltration[18–20], Dialysis and Pervaporation[21]. And the
vacuum evaporation is the cheapest and the most common process[22].And in wine industry,
Electrodialysis[23, 24], Reverse Osmosis, Membrane Contactor are frequently used, but the cross-flow
microfiltration(CFMF)[25–27] are widely put into use. However, in the development of CFMF membrane
filtration, wine has long been affected by membrane contamination. The main consequences of this
pollution are poor film performance, high cost, and excessive residue of some wine components, which
may lead to the loss of certain sensory properties[28–30]

                                                    Page 2/27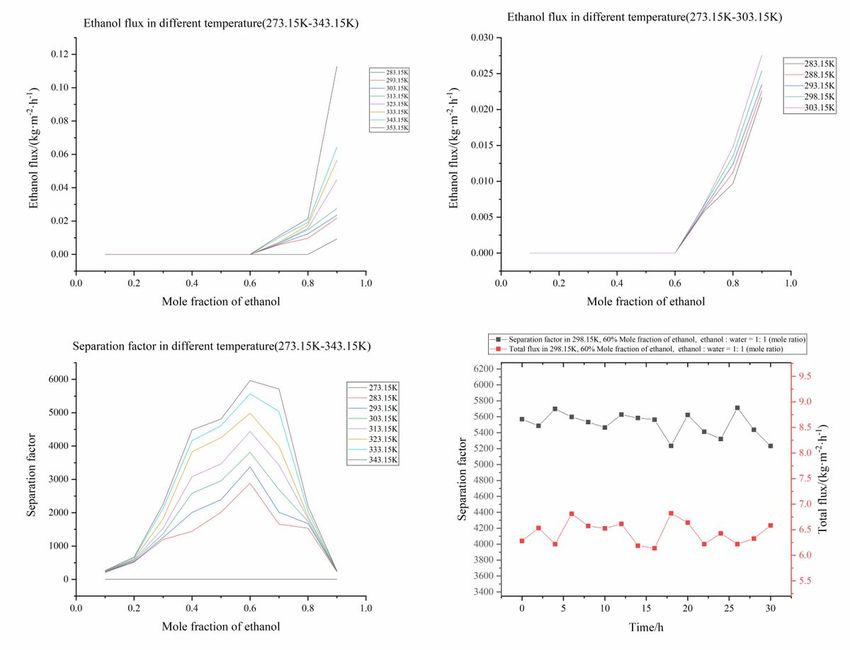
This design adopts LTA molecular sieve (4A molecular sieve). The LTA molecular sieve membrane has
been confirmed due to excellent performance in ethanol / water separation, and can be used under higher
working temperature and organic solvent conditions[31–33]. Zeolite membranes are widely used in the
field of separation due to their excellent thermal, chemical stability, regular pore structure, and marvellous
selectivity of adsorption. Zeolite membranes applied in the food industry will not face the above-
mentioned problems. Pure silica zeolite membranes (Silicalite-1 and Silicalite-2)[34] have strong
hydrophobicity because they do not contain aluminum in the skeleton, and they have preferential
adsorption properties for ethanol, so they can be used in fermentation to produce ethanol-permeable
processes.

2. Materials And Methods
2.1. Materials
The main reagents used in this experiment is to make LTA membrane. Sodium metaaluminate (NaAlO2),
sodium hydroxide (NaOH), deionized water, sodium silicate. Nonahydrate (NaSiO3.9H2O) is prepared for
LTA membrane.

The main sample liquor is alcohol solution and red wine.

2.2. Preparation of LTA powder
LTA molecular sieve membrane is widely used in industry to selectively remove water from organic matter
by pervaporation[35]. For LTA molecular sieves, the maximum dynamic diameter of molecules capable of
diffusing in their channels is 0.42 nm. The ethanol molecular dynamics ranges from 0.47 to 0.51 nm, and
the water molecular dynamics begin from 0.27 nm, then until to 0.32 nm. Therefore, ethanol molecules
cannot pass through the pores because of the dynamic diameter larger than the pore size of LTA, but
water molecules However, because of its small dynamic diameter, it can pass smoothly, thus realizing
"molecular sieve"[36, 37].

The method is that the LTA seed is synthesized by hydrothermal method. The material ratio of the seed
liquid is n (Na2O): n (Al2O3): n (SiO2): n (H2O) = 3.5: 1: 2: 125. The concrete synthetic measures: dissolve
8.00g NaOH in 18mL H2O, add 9.36 g NaAlO2 and stir until clear[38, 39]. Slowly add 13.73 g silica sol
under vigorous stirring conditions, and stir at 25℃ for 1 h to mix the reactants 5 h. After homogenization,
transferred into a 50 mL stainless steel reactor with a polytetrafluoroethylene lining, and allowed to stand
at 100℃ for 1.5 hours. The final product was dried at 60℃ after washing three times with deionized
water.

Preparation of LTA molecular sieve membrane: The LTA molecular sieve membrane is prepared by the
secondary growth method, and the reaction solution is according to the preparation method of the LTA
seed solution and n (Na2O): n (Al2O3): n (SiO2): n (H2O) = 2: 1 : 2: 135. Specific steps: Place the pre-
coated ceramics vertically in the reaction kettle, pour the reaction solution, and crystallize at 100℃ for 5
                                                   Page 3/27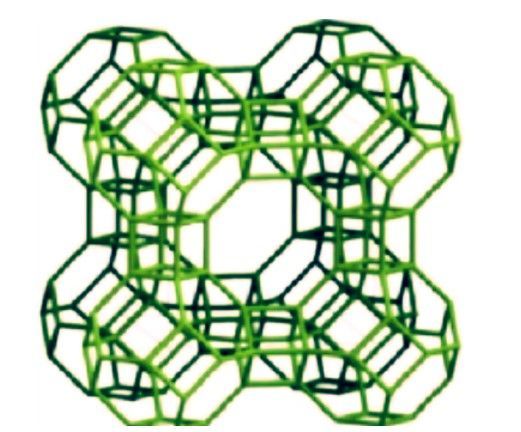
h. After the completion of the crystal, the reaction kettle was taken out, and it was rapidly cooled with tap
water. The molecular sieve membrane was dried at 60℃ after that it washed with deionized water and
soaked in deionized water for about 15 hours. The molecular sieve membrane preparation process is
shown in Figure 3.
2.4. LTA membrane separation performance test of ethanol
/ water mixed solution
The process of alcohol / water separation is carried out under normal temperature, and the separation
device is shown in Figure 10. The osmotic vapor-liquid separation test device is mainly composed of the
following parts: ① solution to be separated; ② peristaltic pump; ③ separation mold; ④ condenser; ⑤ vacuum
pump; ⑥ liquid chromatography. Put the prepared LTA membrane into the mold for sealing, connect the
peristaltic pump at one end to inject the solution to be separated into the mold to make it contact with the
membrane, and the solution that does not penetrate the membrane will continue to circulate back to the
container containing the solution; at the other end, decompress the system through the vacuum pump,
vaporize the solution through the membrane and collect it through the condensation device, and finally
send it to the chromatography for component analysis. The permeate flow of LTA membrane (Pi :
kg·m−2·h−1) is calculated by formula (1).

                                                         Mi
                                                Pi =
                                                        A × t

In the Formula, Mi is the mass of the permeate (unit: kg), A is the effective area of the membrane (unit:
m2), and t is the time of the separation process (unit: h). The selectivity of LTA membrane is evaluated by
calculating the separation factor (α I, J), which is calculated according to formula (2)

                                                        Xi/Xj
                                              αi, j =
                                                        Y i/Y j

2.5. Design and production of filtration equipment
There are 52 kinds of aroma components of sample (Cabernet Sauvignon) in dry red wines.[40] These
substances are measured by Solid Phase Microextraction (SPME)[41, 42] The molecular weight or
molecular diameter of all these aroma components are larger than the maximum kinetic diameter of the
molecules diffusing in the pore channel of LTA molecular sieve membrane (4A molecular sieve) by
0.42nm.Therefore, the wine is filtered through the pore of LTA molecular sieve membrane (4A molecular
sieve), and the water is filtered out to retain alcohol and aromatic components. Weigh the volume of
filtered water, calculate the percentage of residual alcohol in the original volume, i.e. the volume fraction
of existing solution alcohol, and conduct many times parallel experiments.

2.6 Reversed phase high performance liquid
chromatography(RP-HPLC)measuring organic acid change
                                                   Page 4/27
The wine sample was diluted 10 times with ultra pure water and filtered by 0.22 µm water microfiltration
membrane. The filtrate was to be tested
Chromatographic column: diamonsil C18 (4.6 mm × 250 mm, 5 µm); mobile phase A: 7% methanol, B:
0.01 mol / Na2P04 buffer (pH = 2.2); gradient elution: 1 min, 25% A, 0.01~4 min, 60% A, 4.01~7.0 min,
80% A, 7.01~12.0 min, 80A; flow rate: 0.6 mL/ min; column temperature: 25 ℃; injection volume: 20 µL;
detection wavelength: 210nm.With 11 organic acids as variables and wine samples as test objects,
principal component analysis was carried out by SPSS statistics.[43–45]
2.7 Determination of 20 amino acids in wine sample by
Reversed Phase High Performance Liquid Chromatography
The amino acids are derived into compounds which are good for separation and detection. DNFB pre
column derivatization is used to make amino acids absorbed at 360nm. At the same time, the
combination of DNFB and gradient elution program can be used for qualitative and quantitative
detection. The wine samples were centrifuged by freezing (12000r / min, 15min, 4 ℃), the supernatant
was taken, filtered by 0.45 µm water phase membrane and analyzed.[46, 47]
2.8 Comparison of antioxidant activity by Iron reduction
capacity experiment
Take 0.35 ml of 1, 0.5, 0.25, 0.125, 0.0625, 0.03125 wine samples of different dilution concentrations, add
PBS (625ml 0.2mol·mL−1 Na2H2P04 and 375ml 0.2mol NaH2P04, pH = 6.6) and 1% potassium
ferricyanide (K3[Fe (CN) 6]) into the corresponding volume, and cool to 25℃ in water bath at 50℃for
20min, then add 0.35ml 10% Trichloroacetic acid was centrifuged at 3000rpm for 10min, 1.2ml of
supernatant was taken, 1.2 ml of distilled water and 0.24ml of 0.1% FeCl3 were added respectively, and
the OD was measured at 700nm. Trolox was used as positive control. In the negative control, water is
used instead, and the rest is the same as the sample to be tested.[48]
2.9 Filtrate alcohol data accuracy detection
Distill with Italian machine Stillatore Elettronice Enochimico (DEE) distiller, carry out sampling inspection,
and check and verify the alcohol accuracy with the method of measuring alcohol accuracy with specific
gravity alcohol meter.
3. Results And Discussion
3.1 Characteristics of LTA membrane
LTA molecular sieve |Na12+(H2O)27|·[Al12Si12O48]8 has a three-dimensional eight-membered ring vertical
channel structure in Figure 4. It can be obtained from the XRD spectrum [Figure. 5 (a)] that the spectrum
of LTA molecular sieve seed is in good agreement with the standard spectrum, and there is no impurity
Page 5/27peak. It is proved that the seed is a pure phase of LTA molecular sieve. By controlling the synthesis
conditions, LTA molecular sieve crystal with uniform size is obtained as the seed for preparing membrane
materials. Follow the SEM picture [Figure. 5 (b)], it can be seen that the crystal is in cube shape with
uniform size, the diameter is 0.5-1 µm.
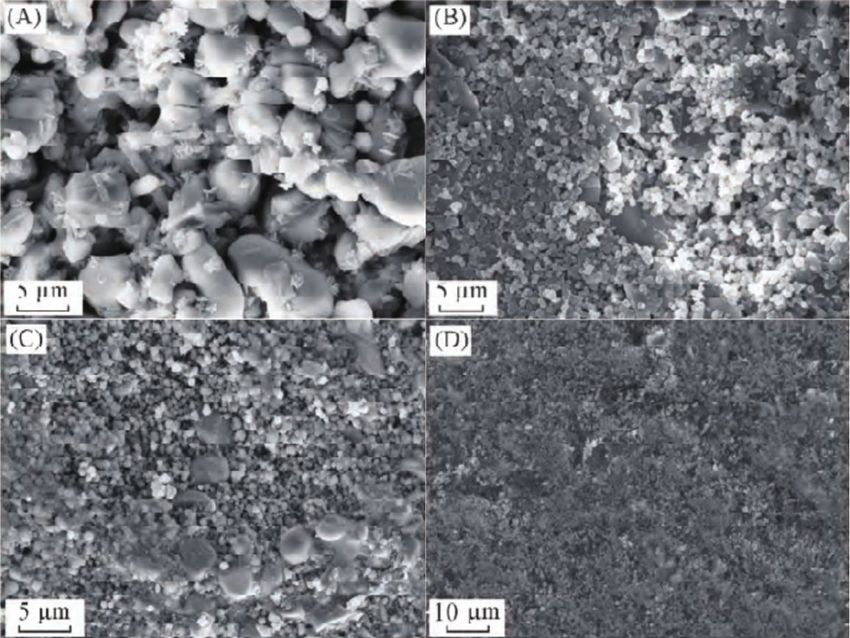
Scanning Electron Microscope (SEM) photos of LTA powder and LTA membrane are shown in Figure 6.
From Figure. 6 (a), it can be seen that the LTA powder crystal has a cubic shape with a size of 1-2µm and
a relatively uniform size distribution. It can be seen from Figure. 6 (b) that the thickness of LTA membrane
is small (about 5µm), which is the key to obtain high permeability flow. High permeability flow can ensure
that the separation process can be completed in a short time in industrial application, and it is a standard
to measure the quality of membrane. It can also be seen from the front photos of LTA membrane that the
membrane is continuous in large area, completely covered on the surface of the carrier, the crystals in the
membrane are completely mutual generated, and there are no defects visible to the naked eye [Figure. 6
(c) and (d)], which is the decisive factor to achieve high selectivity, while high selectivity is the guarantee
of high purity of industrial products, and it is also the first assessment Another important standard for the
quality of a membrane.
The X-ray Diffractometer (XRD) spectrum of LTA powder and LTA membrane is shown in Figure 7, which
is in good agreement with the characteristic peaks in the simulated LTA spectrum, and there are no other
characteristic peaks except for the carrier tube. It is further confirmed that the synthesized LTA powder
and LTA membrane are pure phase. At the same time, the high intensity of the diffraction peak indicates
that the crystals in the powder and the membrane have good crystallinity and the pore structure is
complete.
The surface of the support α - Al2O3 ceramic tube is rough and porous, and the pore size is 3-7 µ m
[Figure. 8 (A)]. The seed coating prepared by dip coating method has the smallest coverage ratio, some of
the pores are not filled, and there are a large number of exposed Al2O3 particles [Figure. 8 (B)].
Literature[49, 50] also reported that this method has a low membrane formation rate and needs many
hydrothermal synthesis. The seed liquid scraping method is used. The covering effect of seed preparation
layer is better than that of dip coating method, but there are still Al2O3 particles exposed [Figure. 8 (C)],
which may be due to the low viscosity of seed liquid, the seed is very loose on the surface of the body,
and easy to fall off. In order to enhance the adhesion between the seed and carrier of molecular sieve,
and prevent the crystal from falling off during synthesis, the seed preparation layer is prepared by seed
slurry scraping method[51]. It can be obtained from Figure. 8 (D) The seed layer is completely and
relatively dense on the surface of ceramic tube without exposed area. In the course of hydrothermal
synthesis, the synthetic liquid as a binder is expected to be transformed into molecular sieve crystal, or
provide the materials needed for the formation of molecular sieve membrane, which may not bring
additional resistance to the molecular sieve membrane. Molecular sieve synthetic liquid as a binder has
certain universality[52, 53].
Page 6/27In Figure 9, the molecular sieve membrane synthesized by the combination of scraping crystal seed slurry
and secondary growth method is relatively compact and flat, with a membrane thickness of about 20 µm
in Figure. 9(B)
3.1 Separation performance test of alcohol / water
The results of the alcohol / water separation performance test of the LTA membrane are shown in Figure
11. As can be seen from Figure 11 (a) and Figure 11 (b), the permeation flow rate of ethanol is generally
low, and it shows an increasing trend with the increase of the mole fraction of ethanol in the injection
solution. The flow rate gradually increases with increasing temperature. The penetration rate of water at
different temperatures is much higher than that of ethanol, but the change trend is the same. Because the
dynamic diameter of water molecules is smaller than that of ethanol molecules, it is easier to diffuse into
the pores of the membrane, so the infiltration flow rate of water is significantly higher than that of
ethanol. As the temperature increases, the thermal motion of the molecules increases, and the number of
molecules permeating the membrane, whether water or ethanol, will increase, leading to an increase in
osmotic flow. As the concentration of ethanol in the injection solution increases, the chance of ethanol
molecules entering the pores of the membrane increases, and at the same time, the passage of water
molecules is also inhibited. Therefore, the infiltration flow of ethanol shows an increasing trend, but water
is the opposite.
According to formula (2), the separation factor corresponding to different temperature conditions and
different ethanol concentrations in the injection solution can be calculated from the permeation flow
data. The results are shown in Figure 11 (c). It can be seen that the separation factor increases with the
increase of the test temperature, but under the 9 test temperature conditions, the best separation effect is
obtained when the ethanol mole fraction is 60%. When the ethanol concentration continues to increase,
the separation efficiency has Significantly reduced. In order to consider the stability of the LTA membrane,
a long-term continuous work test is required. See Figure 11 (d) for the curve of the total permeation flow
rate and separation factor of the membrane as a function of time when the alcohol: water = 1: 1
(substance amount ratio) in the injection solution at 25℃. The total permeation flow rate of the LTA
membrane fluctuates around 6kg·m−2·h−1, and the separation factor is basically stable at about 5,500,
which shows that the LTA membrane has very good thermal and mechanical stability and can be cycled
many times. It can be used repeatedly for many times, which is beneficial to industrial applications and
reduces production costs.
The composition of the feed liquid directly affects the solubility of the components in the pervaporation
membrane, which in turn affects the diffusion coefficient of the components in the membrane and the
final separation performance., With the increase of the concentration of the preferential osmotic
component in the feed liquid, the total osmotic flux and ethanol flux increase significantly while the water
flux is basically unchanged, because, as the ethanol concentration increases, the contact between
ethanol and the membrane surface increases As the adsorption capacity increases, the ethanol flux
increases; while the water concentration changes little with the increase or decrease in ethanol
concentration, the water flux remains basically unchanged. As the concentration of raw material ethanol
Page 7/27increases, due to the resistance of the membrane separation process, the concentration on the permeate
side does not increase linearly with the increase or decrease in the concentration of raw material ethanol,
resulting in the decrease in ethanol concentration with the increase in the concentration of raw material
side.
3.2 Formula deduction and testing
3.2.1 Formula deduction
Alcoholic aroma molecules and volatile molecules have molecular dynamics diameters larger than those
of water molecules, so only water molecules will be filtered at the other end of the filter, and alcohols and
other molecules have dynamic diameters greater than those of water molecules. It will not be filtered and
will remain at the end of the filter, so that the concentrated liquor will retain the original flavor and
chemical composition without being damaged by high temperature or chemical concentration. After
being filtered, the concentrated liquid can be obtained by weighing the quality of filtered water,
evaporating and cooling to obtain the liquid remaining on the filter (LTA membrane), so as to obtain the
concentrated sample.
The final product alcohol degree is expressed by formula 3
ma
β =
ma
∗ 100% ∗ ma + mw
ma+(mb−mq)+mc
β is the alcohol of the final product, ma is the mass of the liquid left after filtration, mb is the mass of the
filtration equipment after filtration, mq is the mass of the filter equipment before filtration, mc is the mass
of the filtered liquid, mw is the quality of the distilled water added after filtration, mz is the initial liquid
mass of this confirmatory experiment, § is the alcoholic strength of the initial alcohol solution.
The control of alcohol level solves the shortcoming that the alcohol level of the product cannot be
accurately measured, and makes the alcohol level make products more in line with the market within a
controllable range. It can better save factory cost, save time consumption in alcohol level detection, and
reduce the measurement error of alcohol level.
According to Table 5. Alcohol error less than 1%.
3.2.2 Sample composition analysis before and after
3.2.2.1 Reversed phase high performance liquid chromatography(RP-HPLC) measuring organic acid
change
The organic acids in wine samples were determined respectively. Because of the differences between
bottles, the types and contents of organic acids were also different.
According to Table.6, the total amount of organic acid will be reduced after filtration, but the reduction
proportion is less than 10%, which can be judged as the normal loss of organic acid in the filtration
Page 8/27process. Both VC and fumaric acid are trace, so it is impossible to judge how much they are reduced.
Tartaric acid loss is the lowest in the detection, about 2%, and the most important tartaric acid loss in
wine sample is the lowest, which ensures the quality of wine samples after filtration.
Most of the filter liquid staying in the filter layer can not be recycled, which makes the loss of some
nutrients in wine samples inevitable. However, the loss rate of organic acids in the filtration process is
low. It can be concluded that organic acids perform well under the filtration of LTA membrane.
3.2.2.2 Determination of 20 amino acids in wine samples by Reversed Phase High Performance Liquid
Chromatography
The filtration loss rate of amino acids is about 2%. It can be seen that the loss percentage of amino acids
is greater than that of organic acids. However, only 2% of amino acids are lost, which has no significant
impact on the taste and nutritional value of wine samples. There is no direct large-scale loss of amino
acids in the table, which proves that the LTA The loss of amino acids in the process of membrane
filtration is not more than expected
3.2.2.3 Comparison of antioxidant activity by Iron reduction capacity experiment
In the experiment of iron reduction ability, antioxidants give electrons through their own reduction effect
to remove free radicals. The antioxidant in the sample can reduce Fe3+ of potassium ferricyanide (K3[Fe
(CN) 6]) to Fe2+, and form Prussian blue (Fe4 [Fe (CN) 6]3,) with ferric chloride, which has the maximum
absorbance at 700nm. Therefore, the antioxidant activity of potassium ferricyanide (K3[Fe (CN) 6]) can be
explained by measuring its reducing power. The stronger the reducing power is, the stronger the
antioxidant capacity is.
The IC50 of red wine samples is 0.033, which means that when the absorbance value is 0.5, the dilution
concentration of red wine samples is 0.033.
It can be seen from reducing power assist that the antioxidant capacity of wine samples has decreased,
but the reduction ratio is not high, which belongs to normal filtration loss. It is determined that the loss of
polyphenols and proteins in the filtration process results in a reduction ratio of less than 5%, which can
ensure that the vast majority of antioxidant substances remain, and the antioxidant components of wine
samples have a low loss in the filtration process.
4. Conclusion
The membrane separation of ethanol and water is very useful in the real society, but it has not fully
played its role in the wine of food. In this experiment, the LTA film is made gradually by making the LTA
powder. Finally, the alcohol filtration experiment of wine is carried out. According to many groups of data,
the formula is obtained, which realizes the data-based measurement of wine precision. The error of the
formula in this experiment is low, and it can be put into production. This experiment is not only limited to
the deduction of formula, but also more analysis of chemical components before and after wine
Page 9/27separation and filtration. The change of organic acids before and after filtration was measured by reverse
high performance liquid chromatography. Although the organic acids were lower than before filtration, the
quantity was smaller, less than 2%, and there was no significant change in the acidity and quality of wine.
The change of 20 kinds of amino acids in wine before and after filtration was determined by reverse high
performance liquid chromatography. The kinds of amino acids before and after filtration did not change.
Although the amount of amino acids decreased, it would not have a great impact on the stability of wine
within the controllable range, and the decrease was less than 2%. The antioxidant capacity of wine was
compared before and after. Although the antioxidant capacity of wine decreased, it still did not affect its
nutritional value and sensory value, and the degree of reduction was less than 2%.
However, the production of LTA membrane in this experiment has greatly reduced the cost of human
resources and saved time, human and financial resources. Due to the limited experimental capacity, more
chemical composition analysis and comparison in wine have not been well tested, but in the known
experimental results, all components of wine have declined after filtration. The filtration of this LTA
membrane will reduce the total amount of all components in wine, but the proportion of reduction is not
high, so this LTA membrane has the value of production.
5. Discussion
LTA molecular sieve, which is an industrially important desiccant as a kind of zeolite molecular sieve. It is
also called 3A, 4A, and 5A molecular sieves according to the differences in cations and pore sizes. In
other words, when the ethanol / water mixture flows through the LTA membrane, if it is collected at both
ends of the membrane, in principle, pure water and ethanol-free can be obtained under low energy
consumption and pollution-free conditions. This object is to realize the separation of ethanol / water by
preparing LTA zeolite molecular sieve material as a membrane on the outside boundary of alumina tube.
Kyohei Ueno et al.[54] have studied Hydrophobic pure-silica *BEA-type zeolite membranes by
hydrothermal synthesis using a secondary growth method and were applied to the separation of
alcohol/water mixtures by pervaporation (PV), which is excellent properties, high thermal stability, and
unique large pore structure.
Selective separation is a phenomenon in which a substance or substances in the separation component
preferentially penetrate the membrane layer due to the particularity of the membrane material and the
separation component. For instance, as Jin Wanqin et al[55]. studied the separation of water and
Dimethyl Carbonate (DMC) mixture by graphene oxide membrane[56, 57], they found that even if DMC
and water can pass through the gap of the ink oxide membrane, the water content is only 2% in DMC. The
flux of water in the water system is still greater than the flux of DMC, demonstrating that the graphene
oxide membrane can be passed through preferentially by water molecules. Yongsoon Shin et al.[58] have
studied highly selective supported graphene oxide membranes for water-ethanol separation, which shows
excellent water/ethanol at elevated temperatures.
Declarations
Page 10/27Competing interests statement:
The authors declare no competing interests.
References
1. Bracha, D., M.T. Walls, and C.P. Brangwynne, Probing and engineering liquid-phase organelles. Nat
Biotechnol, 2019. 37(12): p. 1435–1445.
2. Kopf, M., C. Schneider, and S.P. Nobs, The development and function of lung-resident macrophages
and dendritic cells. Nat Immunol, 2015. 16(1): p. 36–44.
3. Fujioka, Y., et al., Phase separation organizes the site of autophagosome formation. Nature, 2020.
578(7794): p. 301–305.
4. Hendriks, K.H., et al., High-Performance Oligomeric Catholytes for Effective Macromolecular
Separation in Nonaqueous Redox Flow Batteries. ACS Cent Sci, 2018. 4(2): p. 189–196.
5. Lu, W., et al., Porous membranes in secondary battery technologies. Chem Soc Rev, 2017. 46(8):
p. 2199–2236.
6. Uhlenhuth, E., CULTIVATION OF THE SKIN EPITHELIUM OF THE ADULT FROG, RANA PIPIENS. J Exp
Med, 1914. 20(6): p. 614–34.
7. Kallithrakas-Kontos, N.G., et al., Selective Membrane Complexation and Uranium Isotopes Analysis in
Tap Water and Seawater Samples. Anal Chem, 2018. 90(7): p. 4611–4615.
8. Fujiwara, M. and T. Imura, Photo Induced Membrane Separation for Water Purification and
Desalination Using Azobenzene Modified Anodized Alumina Membranes. ACS Nano, 2015. 9(6):
p. 5705–12.
9. Wang, X., et al., Poly(vinylidene Fluoride-Hexafluoropropylene) Porous Membrane with Controllable
Structure and Applications in Efficient Oil/Water Separation. Materials (Basel), 2018. 11(3).
10. Khulbe, K.C. and T. Matsuura, Thin Film Composite and/or Thin Film Nanocomposite Hollow Fiber
Membrane for Water Treatment, Pervaporation, and Gas/Vapor Separation. Polymers (Basel), 2018.
10(10).
11. Qi, B., et al., Strict molecular sieving over electrodeposited 2D-interspacing-narrowed graphene oxide
membranes. Nat Commun, 2017. 8(1): p. 825.
12. Huang, K., et al., Micropatterned Ultrathin MOF Membranes with Enhanced Molecular Sieving
Property. Angew Chem Int Ed Engl, 2018. 57(42): p. 13892–13896.
13. Han, J.L., et al., Functional graphene oxide membrane preparation for organics/inorganic salts
mixture separation aiming at advanced treatment of refractory wastewater. Sci Total Environ, 2018.
628-629: p. 261–270.
14. Labrado, D., et al., Identification by NMR of key compounds present in beer distillates and residual
phases after dealcoholization by vacuum distillation. J Sci Food Agric, 2020. 100(10): p. 3971–
3978.
Page 11/2715. Deshpande, S.S., et al., Freeze concentration of fruit juices. Crit Rev Food Sci Nutr, 1984. 20(3):
p. 173–248.
16. Stein, S., et al., Redox condition of saline groundwater from coastal aquifers influences reverse
osmosis desalination process. Water Res, 2020. 188: p. 116508.
17. De Francesco, G., et al., Effects of Operating Conditions during Low-Alcohol Beer Production by
Osmotic Distillation. J Agric Food Chem, 2014. 62(14): p. 3279–3286.
18. Braeken, L., B. Van der Bruggen, and C. Vandecasteele, Regeneration of brewery waste water using
nanofiltration. Water Res, 2004. 38(13): p. 3075–82.
19. Freger, V., Swelling and morphology of the skin layer of polyamide composite membranes: an atomic
force microscopy study. Environ Sci Technol, 2004. 38(11): p. 3168–75.
20. Yao, L., et al., Effects of fermentation substrate conditions on corn-soy co-fermentation for fuel
ethanol production. Bioresour Technol, 2012. 120: p. 140–8.
21. Labanda, J., et al., Membrane separation technology for the reduction of alcoholic degree of a white
model wine. LWT - Food Science and Technology, 2009. 42(8): p. 1390–1395.
22. Andrés-Iglesias, C., et al., Simulation and flavor compound analysis of dealcoholized beer via one-
step vacuum distillation. Food Research International, 2015. 76: p. 751–760.
23. Henriques, P., et al., Controlled freeze-thawing test to determine the degree of deionization required
for tartaric stabilization of wines by electrodialysis. Food Chem, 2019. 278: p. 84–91.
24. Martínez-Pérez, M.P., et al., Evaluating Alternatives to Cold Stabilization in Wineries: The Use of
Carboxymethyl Cellulose, Potassium Polyaspartate, Electrodialysis and Ion Exchange Resins. Foods,
2020. 9(9).
25. Oberholster, A., L.M. Carstens, and W.J. du Toit, Investigation of the effect of gelatine, egg albumin
and cross-flow microfiltration on the phenolic composition of Pinotage wine. Food Chem, 2013.
138(2-3): p. 1275-81.
26. Martínez-Lapuente, L., Z. Guadalupe, and B. Ayestarán, Effect of egg albumin fining, progressive
clarification and cross-flow microfiltration on the polysaccharide and proanthocyanidin composition
of red varietal wines. Food Res Int, 2017. 96: p. 235–243.
27. Kitani, H., et al., Dewatering of algal suspension using microfiltration with cross flow in the presence
of magnetite as a filter aid. Biotechnol Prog, 2020. 36(4): p. e2979.
28. BELLEVILLE, M.-P., et al., Fouling Colloids During Microporous Alumina Membrane Filtration of Wine.
Journal of Food Science, 1992. 57(2): p. 396–400.
29. Czekaj, P., F. López, and C. Güell, Membrane fouling during microfiltration of fermented beverages.
Journal of Membrane Science, 2000. 166(2): p. 199–212.
30. Vernhet, A., D. Cartalade, and M. Moutounet, Contribution to the understanding of fouling build-up
during microfiltration of wines. Journal of Membrane Science, 2003. 211(2): p. 357–370.
31. Ban, T., et al., Preparation of a Completely Oriented Molecular Sieve Membrane. Angew Chem Int Ed
Engl, 1999. 38(22): p. 3324–3326.
Page 12/2732. Huang, A., et al., Molecular-sieve membrane with hydrogen permselectivity: ZIF-22 in LTA topology
prepared with 3-aminopropyltriethoxysilane as covalent linker. Angew Chem Int Ed Engl, 2010.
49(29): p. 4958–61.
33. Huang, A., et al., Neutral and cation-free LTA-type aluminophosphate (AlPO(4)) molecular sieve
membrane with high hydrogen permselectivity. J Am Chem Soc, 2010. 132(7): p. 2140–1.
34. Lew, C.M., R. Cai, and Y. Yan, Zeolite thin films: from computer chips to space stations. Acc Chem
Res, 2010. 43(2): p. 210–9.
35. Kayler, Z.E., et al., Soil evaporation and organic matter turnover in the Sub-Taiga and Forest-Steppe of
southwest Siberia. Sci Rep, 2018. 8(1): p. 10904.
36. Booij, J.C., et al., The dynamic nature of Bruch's membrane. Prog Retin Eye Res, 2010. 29(1): p. 1–18.
37. Kang, C.C., et al., Single cell-resolution western blotting. Nat Protoc, 2016. 11(8): p. 1508–30.
38. Marmor, M.F., et al., Recommendations on Screening for Chloroquine and Hydroxychloroquine
Retinopathy (2016 Revision). Ophthalmology, 2016. 123(6): p. 1386–94.
39. Chaisaingmongkol, J., et al., Common Molecular Subtypes Among Asian Hepatocellular Carcinoma
and Cholangiocarcinoma. Cancer Cell, 2017. 32(1): p. 57-70.e3.
40. Zhao, P., et al., Characterization of the Key Aroma Compounds in Chinese Syrah Wine by Gas
Chromatography-Olfactometry-Mass Spectrometry and Aroma Reconstitution Studies. Molecules,
2017. 22(7).
41. Zhu, F., et al., Applications of in vivo and in vitro solid-phase microextraction techniques in plant
analysis: A review. Anal Chim Acta, 2013. 794: p. 1–14.
42. Azizi, A. and C.S. Bottaro, A critical review of molecularly imprinted polymers for the analysis of
organic pollutants in environmental water samples. J Chromatogr A, 2020. 1614: p. 460603.
43. Kritsunankul, O., B. Pramote, and J. Jakmunee, Flow injection on-line dialysis coupled to high
performance liquid chromatography for the determination of some organic acids in wine. Talanta,
2009. 79(4): p. 1042–9.
44. Regmi, U., M. Palma, and C.G. Barroso, Direct determination of organic acids in wine and wine-
derived products by Fourier transform infrared (FT-IR) spectroscopy and chemometric techniques.
Anal Chim Acta, 2012. 732: p. 137–44.
45. Mortera, P., et al., Multivariate analysis of organic acids in fermented food from reversed-phase high-
performance liquid chromatography data. Talanta, 2018. 178: p. 15–23.
46. Fiechter, G., D. Pavelescu, and H.K. Mayer, UPLC analysis of free amino acids in wines: profiling of on-
lees aged wines. J Chromatogr B Analyt Technol Biomed Life Sci, 2011. 879(17-18): p. 1361–6.
47. Wang, Y.Q., et al., Rapid HPLC analysis of amino acids and biogenic amines in wines during
fermentation and evaluation of matrix effect. Food Chem, 2014. 163: p. 6–15.
48. Wu, N., et al., Antioxidant activities and xanthine oxidase inhibitory effects of extracts and main
polyphenolic compounds obtained from Geranium sibiricum L. J Agric Food Chem, 2010. 58(8):
p. 4737–43.
Page 13/2749. Mamaghani, A.H., F. Haghighat, and C.S. Lee, Hydrothermal/solvothermal synthesis and treatment of
TiO(2) for photocatalytic degradation of air pollutants: Preparation, characterization, properties, and
performance. Chemosphere, 2019. 219: p. 804–825.
50. Zargazi, M. and M.H. Entezari, Sonochemical versus hydrothermal synthesis of bismuth tungstate
nanostructures: Photocatalytic, sonocatalytic and sonophotocatalytic activities. Ultrason Sonochem,
2019. 51: p. 1–11.
51. Tilley, S.D., A. Selloni, and T. Hisatomi, Preface to Special Issue of ChemSusChem-Water Splitting:
From Theory to Practice. ChemSusChem, 2019. 12(9): p. 1771–1774.
52. Dong, R., et al., Sequence-defined multifunctional polyethers via liquid-phase synthesis with
molecular sieving. Nat Chem, 2019. 11(2): p. 136–145.
53. Dong, R., et al., Author Correction: Sequence-defined multifunctional polyethers via liquid-phase
synthesis with molecular sieving. Nat Chem, 2019. 11(2): p. 184.
54. Ueno, K., et al., Hydrophobic *BEA-Type Zeolite Membranes on Tubular Silica Supports for
Alcohol/Water Separation by Pervaporation. Membranes (Basel), 2019. 9(7).
55. Huang, K., et al., A graphene oxide membrane with highly selective molecular separation of aqueous
organic solution. Angew Chem Int Ed Engl, 2014. 53(27): p. 6929–32.
56. Protsak, I., et al., Cleavage of Organosiloxanes with Dimethyl Carbonate: A Mild Approach To Graft-to-
Surface Modification. Langmuir, 2018. 34(33): p. 9719–9730.
57. Lee, S.J.R., et al., Projection-Based Wavefunction-in-DFT Embedding. Acc Chem Res, 2019. 52(5):
p. 1359–1368.
58. Shin, Y., et al., Highly Selective Supported Graphene Oxide Membranes for Water-Ethanol Separation.
Sci Rep, 2019. 9(1): p. 2251.
Tables
Table 1 . Change of β when mw = 100
Page 14/27§ mz β ma mb mq mc mw X
11.50% 100.23 0.148562922 15.23 119.49 111.47 76.98 100 1
11.50% 100.11 0.139357346 14.22 112.45 111.47 84.91 100 2
11.50% 100.02 0.167377295 17.23 110.55 111.47 83.71 100 3
11.50% 99.99 0.133888625 13.65 115.93 111.47 81.88 100 4
11.50% 100.14 0.142377878 14.54 112.01 111.47 85.06 100 5
11.50% 100.64 0.13512061 13.78 116.35 111.47 81.98 100 6
11.50% 100.21 0.140220622 14.32 115.17 111.47 82.19 100 7
11.50% 100.11 0.139646047 14.25 112.22 111.47 85.11 100 8
11.50% 100.03 0.151455308 15.54 118.78 111.47 77.18 100 9
Table 2 . Change of β when mw = 200
§ mz β ma mb mq mc mw X
11.50% 100.25 0.072362119 14.63 113.43 111.47 83.66 200 1
11.50% 100.24 0.073188133 14.80 112.98 111.47 83.93 200 2
11.50% 100.80 0.072317032 14.62 113.56 111.47 84.09 200 3
11.50% 100.41 0.071148296 14.38 114.02 111.47 83.48 200 4
11.50% 99.56 0.069982739 14.14 113.49 111.47 83.4 200 5
11.50% 99.34 0.073476146 14.86 112.34 111.47 83.61 200 6
11.50% 100.17 0.074012897 14.97 112.57 111.47 84.1 200 7
11.50% 100.85 0.072803845 14.72 113.25 111.47 84.35 200 8
11.50% 100.69 0.069643913 14.07 114.53 111.47 83.56 200 9
Page 15/27Table 3 . Change of β when mw = 400
§ mz β ma mb mq mc mw X
11.50% 100.47 0.035934927 14.45 113.25 111.47 84.24 400 1
11.50% 100.08 0.035267852 14.18 114.22 111.47 83.15 400 2
11.50% 100.84 0.035147021 14.13 113.74 111.47 84.44 400 3
11.50% 100 0.037066031 14.91 112.89 111.47 83.67 400 4
11.50% 100.59 0.036180242 14.55 113.74 111.47 83.77 400 5
11.50% 100.23 0.034873766 14.02 114.46 111.47 83.22 400 6
11.50% 100.36 0.036254514 14.58 113.27 111.47 83.98 400 7
11.50% 100.83 0.0353439 14.21 113.78 111.47 84.31 400 8
11.50% 100.86 0.034998201 14.07 114.36 111.47 83.9 400 9
Table 4 . Change of β when mw = 800
Page 16/27§ mz β ma mb mq mc mw X
11.50% 100.36 0.017791412 14.27 113.57 111.47 83.99 800 1
11.50% 100.5 0.017642744 14.15 113.31 111.47 84.51 800 2
11.50% 100.28 0.018336875 14.71 113.78 111.47 83.26 800 3
11.50% 100.78 0.018163523 14.57 113.84 111.47 83.84 800 4
11.50% 100.89 0.018250571 14.64 113.44 111.47 84.28 800 5
11.50% 100.65 0.018585269 14.91 113.24 111.47 83.97 800 6
11.50% 100.87 0.01782863 14.30 114.06 111.47 83.98 800 7
11.50% 100.13 0.01789038 14.35 113.87 111.47 83.38 800 8
11.50% 100.02 0.017530904 14.06 113.25 111.47 84.18 800 9
11.50% 100.71 0.018324606 14.7 113.96 111.47 83.52 800 10
11.50% 100.54 0.018027137 14.46 113.57 111.47 83.98 800 11
11.50% 100.59 0.017493358 14.03 114.55 111.47 83.48 800 12
Table 5.Calculate alcohol by formula and Alcohol accuracy measured by machine
Page 17/27Sample Calculate alcohol by formula Alcohol accuracy measured by machine Data Error
1 0.140220622 0.139760979 0.996722
2 0.073188133 0.07283986 0.9952414
3 0.073476146 0.072938183 0.9926784
4 0.037066031 0.036907435 0.995721272
5 0.036254514 0.035947935 0.9915437
6 0.034998201 0.032342583 0.9241213
7 0.018163523 0.018013493 0.99174
8 0.018585269 0.018481192 0.9944
9 0.018324606 0.018205533 0.993502
Table.6 Table of test data before and after organic acid content of three samples
Page 18/27Content of organic acids in wine (g / L)
Sample Sample1 Sample2 Sample3
Components
Before After Before After Before After
Tartaric acid 3.128 3.105 3.438 3.349 3.265 3.169
Malic acid 0.238 0.226 0.246 0.217 0.287 0.267
Succinic acid 1.211 1.196 2.978 2.792 2.35 2.165
Malonic acid 0.518 0.501 0.411 0.358 0.556 0.459
Lactic acid 2.536 2.435 1.962 1.823 2.282 2.158
Quinic acid 0.322 0.311 0.328 0.286 0.343 0.316
Citric acid 0.318 0.294 0.119 0.094 0.24 0.164
Acetic acid 0.327 0.301 0.146 0.135 0.045 0.041
Vc trace trace trace trace trace trace
Fumaric acid trace trace trace trace trace trace
Total acid 8.596 8.369 9.628 9.054 9.368 8.739
Table.7 Comparison of amino acids before and after filtration
Page 19/27Types of amino content/(μmol·L-1)
acids
Sample1 Sample2 Sample3
Before After Before After Before After
Gly 37.6523 37.0782 37.2758 36.5174 34.5102 33.9016
Ala 37.6529 37.2284 36.8999 36.1421 34.5104 33.9006
Val 84.4522 83.4035 81.9186 80.2445 80.5973 79.2099
Leu 98.7430 97.6152 90.8435 88.9690 92.2467 90.6588
Ile 43.1802 42.6562 39.7257 38.9131 40.8211 40.1037
Phe 59.5268 58.4946 55.9552 54.8167 56.2734 55.3048
Trp 0.0000 0.0000 0.0000 0.0000 0.0000 0.0000
Tyr 0.0000 0.0000 0.0000 0.0000 0.0000 0.0000
Asp 66.6419 65.4862 61.0773 59.8397 63.0002 61.9158
Asn 66.6585 65.4977 65.7612 64.4248 63.0141 61.9294
Glu 201.6585 198.0568 187.9659 184.1652 192.4476 189.0967
Lys 81.6542 80.7368 76.1152 78.0000 77.1914 75.8680
Gln 51.6548 50.8674 47.6077 46.6454 50.5524 49.6822
Met 61.6472 60.5713 57.4647 56.3033 60.0772 59.0430
Ser 94.5448 93.0877 91.8626 90.0057 92.2115 90.5905
Thr 62.4987 61.5458 60.8238 59.5944 59.2194 58.2002
Cys 98.6542 97.2210 96.8158 94.8590 94.1879 92.5665
Pro 65988.5870 65022.7549 60813.7620 59549.5844 63001.1409 61914.8996
His 71.6549 70.7870 68.4173 67.0117 66.4852 65.3408
Arg 438.2138 432.8973 401.6412 393.3874 406.6082 399.6091
Page 20/27Figures
Figure 1
Process for the fabrication of continuous and compact LTA membrane on α-Al2O3 tube
Figure 2
Schematic diagram of LTA membrane separation unit
Page 21/27Figure 3
The LTA vertical channel structure
Page 22/27Figure 4
XRD patterns of (a) simulated LTA structure; (b) LTA power; (c) LTA membrane and (d) substation tube
Page 23/27Figure 5
a SEM picture of (a) LTA power; (b) cross section of LTA membrane; (c) and (d) top view of LTA
membrane of different magnification
Page 24/27Figure 6
SEM images of α-Al2O3 (A) and seeded support by dip-coating seed suspension (B), rubbing seed
suspension with shaving (C) and rubbing seed past with shaving (D)
Page 25/27Figure 7
SEM images of zeolite membranes after filtering from the top view (A) and cross section view (B)
Figure 8
The curves obtained versus mole fractions of ethanol at 25℃ (a) flux of ethanol, (b) flux of water and (c)
separation factor; (d) curves of total flux and separation factor versus time
Page 26/27Figure 9
Reducing power assay, The Before is the curve measured by unfiltered sample, The After 1 is the curve
measured by filtered sample 1, The After 2 is the curve measured by filtered sample 2, The Aft
Page 27/27You can also read