A Data Mining based Model for Detection of Fraudulent Behaviour in Water Consumption - Next Hop
←
→
Page content transcription
If your browser does not render page correctly, please read the page content below
2018 9th International Conference on Information and Communication Systems (ICICS)

           A Data Mining based Model for Detection of
           Fraudulent Behaviour in Water Consumption

                    Qasem A. Al-Radaideh                                                      Mahmoud M. Al-Zoubi
          Department of Computer Information Systems,                          Department of Commutation and Information Technology,
                     Yarmouk University,                                                     Yarmouk Water Company,
                      Irbid 21163, Jordan                                                       Irbid 21110, Jordan
                       qasemr@yu.edu.jo                                                        mzoubi12@yahoo.com

    Abstract—Fraudulent behavior in drinking water consumption          citizens through restructuring and rehabilitation of networks,
is a significant problem facing water supplying companies and           reducing the non-revenue water rates, providing new sources and
agencies. This behavior results in a massive loss of income and         maximizing the efficient use of available sources. At the same
forms the highest percentage of non-technical loss. Finding             time, the Ministry continues its efforts to regulate the water
efficient measurements for detecting fraudulent activities has been     usage and to detect the loss of supplied water [2].
an active research area in recent years. Intelligent data mining
techniques can help water supplying companies to detect these                Water supplying companies incur significant losses due to
fraudulent activities to reduce such losses. This research explores     fraud operations in water consumption. The customers who
the use of two classification techniques (SVM and KNN) to detect        tamper their water meter readings to avoid or reduce billing
suspicious fraud water customers. The main motivation of this           amount is called a fraud customer. In practice, there are two
research is to assist Yarmouk Water Company (YWC) in Irbid city         types of water loss: the first is called technical loss (TL) which
of Jordan to overcome its profit loss. The SVM based approach           is related to problems in the production system, the transmission
uses customer load profile attributes to expose abnormal behavior       of water through the network (i.e., leakage), and the network
that is known to be correlated with non-technical loss activities.      washout. The second type is called the non-technical loss (NTL)
The data has been collected from the historical data of the             which is the amount of delivered water to customers but not
company billing system. The accuracy of the generated model hit         billed, resulting in loss of revenue [3].
a rate of over 74% which is better than the current manual
prediction procedures taken by the YWC. To deploy the model, a              The management of the Yarmouk Water Company (Jordan)
decision tool has been built using the generated model. The system      has a significant concern to reduce its profit losses, especially
will help the company to predict suspicious water customers to be       those derived from NTLs, which are estimated over 35% in the
inspected on site.                                                      whole service area in the year 2012. One major part of NLT is
                                                                        customer’s fraudulent activities; the commercial department
   Keywords— Fraud Detection, Data Mining, SVM, KNN, Water              manages the detection processes with the absence of an
Consumption.                                                            intelligent computerized system where the current process is
                                                                        costly, not effective nor efficient.
                        I.   INTRODUCTION
    Water is an essential element for the uses of households,               NTL is a serious problem facing Yarmouk Water Company
industry, and agriculture. Jordan, as several other countries in the    (YWC). In 2012 the NTL reached over 35%, ranging from 31%
world, suffers from water scarcity, which poses a threat that           to 61 according to districts, which results in a loss of 13 million
would affect all sectors that depend on the availability of water       dollars per year. Currently, YWC follows random inspections
for the sustainability of activities for their development and          for customers, the proposed model in this paper provides a
prosperity [1].                                                         valuable tool to help YWC teams to detect theft customers,
                                                                        which will reduce the NTL and raise profit.
    According to Jordan ministry of water and irrigation, this
issue always has been one of the biggest barriers to the economic           Literature has abundant research for Non-Technical Loss
growth and development for Jordan. This crisis situation has            (NTL) in electricity fraud detection, but rare researches have
been aggravated by a population increase that has doubled in the        been conducted for the water consumption sector. This paper
last two decades. Efforts of the ministry of Water and irrigation       focuses on customer’s historical data which are selected from the
to improve water and sanitation services are faced by                   YWC billing system. The main objective of this work is to use
managerial, technical and financial determinants and the limited        some well-known data mining techniques named Support Vector
amount of renewable freshwater resources [2].                           Machines (SVM) and K-Nearest Neighbor (KNN) to build a
                                                                        suitable model to detect suspicious fraudulent customers,
    To address these challenges, Jordan ministry of water and           depending on their historical water metered consumptions.
irrigation as in many other countries is striving, through the
adoption of a long-term plan, to improve services provided to

         978-1-5386-4366-2/18/$31.00 ©2018 IEEE                                                                                48
2018 9th International Conference on Information and Communication Systems (ICICS)
II. RELATED WORK Furthermore, they introduced two statistical estimators, which
This section reviews some of the applications of data mining are used to weigh customers’ trend and the non-constant
classification techniques in fraud detection in different areas consumption. The model assists in the identification of abnormal
such as Detection of Fraudulent Financial Statement, Fraud consumption which may arise from abnormal with no fraud so
Detection in Mobile Communication Networks, Detecting they can easily be re-billed, and fraud customers where adequate
Credit Card Fraud, and Fraud Detection in Medical Claims. For procedures can take place. The accuracy of the model reached
example, Kirkos et al. [4] proposed a model for detecting fraud 22%.
in financial statements, where three data mining classifiers were Filho et al. [15] implemented decision tree classification
used, and namely Decision Tree, Neural network and Bayesian technique in the detection of suspected fraud customers and
Belief Network. Shahine et al. [5] introduced a model for credit corrupted measurement meters. They used five months
card fraud detection; they used decision tree and support vector customers’ consumption data, where a classification of
machines SVM. In addition, Panigrahi et al. [6] proposed a customers to fraud and non-fraud were applied. The technique
model for credit card fraud detection using a rule-based filter, raised the hit rate a hit rate of 5% using current techniques to
Bayesian classifier, and Dempsters-Shafer adder. 40%.
Carneiro et al. [7] developed and deployed a fraud detection Jiang et al. [16] suggested an approach using Wavelet
system in a large e-tail merchant. They explored the combination techniques and a group of classifiers, to automatically detect
of manual and automatic classification and compared different fraud customers in electricity consumption. The wavelet
machine learning methods. Ortega et al. [8] proposed a fraud technique was used to express the properties of the meter
detection system for Medical claims using data mining methods. readings. These readings were used to build models using
The proposed system uses multilayer perceptron neural several classifiers, based on the assumption that abnormalities in
networks (MLP). The researchers showed that the model was consumption appear when fraud occurs. Cabral et al. [17]
able to detect 75 fraud cases per month. introduced a fraud detection system using data mining
Kusaksizoglu et al. [9] introduced a model for detecting techniques for high-voltage electricity customers in Brazil. The
fraud in mobile communication networks. The results showed used techniques used customers’ historical data to be compared
that the Neural Networks methods MLP and SMO found to give with the current consumption and present the possible fraud
best results. In addition, CHEN et al. [10] proposed and status. The customers are marked as below regular consumptions
developed an integrated platform for fraud analysis and and used to be investigated by company inspection team.
detection based on real time messaging communications in De Faria et al. [18] presented a use case of forensics
social media. investigation procedures applied to detect electricity theft based
Nagi et al. [11] [12] [13] introduced a technique for on tampered electronic devices. Viegas et al. [19] provided an
classifying fraudulent behavior in electricity consumption. The extended literature review with an analysis on a selection of
proposed method is a combination of two classification scientific studies for detection of non-technical losses in the
algorithms, Genetic Algorithm (GA) and Support Vector electric grid reported since 2000 in three well know databases:
Machine (SVM), which yield a hybrid model (named GA- ScienceDirect, ACM Digital Library, and IEEE Xplore.
SVM). The technique processed the past customers’ Coma-Puig et al. [20] developed a system that detects
consumption profile to reveal abnormal consumptions of the anomalous meter readings on the basis of models that are built
customers of Tenaga Nasional Berhad (TNB) electricity utility using some machine learning techniques using past data. The
in Malaysia. After an investigation, four categories were found system detects meter anomalies and fraudulent customer
(change of tenant, replaced the meter, faulty meter, and abundant behaviour (meter tampering), and it is developed for a company
house). An expert system was designed to remove such that provides electricity and gas. Richardson et al. [21]
customers by considering characteristics that distinguish introduced a novel privacy preserving approach to detecting
between these four customer’s categories and theft customers. energy theft detection in smart grids. Malicious behaviour is
This intelligent system hit rate reached 60% where they detected by calculating the Euclidean distance between energy
indicated that this model raised the detection of fraud activities output measurements from installation over a day. These
from 3% using current procedures in the company to, a hit rate distances are then clustered to identify outliers and potentially
of 60% after onsite inspection. malicious behaviour.
Ramos et al. [3] presented optimum-path forest classifier to The available literature related to detecting the fraudulent
detect fraud customers in electricity consumption. The classifier activities of Non-Technical Loss in water consumption is limited
was compared with other robust classifiers ANN, SVM-Linear, in comparison to other sectors such as electricity consumption
SVM-RBF. The results showed that OPF accuracy is similar to and financial issues. For example, Monedero et al. [22]
SVM-RBF but superior in training time, which enables real-time developed a methodology consists of a set of three algorithms
classification. The other two classifiers accuracy were not for the detection of meter tampering in the Emasesa Company (a
comparable. water distribution company in Seville).
León et al. [14] suggested a model that can reveal electricity Humaid [23] research is the only research conducted in the
fraud customers. The data was obtained from the Spanish Endesa Arabic region related to suspicious water consumption activities.
Company. The classification model is based on Generalized Humaid used data mining techniques to discover fraudulent
Rule Induction (GRI) and Quest Decision Tree methods. water consumption by customers in Gaza city. The historical
492018 9th International Conference on Information and Communication Systems (ICICS)
data of water consumption was used as a training dataset to build generalization; merely it stores the training tuples or instances
the intelligent model. The author focused on using support [25]. KNN works by comparing a given test tuple with the
vector machine SVM classifier and compared K-Nearest training tuples that are closest or similar. Therefore KNN is
Neighbour classifier (KNN), and Neural Network classifier based on analogy. The training tuples are stored as points in the
(ANN). As the monthly water consumption data are scattered n-dimensional pattern space, in the case of unknown test tuple,
over 44 tables, Humaid [23] unified it in one table representing KNN finds the k tuples that are closest to the test tuple, these
customers’ consumption for 144 months from 03/2000 to tuples are the K-nearest neighbors; the test tuple is classified by
02/2012. At the beginning of the period, the consumption was the majority voting of its k neighbors.
read every two months, so null values were appearing on the
The similarity can be measured using several distance
data, to overcome this, he divided the consumption by 2, and the
metrics such as the Euclidian distance. Let two tuples x1 = (x11,
result was taken as the related two months consumption equally.
Then an attribute is added to indicate the fraudulent status x12, ..., x1n) and x2 = (x21, x22, ..., x2n). The Euclidean distance (dist)
‘Fraud_Status’ as the class label for all customers. between x1 and x2 is computed using equation (1):
The customers who are recorded in the municipality of Gaza ( 1, 2) = 2
∑ni=1( 1 − 2 )2 (1)
as water theft have been manually marked with the label ‘YES’
in the field Fraud_Status, and the rest were labeled as ‘NO.' The To determine the best value for K, this can be achieved
data was filtered to remove inconsistency and noise cases. The experimentally; we start with k=1 and increment by 1 repeatedly
data is normalized using z-score to fit the SVM model. Similar until we obtain the minimum error rate [25].
to all fraudulent cases, the data classes are unbalanced. SVM has
a parameter set that can be used to the weight and balance the III. THE METHODOLOGY
two classes. The ratio for each class was calculated to compute The CRISP-DM (Cross Industry Standard Process for Data
the parameter values. The values were multiplied by 100 to Mining) [26] was adopted to conduct this research. The CRISP-
achieve a suitable ratio weight for SVM. The random sub- DM is an industry standard data mining methodology developed
sampling was applied to the samples with class label “NO” to by four Companies; NCR systems engineering, DaimlerChrysler
weight the classes for KNN and ANN. The results showed that AG, SPSS Inc. and OHRA. The CRISP-DM model consists of
SVM classifier has the best accuracy over the other two business understanding, data understanding, data preparation,
classifiers for the balanced samples either with consumption model building, model evaluation and model deployment.
feature alone or with all selected features, The season
consumption dataset was the most suitable for monthly and A. Business Understanding
yearly datasets because it takes into consideration the seasonal Yarmouk Water Company was established in July 2010; it is
consumption changes where the intelligent model raised the hit entirely owned by Water Authority of Jordan (WAJ), the
rate from 10% random inspection to 80%. This research showed concession area of the company is the northern governorates
that unbalanced samples gave the best accuracy for all Irbid, Mafraq, Jerash, and Ajloun. To achieve its business
classifiers. efficiently, YWC is structured into six directorates at
headquarter; these are the Commercial, Operational Support,
A. The Support Vector Machines (SVM) Classifier Technical Affairs, Finance, Human Resources and Information
Support vector machine (SVM) is a supervised classification Technology directorates. The company established ten branches
method. It works well for linear and non-linear data, and usable all over the concession region; each branch is responsible for
for numeric prediction in addition to classification. SVM has managing the distribution of water and customer affairs in its
been widely used in different applications (i.e., object designated area, these branches are called Regional
recognition, speaker identification, and hand-written digit Organizational Units (ROU’s).
recognition). While SVM training is relatively slow, it is highly
To understand customers’ billing process well, we collected
accurate, and the problem of overfitting is less in comparison to
and analyzed the information related to billing and fraud-
other classifiers.
fighting by interviews with the employees, documents review
SVM works by separating the training data by a hyperplane, and exploring the billing system. The customers’ bills are issued
due to the difficulty to separate the data in its original dimension. every three months period, the customers’ meter readings are
SVM uses non-linear mapping of the data into a higher divided into three groups, such that each group is read within one
dimension which enables the SVM to find hyperplanes that month. At the time of group reading the commercial department
separate the data efficiently. After that, SVM searches for the prepares the routes to be read by connecting with the Geographic
best separating hyperplane [24]. More details about this Information Systems GIS of the company. The teams who are
technique can be found in the literature and most data mining responsible for meter reading read the meters at the customers’
books [25]. properties. Once the reader gets the meter reading, he enters it
into the billing system on his own Handheld Unit, issue the bill
B. The K-Nearest Neighbour Classifier and submit it to the customer. In case of a problem (i.e., high
The K-nearest neighbor (KNN) is a type of lazy learners, in reading or low reading), the system does not print a bill. The
contrast to eager classifiers like Rule-Based, Decision Tree and HHU’s are connected to the server directly, and the billing data
SVM, where the classifier constructs the model when given the are transferred to the COBOL billing system through an
training set, so it becomes ready or eager to classify. Instead, intermediary Oracle application and FTP tools. In the next day,
KNN is a lazy learner when given a training set it does nothing the billing auditor in the commercial department audits the bills
and waits until the test set becomes available. It does not build a and solves the problems (i.e., high reading). When all problems
502018 9th International Conference on Information and Communication Systems (ICICS)
are solved the bills are approved. The legacy billing system was DIST_NO The district number
developed in the mid-1980’s using COBOL language. It is still TOWN_NO The village/town number
in service, and it is installed on a mainframe with OPEN-VMS CONS_NO Customer number
CONS_NAME Customer name
platform. Yarmouk Water Company implemented an HHU
INFRACTION_NO Infraction number
billing system in Oct 2011. This system is intended to issue the INFRACTION_DATE Infraction Date
bills in the field. The HHU billing system is integrated with the
COBOL-based billing system, and all the bills are computed and C. Data Preparation
issued from this system. This phase of the knowledge discovery needs huge efforts to
The commercial departments in the ROU’s try to fight theft prepare the data with high quality and suitable format to be used
of water. When a zone is supplied with water, a random later in the modeling phase. The data preparation phase includes
inspection is performed for the customers’ properties and water the following tasks: Data Preprocessing, Customer Filtering and
connections. If a theft case detected, they record the case on a Selection, Features Extraction, Data Normalization, and Feature
dedicated form document and return the form to the department, Adjustment.
and a penalty is imposed on that customer. • Data Preprocessing
B. Data Understanding The main steps of this phase are illustrated in Figure 1. The
The essential part of the data mining process is the data itself. consumption table of the historical customers’ data contains
The following sections characterize the structure and nature of around 16 million records for 109 thousand customers. It
the collected data. This paper is limited to the data collected from includes the consumptions for the interval from 1990 to the
the billing system which is mainly used for issuing the customer’ current time. The customers’ consumption records that are
water bills. Suitable COBOL programs have been developed to related to Qasabat Irbid ROU are around 1.5 million
extract the most important customers billing data into a text consumption records for around 90 thousand customers. The
format data files. Oracle tables are created with a similar format consumption data for the customers are stored in a vertical
to COBOL data files. The tables are the customers’ main format as shown in Figure 2.
information table, Customers’ water consumptions table and the
Customers’ payments table. The description of the Customers’
water consumptions table (relation) is presented in Table 1. Historical
C t ’d t
TABLE I. CUSTOMERS’ CONSUMPTIONS TABLE
Customers Filtering and
Column Description Selection
DIST_NO (PK) The district number
TOWN_NO (PK) The village/town number
CONS_NO (PK) Customer number Feature Extraction
BILL_NO The number of the bill
BILL_STAT The status of the bill
ISSUE_DATE Date of bill issue Data Normalization
PRINT_FLAG A flag mentions if the bill is printed
OLD_MET_PREV_RDNG The old meter previous reading
FORWARD_BAL The forward balance Feature Adjustment
ADVANCE_PMNT Advanced payment
OUTSTANDING_AMOUNT Outstanding balance
CALC_CONS_FLAG A flag mentions the consumption was calculated
Fig. 1. Data Preprocessing Framework.
METER_NO Water meter metal number
METER_STATUS Water meter valid or corrupted The customers’ profiles need to be formatted horizontally to
ISSUE_DATE Bill issue date train the model. A sample of processed customers’ profiles is
CONS_TYPE Customer service type (industrial, housing,..)
FROM_DATE Start of consumption period for the bill
presented in Figure 2, in which the customer's profile ordered by
TO_DATE end of consumption period for the bill the periods of consumption, the water cycles represent the
UNITS_CONS units consumed in cubic meter seasons (i.e., cycle number one in 2000 represents the
UNITS_CONS_VAL The price of the consumed water consumption of the last three months 1/10/2006-1/1/2007). This
SEWER_VAL The price of Sewerage service
METER_RENT The meter fees is fair for classification because the consumption varies
CYCLE_NO Consumption Cycle number according to the year seasons.
CYCLE_YY Consumption Cycle year
• Preparing the Fraudulent Data
• Collecting the Fraud Data
To extract the fraud customers’ profile, a new table is created
The theft case which is discovered by the fraud-fighting containing the client's number, the water consumption, and a
teams is manually processed on paper documents and MS Excel new attribute for fraud class. This attribute is filled with a value
sheets. The total theft data available are 4155 cases in Qasabat of ‘YES’. Another table for the normal clients is created, and the
Irbid ROU. The attributes of the fraud customers table are fraud class attribute is filled with the value “NO”. The two tables
illustrated in Table 2. are then consolidated into one table containing the customer ID,
consumption profile, and fraud class attributes. To filter the data,
TABLE II. THEFT CUSTOMERS TABLE COLUMNS. some preprocessing operations were performed such as
Column Description Eliminate redundancy, Eliminate customers having zero
512018 9th International Conference on Information and Communication Systems (ICICS)
consumption through the entire period, Eliminate new clients
who are not present during the whole targeted period, and
Eliminate customers having null consumption values. Filtering
the data resulted in a reduced original dataset of the non-fraud
customer to 16114 record and the fraud customers to 647
records.
Fig. 3. Normalized Customers consumption per year season.
When choosing K=1, the nearest neighbour is x4 with the
class label “Yes,” therefore the model predicts that class label
for x1 is “Yes” meaning that the customer is predicted as a
suspicious Fraud. Choosing K=3 the nearest neighbors are: x3,
x4, x5 with class labels “Yes,” “Yes,” and “No” respectively,
Fig. 2. Customers’ consumptions ordered by year and Cycle_No. therefore (using the majority voting technique) the predicted
class label for x1 is “Yes”, meaning that the customer is
• Data normalization and Feature Adjustment predicted as a suspicious fraud.
As the dataset has different scales, so it needs to be
normalized to be suitable for SVM training, there are different TABLE III. UNKNOWN CLASS LABEL TUPLE TO BE PREDICTED.
techniques for normalization; we used min-max technique [25]. i
The normalized dataset can be utilized by both SVM and KNN 1 2 3 4 5 6 7 8 9 10 11 12 13 14 15 16 17 18 19 20
algorithms, while SVM cannot use the not normalized one, it can xq 20 30 30 40 20 30 30 30 20 20 30 40 40 40 30 40 30 30 30 30
be for KNN. Figure 3 shows a sample of the normalized dataset
per year season.
TABLE IV. THE DISTANCE BETWEEN X1 AND THE TRAINING EXAMPLES.
The filtered dataset is unbalanced where the customers’
profiles with “Non-Fraud” class labels are 16114, and the x2 x3 x4 x5 x6
customers’ profiles with “Fraud” class labels are 647, this will Euclidian
193.641 71.225 65.207 68.586 77.679
result in poor classification. To balance the dataset we made Distance
random sub-sampling in the higher class yielding 647
customers’ profiles, and all the customers’ profiles with “Fraud” • The Support Vector Machine (SVM)
class are selected, the resulted training dataset is 1294 labeled In practice we can use the learned SVM model to evaluate
customers’ profiles. whether the customer is suspected fraud or not, this can be
achieved by retrieving the customer’s profile from the database
D. Model Building using SVM and KNN Classifiers
and compare it to the fraud model.
To build the models we used the dataset resulted from the
data preprocessing phase which contains 1294 customers’ IV. EXPERIMENTS AND EVALUATION
profiles. This section presents the experiments, results, and
• The K-Nearest Neighbours (KNN) model evaluation. The goal of this research is detecting frauds using
customers’ historical data. For this purpose, model building
The models were built using SVM and KNN algorithms. In phase is carried out using both the SVM and KNN classification
the dataset there are two classes of customers’ profiles (Fraud techniques. For the experimentation purposes, the WEKA 3.7.10
and Not Fraud) the customers class labels are unbalanced where data mining tool was used [27]. To achieve the process of model
the known fraud customers compared to normal are 2:10000 this building, 1294 customers’ profile dataset was used for training
will result in a poor classification accuracy, balancing the dataset the SVM and KNN models, k-fold cross-validation and holdout
is mandatory for the model to perform well, a random sub- methods for training and testing.
sampling is used in the higher class (non-fraud) to balance the
dataset, and all filtered fraud customers are selected for use in The model is trained using the default classifiers parameters.
the training of the models. Let us assume we have an unknown The SVM and KNN training and testing were done using 10-fold
class label tuple as shown in Table 3. Table 4 shows the cross-validation and holdout methods. We analyzed the results,
Euclidian Distance measure, which presents the distance specifically the accuracy and a hit rate of classifying the
between x1 and some other tuples from the training data. customers into frauds or non-frauds classes. We recorded the
accuracy results for each model and compared their performance
in classifying new unseen tuples.
522018 9th International Conference on Information and Communication Systems (ICICS)
• Building the SVM Model Predicted Accuracy
To build the SVM model, we used SVMLIB 1.0.6 library Fraud Not Fraud %
[28] which is embedded within WEKA tool [29]. We used the Fraud 445 202 69
10-fold cross-validation, and the holdout methods with 75%- Actual
Not Fraud 186 461 71
25% for training and testing respectively.
Accuracy % 70 69 70.01
In the first experiment, we used the 10-fold cross validation
for training and testing, which is the default parameter of the
algorithm. Table 5 shows the confusion matrix of this model. The summary of the results of the experiment for the two
The confusion matrix shows that SVM model scored an classification techniques is shown in Table 7. The accuracies of
accuracy of 71%. This result exhibits that 920 records out of SVM and KNN are 71%, 70% respectively using 10-fold cross-
1294 records were correctly classified, and 374 records out of validation method for training and testing. This shows that the
1294 records were misclassified. accuracy of the SVM model is slightly higher total accuracy than
the KNN model. The fraud records correctly classified by SVM,
In the second experiment, we modified the test option to and KNN models are 61%, 68% respectively which presents that
Holdout, that is, to split the input tuples into a separate training KNN model is better in classifying fraud records than SVM.
set and testing set. This is intended to measure the classifier’s
accuracy when changing the training and testing parameters. Using holdout method for training and testing, the accuracies
The parameter split percentage was set to 75%; this means that of SVM and KNN model are 72%, 74% respectively. This shows
75% of the original dataset is used for training and 25% for that KNN model is slightly higher total accuracy than SVM
testing. The results accuracy was 72.4. model. The fraud records correctly classified by SVM and KNN
models are 68%, 73% respectively which present that KNN
TABLE V. SVM CONFUSION MATRIX, USING CROSS VALIDATION
model is better in classifying fraud records than SVM. From the
experiments, we can say that both SVM and KNN classifiers are
Predicted Accuracy a close performance in fraud detection.
Fraud Not Fraud %
TABLE VII. ACCURACY AND HIT RATE OF SVM AND KNN CLASSIFIERS
Fraud 394 253 61
Actual
Not Fraud 121 526 81 Classification Recall
Accuracy Training & Test option
Accuracy % 76.5 67.5 71.1 Method (Fraud)
SVM 71.1% 61%
10-fold Cross Validation
• Building the KNN Model KNN 70.0% 68%
To build the KNN model, we used the IBK algorithm which SVM 72.4% 68% Holdout 75% training &
is built-in in WEKA tool. We used the K-fold cross-validation, KNN 74.3% 73% 25% testing
and the holdout training and testing methods. In the first
experiment, the KNN model building was applied using the 10- • Deployment of The Prediction System
fold cross-validation, and the values of K iterated from 1 to 10. Figure 4 shows the main user interface for the system that
The best accuracy achieved when K value is 8, the confusion implements the model. The user is required to enter the customer
matrix is shown in Table 6. number, and the model compares the customer’s profile to
As we see from the resulting confusion matrix of this predict if the customer is a suspicious Fraud.
experiment, KNN accuracy is 70%. This shows that 906 (70%)
records out of 1294 records are correctly classified, while 388 V. CONCLUSION
(30%) records are misclassified. The resulting confusion matrix In this research, we applied the data mining classification
also shows that out of the total 647 non-fraud suspicious records techniques for the purpose of detecting customers’ with fraud
445 (68%) are correctly classified in their correct class, while behaviour in water consumption. We used SVM and KNN
202 (32%) records are incorrectly classified as fraud. In addition, classifiers to build classification models for detecting suspicious
out of 647 fraud customer records 461 (71%) are correctly fraud customers. The models were built using the customers’
classified, while 186 (29%) records are misclassified. The result historical metered consumption data; the Cross Industry
from this experiment shows that the model developed with KNN Standard Process for Data Mining (CRISP-DM).
model is slightly less accurate than SVM in classifying
customers’ profiles to correct class. The data used in this research study the data was collected
from Yarmouk Water Company (YWC) for Qasabat Irbid ROU
In the second experiment, we modified the test option to customers, the data covers five years customers’ water
Holdout so that we split the input tuples into a separate training consumptions with 1.5 million customer historical records for 90
set and testing set. This is intended to measure the classifier’s thousand customers. This phase took a considerable effort and
accuracy when changing the training and testing parameters. time to pre-process and format the data to fit the SVM and KNN
The parameter split percentage was set to 75%, which means that data mining classifiers.
75% of the original dataset is used for training and 25% for
testing. The results accuracy was 74.3. The conducted experiments showed that a good performance
of Support Vector Machines (SVM) and K-Nearest Neighbours
TABLE VI. TABLE 6: KNN CONFUSION MATRIX USING 8-FOLDS CV METHOD
(KNN) had been achieved with overall accuracy around 70% for
both. The model hit rate is 60%-70% which is apparently better
532018 9th International Conference on Information and Communication Systems (ICICS)
than random manual inspections held by YWC teams with hit communications on social networks”, IEICE Trans. Inf. & Syst., 2017,
rate around 1% in identifying fraud customers. This model Vol. E100–D, No.10, pp: 2267-2274.
introduces an intelligent tool that can be used by YWC to detect [11] J. Nagi, K. Yap, S. Tiong, S. Ahmed and A. Mohammad. “Detection of
abnormalities and electricity theft using genetic support vector
fraud customers and reduce their profit losses. The suggested machines”, In Proc. IEEE TENCON Region 10 Conf., 2008, pp.1-6.
model helps saving time and effort of employees of Yarmouk [12] J. Nagi, Mohammad A., Yap K., Tiong S., Ahmed S. “Non-Technical Loss
water by identifying billing errors and corrupted meters. With Analysis For Detection Of Electricity Theft Using Support Vector
the use of the proposed model, the water utilities can increase Machines”, In Proc IEEE 2nd International Power and Energy Conference,
cost recovery by reducing administrative Non-Technical Losses 2008, pp. 907-912.
(NTL’s) and increasing the productivity of inspection staff by [13] J. Nagi, K. Yap, S. Tiong., S. Ahmed, M. Mohamad. “Nontechnical loss
onsite inspections of suspicious fraud customers. detection for metered customers”, IEEE Transactions on Power Delivery,
2010, 25(2): 1162-1171.
[14] C. León, F. Biscarri, I. Monedero, J. Guerrero, J. Biscarri and R. Millán,
“Variability and trend-based generalized rule induction model to ntl
detection”, IEEE Transactions on Power Systems, 2011, 26(4):1798 -
1807.
[15] J. Filho, E. Gontijio, A. Delaiba, E. Mazina., J. Cabral, J and Pinto. “Fraud
identification in electricity company customers using decision tree”,
Systems, Man and Cybernetics, IEEE International Conference, 2004, 4:
3730 – 3734.
[16] R. Jiang, H. Tagiris, A. Lachsz. and M. Jeffrey “Wavelet-based features
extraction and multiple classifiers for electricity fraud detection”, In Proc.
IEEE/PES Transmission and Distribution Conf. Exhibit. 2002.
[17] J. Cabral, J. Pinto. E. Martins and A. Pinto, “Fraud detection in high
voltage electricity consumers”. 2008.
[18] R. De Faria, K. Ono Fonseca, B. Schneider and S. Nguang, “Collusion and
fraud detection on electronic energy meters - a use case of forensics
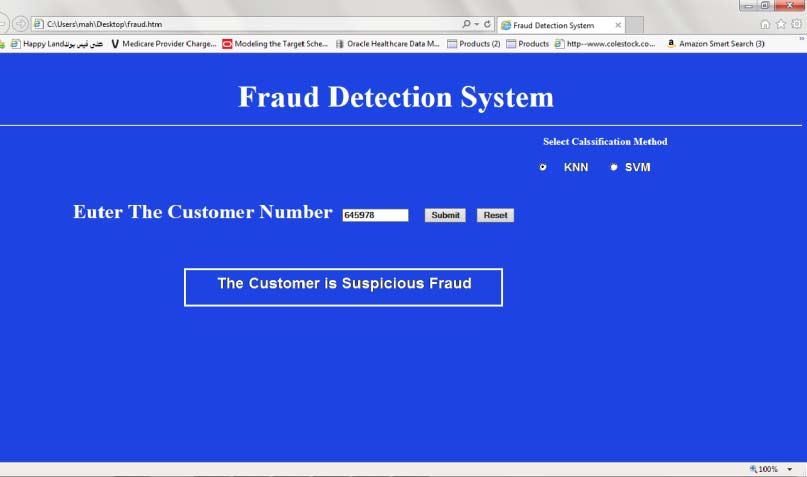
Fig. 4. The Prediction System of the Fraud Detection. investigation procedures”, in 2014 IEEE Security and Privacy Workshops,
pp. 65-68.
ACKNOWLEDGMENT [19] J. Viegas, P. Esteves, R. Melicio, V. Mendes and S. Vieira, “Solutions for
detection of non-technical losses in the electricity grid: a review”,
The authors would like to thank Yarmouk Water Company Renewable and Sustainable Energy Reviews, 2017, 80: 1256-1268.
for providing the data to be used for the purpose of this study. [20] B. Coma-Puig, J. Carmona, R. Gavald, S. Alcoverro, and V. Martin,
“Fraud detection in energy consumption: a supervised approach”. In Proc
REFERENCES IEEE Intl. Conf. on DSAA, 2016, pp. 120-129.
[1] N/A, “Jordan Water Sector Facts & Figures, Ministry of Water and [21] C. Richardson, N. Race, and P. Smith, “A privacy preserving approach to
irrigation of Jordan”. Technical Report. 2015. energy theft detection in smart grids”, 2016 IEEE International Smart
[2] N/A, “Water Reallocation Policy, Ministry of Water and irrigation of Cities Conference (ISC2), Trento, pp. 1-4.
Jordan”. Technical Report. 2016. [22] Monedero I., Biscarri F., Guerrero J., Roldán M., and León C. “An
[3] C. Ramos , A. Souza , J. Papa and A. Falcao, “Fast non-technical losses Approach to Detection of Tampering in Water Meters”, In Procedia
identification through optimum-path forest”. In Proc. of the 15th Int. Conf. Computer Science, 2015, 60: pp 413-421.
Intelligent System Applications to Power Systems, 2009, pp.1-5. [23] E. Humaid, “A data mining based fraud detection model for water
[4] E. Kirkos, C. Spathis and Y. Manolopoulos, “Data mining techniques for consumption billing system in MOG”, Islamic University of Gaza,
the detection of fraudulent financial statements”, Expert Systems with Deanery of higher Studies, Information Technology Program, Department
Applications, 32(2007): 995–1003. of Computer Science, Master thesis. 2012.
[5] Y. Sahin and E. Duman, “Detecting credit card fraud by decision trees and [24] C. Cortes and V. Vapnik, 1995. “Support-Vector Networks”, Machine
support vector machines”, IMECS, 2011, Vol I, pp. 16 – 18. Learning, 1995, 20(3): 273-297,
[6] S. Panigrahi, A. Kundu, S. Sural and A. Majumdar, “Credit card fraud [25] J. Han, M. Kamber, J. and Pei. Data mining: concepts and techniques, 3rd
detection: a fusion approach using dempster–shafer theory and bayesian Ed, Morgan Kaufmann. 2012.
learning, information fusion”, 2009, 10(4): 354–363. [26] P. Chapman, J. Clinton, R. Kerber, T. Khabaza, T. Reinartz, C. Shearer
[7] N. Carneiro, G. Figueira and Costa M., “A data mining based system for and R. Wirth, “CRISP-DM 1.0: step-by-step data mining guide”, SPSS
credit-card fraud detection in e-tail decision support systems”, Decision Inc., 2000, USA.
Support Systems, 2017, 95(C): 91-101. [27] I. Witten, E. Frank E., L. Trigg, M. Hall, G. Holmes and S. Cunningham.
[8] Ortega P., Figueroa C., and Ruz G. “A Medical Claim Fraud/Abuse “WEKA: practical machine learning tools and techniques with java
Detection System based on Data Mining: A Case Study in Chile”, In proc implementations”. In Proc the ICONIP/ANZIIS/ANNES Workshop on
of DMIN, 2006. Emerging Knowledge Engineering and Connectionist-Based Information
Systems. 1999, pp. 192–196.
[9] B. Kusaksizoglu, “Fraud detection in mobile communication networks
using data mining”, Bahcesehir University, The Department of computer [28] C. Chang and C. Lin, “LIBSVM: a library for support vector machines”.
engineering, Master Thesis. 2006. ACM Transactions on Intelligent Systems and Technology, 2011, 2:27:1-
-27:27.
[10] C. Liang-Chun, H. Chien-Lung, L.Nai-Wei, Y. Kuo-Hui and L. Ping-
Hsien, “Fraud analysis and detection for real-time messaging [29] Y. EL-Manzalawy and V. Honavar, “WLSVM: integrating LibSVM into
WEKA environment”. 2005.
54You can also read