Bounding the Effect of Partition Camping in GPU Kernels
←
→
Page content transcription
If your browser does not render page correctly, please read the page content below
Bounding the Effect of Partition Camping in GPU Kernels

                                                                                           ∗
                       Ashwin M. Aji                                  Mayank Daga                                Wu-chun Feng
                      aaji@cs.vt.edu                                 mdaga@cs.vt.edu                            feng@cs.vt.edu

                                                            Department of Computer Science
                                                                     Virginia Tech
                                                               Blacksburg, Virginia, USA

ABSTRACT                                                                             General Terms
Current GPU tools and performance models provide some com-                           Measurement, Performance, Experimentation
mon architectural insights that guide the programmers to write op-
timal code. We challenge and complement these performance mod-
els and tools, by modeling and analyzing a lesser known, but very                    Keywords
severe performance pitfall, called Partition Camping, in NVIDIA                      Partition Camping, Performance Modeling, Micro-benchmarks, Mul-
GPUs. Partition Camping is caused by memory accesses that are                        tiple Linear Regression, GPGPU
skewed towards a subset of the available memory partitions, which
may degrade the performance of GPU kernels by up to seven-fold.
There is no existing tool that can detect the partition camping effect               1.    INTRODUCTION
in GPU kernels.                                                                          Graphics processing units (GPUs) are being increasingly adopted
   Unlike the traditional performance modeling approaches, we pre-                   by the high-performance computing (HPC) community due to their
dict a performance range that bounds the partition camping ef-                       remarkable performance-price ratio. However, a thorough under-
fect in the GPU kernel. Our idea of predicting a performance                         standing of the underlying architecture is still needed to optimize
range, instead of the exact performance, is more realistic due to                    the GPU-accelerated applications [18]. Several performance mod-
the large performance variations induced by partition camping. We                    els have recently been developed to study the architecture of the
design and develop the prediction model by first characterizing the                  GPU and accurately predict the performance of the GPU-kernels [3,
effects of partition camping with an indigenous suite of micro-                      7, 8, 23]. Our paper both challenges and complements the existing
benchmarks. We then apply rigorous statistical regression tech-                      performance models by characterizing, modeling and analyzing a
niques over the micro-benchmark data to predict the performance                      lesser known, but extremely severe performance pitfall, called par-
bounds of real GPU kernels, with and without the partition camp-                     tition camping in NVIDIA GPUs.
ing effect. We test the accuracy of our performance model by ana-                        Partition camping is caused by kernel wide memory accesses
lyzing three real applications with known memory access patterns                     that are skewed towards a subset of the available memory par-
and partition camping effects. Our results show that the geometric                   titions, which may severely affect the performance of GPU ker-
mean of errors in our performance range prediction model is within                   nels [16, 17]. Our study shows that the performance can degrade
12% of the actual execution times.                                                   by up to seven-fold because of partition camping. Common op-
   We also develop and present a very easy-to-use spreadsheet based                  timization techniques for NVIDIA GPUs have been widely stud-
tool called CampProf, which is a visual front-end to our perfor-                     ied, and many tools and models are available to perform common
mance range prediction model and can be used to gain insights into                   intra-block optimizations. It is difficult to discover and character-
the degree of partition camping in GPU kernels. Lastly, we demon-                    ize the effect of partition camping, because the accessed memory
strate how CampProf can be used to visually monitor the perfor-                      addresses and the actual time of memory transactions have to be
mance improvements in the kernels, as the partition camping effect                   analyzed together. Therefore, traditional methods that detect sim-
is being removed.                                                                    ilar problems, such as static code analysis techniques to discover
                                                                                     shared memory bank conflicts or the approaches used in existing
Categories and Subject Descriptors                                                   GPU performance models, are prone to errors because they do not
                                                                                     analyze the timing information. To the best of our knowledge, we
C.4 [Performance of Systems]: Measurement techniques
                                                                                     are the first to characterize the partition camping effect in GPU ker-
∗Aji and Daga have contributed equally to this work.                                 nels.
                                                                                         In this paper, we deviate from the existing performance models
                                                                                     that predict the exact performance of a GPU kernel. Instead, we
                                                                                     predict a performance range for a given kernel, where its width
Permission to make digital or hard copies of all or part of this work for            will indicate the extent to which partition camping can exist in the
personal or classroom use is granted without fee provided that copies are            kernel. The upper and lower bounds indicate the performance lev-
not made or distributed for profit or commercial advantage and that copies           els with and without the partition camping problem respectively.
bear this notice and the full citation on the first page. To copy otherwise, to      The relative position of the actual kernel performance with respect
republish, to post on servers or to redistribute to lists, requires prior specific   to the predicted performance range will show the degree to which
permission and/or a fee.
CF’11, May 3–5, 2011, Ischia, Italy.                                                 the partition camping problem exists in the kernel. We believe that
Copyright 2011 ACM 978-1-4503-0698-0/11/05 ...$10.00.                                predicting a performance bound, rather than the exact performance
numbers, is more realistic due to the huge performance variations        data cache; a read-only constant memory cache; and a read-only
induced by partition camping.                                            texture memory cache. The global memory space is not cached by
   Next, we discuss our approach to design and develop the perfor-       the device.
mance range prediction model. We first characterize the effects of          CUDA (Compute Unified Device Architecture) [16] or OpenCL
partition camping by creating a suite of micro-benchmarks, which         (Open Computing Language) [9] are the more commonly used par-
captures the performance of all the different memory transaction         allel programming models and software environments available to
types and sizes, with and without the partition camping behavior.        run applications on the NVIDIA GPUs. Massively parallel code
Next, we use the data from the micro-benchmark suite and predict         can be written via simple extensions to the C programming lan-
a performance range that bounds the effect of partition camping in       guage. They follow a code off-loading model, i.e. data-parallel,
real GPU kernels. Our performance prediction model is designed           compute-intensive portions of applications running on the host pro-
by using rigorous statistical regression procedures. Lastly, we de-      cessor are typically off-loaded onto the device. The kernel is the
velop and present an extremely user-friendly spreadsheet based tool      portion of the program that is compiled to the instruction set of
called CampProf, which uses the data from our micro-benchmarks           the device and then off-loaded to the device before execution. The
and our performance prediction model and helps the user of the           discussions in this paper are not specific to any of the higher level
tool to visually detect and analyze the partition camping effects in     programming abstractions, and can be related to either the CUDA
the GPU kernels. CampProf is a visual front-end to our perfor-           or the OpenCL programming models.
mance range prediction model to gain insights into the effects of           Execution configuration of a kernel: The threads in the kernel
partition camping in GPU kernels. It must be noted that our per-         are hierarchically ordered as a logical grid of thread blocks, and
formance prediction model and the CampProf tool is not meant to          the CUDA thread scheduler will schedule the blocks for execution
replace any of the existing models and tool. They should rather be       on the SMs. When executing a block on the SM, CUDA splits
used in conjunction with the other existing tools, like NVIDIA’s         the block into groups of 32-threads called warps, where the entire
proprietary CUDA Visual Profiler (CudaProf) [15] and the CUDA            warp executes one common instruction at a time. CUDA schedules
Occupancy Calculator [11], to analyze the overall performance of         blocks (or warps) on the SMs in batches, and not all together, due
GPU kernels.                                                             to register and shared memory resource constraints. The blocks (or
   We then perform a detailed experimental analysis on three very        warps) in the current scheduled batch are called the active blocks
different GPU applications with known memory access patterns             (or warps) per SM. The CUDA thread scheduler treats all the active
and partition camping effects, ranging from the molecular mod-           blocks of an SM as a unified set of active warps ready to be sched-
eling domain to graph analysis libraries. We show that our perfor-       uled for execution. In this way, CUDA hides the memory access
mance prediction model has a geometric mean error of less than           latency of one warp by scheduling another active warp for execu-
12% when validated against their actual kernel execution times.          tion [16, 17]. It follows that the performance of a kernel with an
Next, we demonstrate the utility of the CampProf tool in real appli-     arbitrary number of blocks will be limited by the performance of
cations, and demonstrate how the tool can be used to monitor the         the set of active blocks (or active warps). So, in this paper, we have
performance improvement of the kernel after the partition camping        chosen ‘active warps per SM’ as the metric to describe the execu-
effect has been reduced.                                                 tion configuration of any kernel, because it is much simpler to be
   The rest of this paper is organized as follows: Section 2 provides    represented in only a single dimension.
background on the NVIDIA GPU architecture. Section 3 explains               There are some hardware restrictions imposed on the NVIDIA
our micro-benchmark design to characterize the partition camp-           GPUs with compute capability 1.2 and 1.3 that limits the possible
ing problem. Section 4 describes the performance modeling tech-          number of active warps that can be scheduled on each SM. The
niques using micro-benchmarks and statistical analysis tools, and        warp size for the current GPUs is 32 threads. The maximum num-
the CampProf tool. Section 5 explains the execution characteristics      ber of active threads per multiprocessor can be 1024, which means
of the chosen applications. Section 6 discusses the experimental         that the maximum number of active warps per SM is 32. Also,
results. Section 7 presents the related work. Section 8 concludes        the maximum number of threads in a block is 512, and the maxi-
the paper and proposes some future work.                                 mum number of active blocks per multiprocessor is 8 [16]. Due to
                                                                         a combination of these restrictions, the number of active warps per
2.    BACKGROUND ON THE NVIDIA GPUS                                      SM can range anywhere from 1 to 16, followed by even-numbered
                                                                         warps from 18 to 32.
   In this section, we will describe those aspects of the NVIDIA
                                                                            Global memory transactions: The global memory access re-
GPU that are relevant to the discussions in this paper. In this paper,
                                                                         quests by all threads of a half-warp are coalesced into as few mem-
we will restrict our discussions to GPUs with compute capability
                                                                         ory transactions as possible. The transactions can be from 32-byte,
1.2 or 1.3, so that the readers will not get distracted by the de-
                                                                         64-byte or 128-byte segments, based on the size of the word be-
tails of the other architecture families. Section 4.3 describes how
                                                                         ing accessed by the threads. The transaction size will then be re-
our performance model can be easily applied to the other NVIDIA
                                                                         duced, if possible. For example, if all threads in a half-warp ac-
GPU architectures.
                                                                         cess 4-byte words and the transaction size is 64 bytes, and if only
   The NVIDIA GPU (or device) consists of a set of single-instruction,
                                                                         the lower or upper half is used, the transaction size is reduced to
multiple-data (SIMD) streaming multiprocessors (SMs), where each
                                                                         32 bytes [16]. The transaction types can either be read or write,
SM consists of eight scalar processor (SP) cores, two special func-
                                                                         and each of these can have three transaction sizes (32-, 64- or 128-
tion units and a double precision processing unit with a multi-
                                                                         bytes), which means there are six possible memory transactions for
threaded instruction unit. The actual number of SMs vary depend-
                                                                         a kernel running on GPUs with compute capability 1.2 or 1.3.
ing on the different GPU models. The SMs on the GPU can simul-
                                                                            Note that these global memory transactions can also be triggered
taneously access the device memory, which consists of read-write
                                                                         in a multitude of other ways, but their performance will not be dif-
global memory and read-only constant and texture memory mod-
                                                                         ferent. For example, a 32-byte transaction can also be invoked if all
ules. Each SM has on-chip memory, which can be accessed by all
                                                                         the threads in a half warp access the same memory location of any
the SPs within the SM and will be one of the following four types:
                                                                         word size. CUDA will compute the least sized transaction for effi-
a set of registers; ‘shared memory’, which is a software-managed
D1?%E?896% GPU
Kernel
Characteris3cs
!"#$% !"#&% !"#'% !"#(% !"#&-% !"#'.% Tool
Coalesced
Bank
Arithme3c
Divergent
Par33on
Occupancy
Accesses
Conflicts
Intensity
Branches
Camping
(gmem) (smem)
CUDA
Visual
✓
✓
✓
✓
✓
"/0123%455/66/6% Profiler
✗
789:1;9%>1?%@=0A8?B%
CUDA
Occupancy
✓
✗
✗
✗
✗
!"# !$# !%# !&# !'# !(# !)# !*#
Calculator
✗
!"#$% !"#&% !"#'% !"#(% !"#)% !"#*% !"#+% !"#,%
CampProf
✗
✗
✗
✗
✗
!"#-% !"#$.% !"#$$% !"#$&% !"#$'% !"#$(% !"#$)% !"#$*% ✓
!"#$+% !"#$,% !"#$-% !"#&.% !"#&$% !"#&&% !"#&'% !"#&(%
!"#&)% !"#&*% !"#&+% !"#&,% !"#&-% !"#'.%
D4500
1 // TYPE can be a 2-, 4- or an 8-byte word
Execu&on
Time
(msec)
4000
2 __global__ void readBenchmark(TYPE *d_arr) {
3 int partitionSize = 256; // 256 bytes
3500
4 int elemsInPartition = partitionSize/sizeof(TYPE);
3000
5 TYPE readVal = 0;
2500
6
7 // Loop counter ’x’ ensures coalescing.
2000
7-fold 8 for(int x = 0; x < ITERATIONS; x += 16) {
1500
performance 9 /* all blocks read from a single partition
1000
degradation 10 to simulate Partition Camping */
11 int index = ((threadIdx.x + x)
500
12 % elemsInPartition);
0
13 // Read from global memory location
1
2
3
4
5
6
7
8
9
10
11
12
13
14
15
16
18
20
22
24
26
28
30
32
14 readVal = d_arr[index];
15 }
Ac&ve
Warps
per
SM
16 /* Write once to memory to prevent the above
17 code from being optimized out */
With
PC
Without
PC
18 d_arr[0] = readVal;
19 }
Figure 3: The NegativeEffect of Partition Camping in GPU
Kernels. PC: Partition Camping Figure 5: Code Snapshot of the Read Micro-benchmark for the
NVIDIA 200- and 10-series GPUs (With Partition Camping).
Note: ITERATIONS is a fixed and known number.
1 // TYPE can be a 2-, 4- or an 8-byte word
2 __global__ void readBenchmark(TYPE *d_arr) {
3 // assign unique partitions to blocks,
4 int numOfPartitions = 8; our benchmark data, to realistically predict a performance range
5 int curPartition = blockIdx.x % numOfPartitions;
6 int partitionSize = 256; // 256 bytes for any execution configuration of those kernels, as explained in
7 int elemsInPartition = partitionSize/sizeof(TYPE); the next section. We can easily obtain the actual number of memory
8 // jump to unique partition transactions in a kernel by using the CUDA Visual Profiler tool [15]
9 int startIndex = elemsInPartition
10
(CudaProf).
* curPartition;
11 TYPE readVal = 0;
12
13 // Loop counter ’x’ ensures coalescing.
4. PERFORMANCE RANGE PREDICTION
14 for(int x = 0; x < ITERATIONS; x += 16) { In this section, we first design an accurate performance model
15 /* offset guarantees to restrict the to predict the range of the effect of partition camping in a GPU
16 index to the same partition */
17 int offset = ((threadIdx.x + x) kernel. If performance is measured by the wall clock time, the
18 % elemsInPartition); lower bound of our predicted performance will refer to the best
19 int index = startIndex + offset; case, i.e. without partition camping for any memory transaction.
20 // Read from global memory location
21 readVal = d_arr[index]; The upper bound will refer to the worst case, i.e. with partition
22 } camping for all memory transaction types and sizes. We achieve the
23 /* Write once to memory to prevent the above accuracy in the model by applying rigorous statistical procedures
24 code from being optimized out */
25 d_arr[0] = readVal; on the data obtained by running our benchmark suite, which we
26 } designed in the previous section.
We then develop and present a very simple easy-to-use tool called
CampProf, which uses the data from our benchmarks and the per-
Figure 4: Code Snapshot of the Read Micro-benchmark for the formance model, and helps the user of the tool to visually detect
NVIDIA 200- and 10-series GPUs (Without Partition Camp- and analyze the partition camping effects in the GPU kernel.
ing). Note: ITERATIONS is a fixed and known number. Lastly, we discuss how our idea of performance range prediction
can very easily be applied to develop similar performance models
and tools for the other GPU architectures.
The benchmarks that simulate the partition camping effect (fig- 4.1 Performance Model
ure 5) carefully access memory from only a single partition. The We perform rigorous statistical analysis techniques to model the
micro-benchmarks for memory writes are very similar to the mem- impact of partition camping in any memory-bound GPU kernel.
ory reads, except that readVal is written to the memory location We model the effect of memory reads separately from the mem-
inside the for-loop (line numbers 21 and 14 in the respective code ory writes, and also model the case with partition camping sepa-
snapshots). We modify the TYPE data-type in the benchmarks to rately from the case without partition camping. So, we will be de-
one of 2-, 4- or 8-byte words in order to trigger 32-, 64- or 128-byte signing four model equations, one for each of the following cases:
memory transactions respectively to the global memory. Although (1) Reads, Without partition camping, (2) Writes, Without partition
our benchmarks have a high ratio of compute instructions to mem- camping, (3) Reads, With partition camping, and (4) Writes, With
ory instructions, we prove that they are indeed memory bound, i.e. partition camping. We follow this approach because we believe
the memory instructions dominate the overall execution time. We that modeling at this fine level of detail gives us better accuracy.
validate this fact by using the methods discussed in [1]. Our suite Specifically, we perform multiple linear regression analysis to fully
of benchmarks is therefore a good representation of real memory- understand the relationship between the execution time of the dif-
bound kernels. ferent types of our micro-benchmarks and their parameters. The
For real memory-bound GPU kernels, we can use their actual independent variables (predictors) that we chose are: (1) the ac-
number of memory transactions of each type and size, along with tive warps per SM (w), and (2) the word-lengths that are read orwritten per thread. The dependent variable (response) is the exe-
cution time (t). The word-length predictor takes only three values
(2-, 4- or 8-bytes)1 corresponding to the three memory transaction
sizes, and so we treat it as a group variable (b). This means, we
first split the data-type variable into two binary variables (b2 and
b4 ), where their co-efficients can be either 0 or 1. If the co-efficient
of b2 is set, it indicates that the word-length is 2-bytes. Likewise,
setting the co-efficient of b4 indicates a 4-byte word-length, and if
co-efficients of both b2 and b4 are not set, it indicates the 8-byte
word-length. We have now identified the performance model pa-
rameters, and the performance model can be represented as shown
in equation 1, where αi denotes the contribution of the different
predictor variables to our model, and β is the constant intercept.
t = α1 w + α2 b2 + α3 b4 + β (1)
Next, we use SAS, a popular statistical analysis tool, to perform
multiple linear regression analysis on our model and the data from
our benchmarks. The output of SAS will provide the co-efficient
values of the performance model.
Significance Test: The output of SAS also shows us the results of
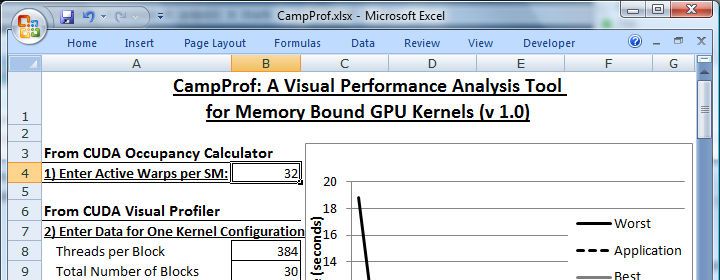
some statistical tests, which describe the significance of our model Figure 6: Screenshot of the CampProf Tool.
parameters, and how well our chosen model parameters are con-
tributing to the overall model. In particular, R2[2] ranges from
0.953 to 0.976 and RM SE (Root Mean Square Error) ranges from
0.83 to 5.29. Moreover, we also used parameter selection tech- any other execution configuration. CampProf passes the input val-
niques in SAS to remove any non-significant variable, and choose ues to our performance model, which predicts and generates the
the best model. This step did not deem any of our variables as upper and lower performance bounds for all the kernel execution
insignificant. These results mean that the response variable (exe- configurations3 . CampProf plots these two sets of predicted execu-
cution time) is strongly dependent on the predictor variables (ac- tion times as two lines in the output chart of the tool. The best case
tive warps per SM, data-types), and each of the predictors are sig- and the worst case execution times form a band between which the
nificantly contributing to the response, which proves the strength actual execution time lies. In effect, the user provides the inputs for
of our performance model. Informally speaking, this means that a single kernel configuration, and CampProf displays the execution
if we know the number of active warps per SM, and the size of band for all the execution configurations.
the accessed word (corresponding to the memory transaction size), In addition, if the actual kernel time for the given execution con-
we can accurately and independently predict the execution times figuration is provided as input (GPU Time counter value from Cu-
for reads and writes, with and without partition camping, by us- daProf), CampProf predicts and plots the kernel execution time at
ing the corresponding version of equation 1. We then aggregate all the other execution configurations, and is denoted by the ‘Appli-
the predicted execution times for reads and writes without partition cation’ line in the output chart. We predict the application line by
camping to generate the lower bound (predicted best case time) for simply extrapolating the kernel time from the given execution con-
the GPU kernel. Similarly, the predicted execution times for reads figuration, in a constant proportion with the execution band. Our
and writes with partition camping are added to generate the upper performance model is therefore indirectly used to generate this line.
bound (predicted worst case time) for the GPU kernel. We validate
the accuracy of our prediction model by analyzing real applications 4.2.2 Visualizing the Effects of Partition Camping
in detail in Section 6. To detect the partition camping problem in the GPU kernel, the
user can simply use CampProf, and inspect the position of the ‘Ap-
4.2 The CampProf Tool plication’ line with respect to the upper and lower bounds (exe-
cution band) in the output chart. If the application line is almost
4.2.1 User-Interface Design and Features touching the upper bound, it implies the worst case scenario, where
CampProf is an extremely easy-to-use spreadsheet based tool all the memory transactions of the kernel (reads and writes of all
similar to the CUDA Occupancy Calculator [11], and its screen- sizes) suffer from partition camping. Similarly, the kernel is con-
shot is shown in Figure 6. The spreadsheet consists of some input sidered to be optimized with respect to partition camping if the ap-
fields on the left and an output chart on the right, which can be plication line is very close to the lower bound, implying the best
analyzed to understand the partition camping effects in the GPU case scenario. If the application line lies somewhere in the mid-
kernel. The inputs to CampProf are the following values: gld dle of the two lines, it means that performance can be potentially
32b/64b/128b, gst 32b/64b/128b, grid and block sizes, improved, and there is a subset of memory transactions (reads or
and active warps per SM. These values can easily be obtained from writes) that is queuing up behind the same partition. The relative
the CudaProf and the CUDA Occupancy Calculator tools. Note position of the application line with respect to the execution band
that the inputs from just a single kernel execution configuration are will show the degree to which the partition camping problem ex-
enough for CampProf to predict the kernel’s performance range for ists in the kernel. For example, while processing two matrices, the
1 kernel might read one matrix in the row major format (without par-
1- and 2-byte word lengths will both result in 32-byte global mem- tition camping) and the other matrix might be read or written into
ory transactions.
2 2 3
R is a descriptive statistic for measuring the strength of the de- As mentioned in Section 2, the ‘number of active warps per SM’
pendency of the response variable on the predictors. is our chosen metric of kernel configuration.in the column major format (with partition camping). This means Global Memory Partitions, each of 256-byte width
that only a part of the kernel suffers from camping, and the actual
execution time will lie somewhere between the two extremities of Par$$on
1
Par$$on
2
Par$$on
3
Par$$on
4
Par$$on
5
Par$$on
6
Par$$on
7
Par$$on
8
CampProf’s execution band. Detailed analysis and results will be Step 1 Warp 1
explained in Section 6. The only remedy to the partition camping Step 2 Warp 2 Warp 1
problem is careful analysis of the CUDA code and re-mapping the Step 3 Warp 3 Warp 2 Warp 1
thread blocks to the data, as explained in ‘TransposeNew’ example Step 4 Warp 4 Warp 3 Warp 2 Warp 1
of the CUDA SDK [17]. Step 5 Warp 5 Warp 4 Warp 3 Warp 2 Warp 1
Our approach of predicting a performance range is in contrast to Step 6 Warp 6 Warp 5 Warp 4 Warp 3 Warp 2 Warp 1
the other existing performance models, which predict just a single Step 7 Warp 7 Warp 6 Warp 5 Warp 4 Warp 3 Warp 2 Warp 1
kernel execution time. But, our method is more accurate because Step 8 Warp 8 Warp 7 Warp 6 Warp 5 Warp 4 Warp 3 Warp 2 Warp 1
our model captures the large performance variation due to partition Step 9 Warp 1 Warp 8 Warp 7 Warp 6 Warp 5 Warp 4 Warp 3 Warp 2
camping. Step 10 Warp 2 Warp 1 Warp 8 Warp 7 Warp 6 Warp 5 Warp 4 Warp 3
As previously shown in the figure 2, our performance model
…
and CampProf provide insights into the largely ignored partition so on
camping problem, and not the other common performance pitfalls
that the CUDA programming guide describes, like non-coalesced Figure 7: GEM: Memory Access Pattern
global memory accesses, shared memory bank conflicts, low arith-
metic intensity, etc. The performance counter values from the Cud-
aProf [15] tool can be used to understand and optimize the common
performance bottle-necks of the kernel (Figure 2). However, these Transpose application is part of the NVIDIA CUDA SDK. We will
values describe the kernel’s behavior either within a single SM or a now briefly describe the execution profiles and memory access pat-
single TPC (depending on the profiler counter), and do not provide terns of these applications, and theoretically analyze the effect of
any details of the overall system. On the other hand, CampProf partition camping in them.
helps understand the memory access patterns among all the active
warps in the entire kernel. We therefore recommend CampProf to 5.1 GEM
be used along with CudaProf and the CUDA Occupancy Calcula- GEM is a molecular modeling application which allows one to
tor, to detect and analyze all types of performance pitfalls in their visualize the electrostatic potential along the surface of a macro-
GPU kernels. molecule [6]. GEM belongs to the ‘N-Body’ class of applica-
tions. The goal of this application is to compute the electrostatic
4.3 Applicability on other GPU Architectures potential at all the surface points due to the molecular components.
Our performance model and CampProf can be used to discover GEM uses an approximation algorithm to speed up the electrostatic
the effect of partition camping in any GPU architecture with com- calculations by taking advantage of the natural partitioning of the
pute capability 1.3 or lower. For GPU architectures with compute molecules into distant higher level components.
capability less than 1.1 and lower, we will only have to change the Each GPU thread is assigned to compute the electrostatic po-
code of the micro-benchmarks to include the appropriate number tential at one surface point, which is later added together to calcu-
of partitions and the partition size. Then, our present model will late the total potential for the molecule. The approximation algo-
still hold and can be directly applied to the new data. The archi- rithm requires the distance information between each surface point
tectural changes in the newer Fermi [13] cards pose new problems and the higher level components. To compute this distance, each
for memory-bound kernels. The memory access patterns are sig- thread needs to access the component coordinates stored in the
nificantly different for Fermi, because of the introduction of L1/L2 GPU global memory, which means that GEM can be a memory
caches and having only 128-byte memory transactions that occur bound application. Each thread accesses these coordinates in the
only at the cache line boundaries. The partition camping prob- following order: from the first component to the last, thereby im-
lem will still exist in the newer cards, but its effect may be some- plying that all the active warps would be queued up behind the same
what skewed due to cached memory transactions. Our performance memory partition at the beginning of the algorithm. Only one warp
range prediction technique will still work, although in a different can access that global memory partition, which causes the other
scenario. For example, we could bound the performance effect of warps to stall. Once the first warp finishes accessing the elements in
caching in the GPU kernels, where the upper band indicated the the first partition, it would move on the next partition, and the first
worst case performance of only cache misses, and the lower band partition is now free to be accessed by the next warp in the queue.
indicated the best case performance of only cache hits. This can Partition access will thus be pipelined, as shown in Figure 7. Once
then help in understanding the effect of improving the locality of this memory partition pipeline is filled up (i.e. after eight such it-
memory accesses in the kernel. Our immediate goal is thus to ex- erations on a device with compute capability 1.2 or 1.3), memory
tend CampProf to CacheProf for the Fermi architecture. accesses will be uniformly distributed across all available memory
partitions. It can be assumed that the pipelined nature of memory
5. APPLICATION SUITE accesses will not result in further stalls because the workload for
In order to validate our performance prediction model, we choose all the warps is identical. This illustrates that GEM does not suffer
the following three applications with known memory access pat- from partition camping.
terns and partition camping effects: (1) GEM (Gaussian Electro-
static Model) [6], which is a molecular modeling application, (2) 5.2 Clique-Counter
Clique-Counter, which is a graph analysis algorithm to count the In graph theory, a clique is a set of vertices in a graph, where
number of cliques in large bi-directed graphs, and (3) Matrix Trans- every two vertices in the set are connected by an edge of the graph.
pose. The GPU implementations of GEM [5] and Clique-Counter Cliques are one of the basic concepts of graph theory and also one
are part of our own prior and ongoing research, while the Matrix of the fundamental measures for characterizing different classes ofgraphs. We identify the size of a clique by the number of vertices Input Data Cartesian Output Data
in it. Clique-Counter is a program, which as the name suggests, 0 1 2 3 4 5 0 64 128
counts the number of cliques of user-specified size in a graph. This 64 65 66 67 68 69 1 65 129
is an NP-complete problem with respect to the size of the clique 128 129 130 … 2 66 130
that must be counted. 3 67 …
4 68
The vertices of the input graph are distributed among GPU threads
5 69
in a cyclic fashion for load balancing purposes, where the entire
graph is stored in the GPU’s global memory in the form of adja- (a) Transpose Coalesced
cency lists. Each thread counts the number of cliques of the given
size that can be formed from its set of vertices, followed by a re- Diagonal
duction operation that sums up the individual clique counts to get 0 64 128 0
the final result. Larger cliques are formed from smaller cliques 1 65 129 64 1
by incrementally adding common vertices to the clique. Clique- 2 66 130 128 65 2
Counter belongs to the ‘backtracking’ class of applications, where 3 67 … 129 66 3
set intersection operations are repeatedly performed between the 4 68 130 67 4
5 … 68 5
vertex set of the current clique and each of their adjacency lists.
This means that each thread has to regularly fetch adjacency lists (b) Transpose Diagonal
of several vertices from the GPU global memory, which means
that the Clique-Counter application can be considered to be mem- Figure 8: Matrix Transpose: Memory Access Patterns [17]
ory bound. The memory accesses occur in no particular order and
hence, the memory access patterns are neither uniformly distributed
across all the memory partitions, nor are they accessing the same can be applied only to memory-bound kernels. This is because if
partition. Therefore, the Clique-Counter application is neither com- a kernel is not memory bound, the effect of memory transactions
pletely free from partition camping nor is it fully partition camped. and memory access patterns will not form a significant part of the
total execution time of the kernel. For such cases, the partition
5.3 Matrix Transpose camping problem becomes irrelevant. To rigorously check if our
chosen applications are compute-bound or memory-bound, we an-
Matrix Transpose is one of the kernels included in the NVIDIA alyzed the change in their execution times by varying the GPU’s
CUDA SDK. The kernel performs an out-of-place transpose of a core-clock and memory frequencies, and inferred that they all are
matrix of floating point numbers, which denotes that the input and indeed memory-bound. More details about our experiment can be
output matrices are stored at different locations in the GPU global found in [1]. It must be noted that there are other approaches to cat-
memory. The input matrix is divided into square 16 × 16 tiles, so egorize the GPU kernels as being compute or memory-bound. We
that the loads are coalesced. Each tile is assigned to one thread- can, say, comment out certain types of instructions in the source
block, which performs the following operations – (i) load the tile code and re-run the kernel to see the effective change in the perfor-
from the input matrix (global memory), (ii) re-map the threads to mance, and then classify the kernel accordingly.
tile elements to avoid uncoalesced memory writes, and (iii) store
the tile in the output matrix (global memory). Within-block thread
synchronization is required between the above steps to make sure 6. RESULTS AND DISCUSSION
that the global memory writes take place only after all the reads In this section, we first explain our experimental setup and then
have finished. Since this application predominantly does reads and verify our performance prediction model by validating the predicted
writes to global memory, it can also be classified as a memory- times against the actual execution times of our chosen applications.
bound application. Next, we demonstrate the utility of CampProf, which is the front-
The NVIDIA CUDA SDK provides various versions of matrix end to our performance model, for detecting the degree of partition
transpose, but we specifically chose two of them for our experi- camping in the same applications.
ments – Transpose Coalesced and Transpose Diagonal. The only
difference between the two applications versions is their global 6.1 Experimental Setup
memory access pattern. Figure 8a presents the memory access pat- The host machine consists of an E8200 Intel Quad core running
tern of Transpose Coalesced. Different solid column groups imply at 2.33 GHz with 4 GB DDR2 SDRAM. The operating system on
different partitions in the global memory while the numbers denote the host is a 64-bit version of Ubuntu 9.04 distribution running the
thread-blocks on the GPU. The figure shows that while reading the 2.6.28-16 generic Linux kernel. The GPU was programed via the
input matrix, thread-blocks are evenly distributed among the par- CUDA 3.1 toolkit with the NVIDIA driver version 256.40. We
titions, however, while writing into the output matrix, all thread- ran our tests on a NVIDIA GTX280 graphics card (GT200 series).
blocks write to the same memory partition. This alludes to the The GTX280 has 1024 MB of onboard GDDR3 RAM as global
fact that partition camping is not a problem for the read operation memory. The card has the core-clock frequency of 1296 MHz and
but while writing, Transpose Coalesced does suffer from partition memory frequency of 1107 MHz [12]. This card belongs to com-
camping to a moderate degree. In the Transpose Diagonal version pute capability 1.3. For the sake of accuracy of results, all the pro-
of the application, this problem of partition camping has been rec- cesses which required graphical user interface (GUI) were disabled
tified by rearranging the mapping of thread-blocks to the matrix to limit resource sharing of the GPU.
elements. The blocks are now diagonally arranged, implying that
subsequent blocks are assigned tiles in a diagonal order rather than 6.2 Validating the Performance Model
row-wise. As shown in Figure 8b, blocks always access different In section 4, we showed how our performance model is used to
memory partitions uniformly, thereby, making this version of the predict the upper and lower bounds of the GPU kernel performance.
application free from partition camping for both reads and writes. In this section, we validate the accuracy of our performance model
Proof of Memory-Boundedness: Our performance prediction model by comparing the predicted bounds (best and worst case) with theexecution times for those applications with known partition camp-
25
ing behavior. However, we cannot use a single application to val-
Execu&on
Time
(seconds)
Predicted
20
idate the accuracy of both the predicted bounds of our model, be- Actual
cause an application can exhibit only one type of partition camping 15
behavior. So, we choose different applications from our suite to 10
validate the different predicted bounds of our model. We choose 5
to use geometric mean as the error metric, because it suppresses
0
the effect of outliers and so, is a better estimate for accuracy in the 1
2
3
4
5
6
7
8
9
10
11
12
13
14
15
16
model. Ac&ve
Warps
per
SM
Validating the lower bound (best case): To verify the accuracy (a) GEM
of the predicted lower bound, we should compute the error between
the actual execution times for an application that is known to be
91:;;':& front end which analyses the kernel source code and translates it
(!"
into a Program Dependence Graph (PDG) which is useful for per-
formance evaluation. The PDG allows them to identify computa-
!"#$"%&'(")*+,$&-./"&01"),$234&
'!" ,-./0"
12234567-8" tionally related operations which are the dominant factors affecting
&!"
9:/0" the kernel execution time. With the use of symbolic evaluation,
%!"
they are able to estimate the effects of branching, coalescing and
bank conflicts in the shared memory.
$!" Input Kernel Configuration In [7], Hong et al. propose an analytical model which dwells
#!"
upon the idea that the main bottleneck of any kernel is the latency
of memory instructions, and that multiple memory instructions are
!" executed to successfully hide this latency. Hence, calculating the
#" $" %" &" '" (" )" *" +" #!" ##" #$" #%" #&" #'" #(" #*" $!" $$" $&" $(" $*" %!" %$"
number of parallel memory operations (memory warp parallelism)
5)+6"&78#93&9"#&1:&
would enable them to accurately predict performance. Their model
(a) GEM relies upon the analysis of the intermediate PTX code generated
by the CUDA compiler. However, the PTX is just an intermediate
;58. CONCLUSIONS AND FUTURE WORK [7] S. Hong and H. Kim. An Analytical Model for a GPU
Key understanding of the GPU architecture is imperative to ob- Architecture with Memory-level and Thread-level
tain optimum performance. Current GPU tools and performance Parallelism Awareness. In Proceedings of the 36th
models provide some GPU specific architectural insights that guide International Symposium of Computer Architecture, 2009.
the programmers to perform common performance optimizations, [8] S. Hong and H. Kim. An Integrated GPU Power and
like coalescing, improving shared memory usage, etc. Our work Performance Model. In Proceedings of the 37th International
differs from the existing performance models by characterizing, Symposium of Computer Architecture, 2010.
modeling and analyzing a lesser known, but extremely severe per- [9] A. Munshi. The OpenCL Specification, 2008.
formance pitfall, called partition camping in NVIDIA GPUs. In http://www.khronos.org/registry/cl/
this paper, we have explored this partition camping problem and specs/opencl-1.0.29.pdf.
have developed a performance model which not only detects the [10] H. Nagasaka, N. Maruyama, A. Nukada, T. Endo, , and
extent to which a memory bound application is partition camped S. Matsuoka. Statistical Power Modeling of GPU Kernels
but also predicts the execution times for all kernel configurations if Using Performance Counters. In Proceedings of
the time for one configuration is known. The performance model International Green Computing Conference, 2010.
was formed using multiple linear regression on the results of our [11] NVIDIA. CUDA Occupancy Calculator, 2008. http:
micro-benchmarks which simulate the partition camping effects on //developer.download.nvidia.com/compute/
the GPU. We have also developed a simple, spreadsheet based tool cuda/CUDA_Occupancy_calculator.xls.
called CampProf which inherently uses the indigenous model for [12] NVIDIA. GeForce GTX 280 Specifications, 2008.
visual performance analysis. http://www.nvidia.com/object/product_
Our model, at present works only for memory bound applica- geforce_gtx_280_us.html.
tions. In future, we would like to come up with such a performance [13] NVIDIA. NVIDIA Fermi Compute Acrhitecture, 2008.
model for compute bound applications as well. The newer Fermi http://www.nvidia.com/content/PDF/fermi_
architecture is known not to suffer from the partition camping prob- white_papers/NVIDIA_Fermi_Compute_
lem, however, with its cache hierarchy, it makes GPU programming Architecture_Whitepaper.pdf.
more challenging. For the Fermi cards, the idea of visual perfor-
[14] NVIDIA. The CUDA Compiler Driver NVCC, 2008.
mance analysis can be used to portray the effect of cache misses
http://www.nvidia.com/object/io_
and to understand the gains of improved data locality. Hence, we 1213955090354.html.
would like to develop ‘CacheProf’ for the next generation GPU
[15] NVIDIA. CUDA Visual Profiler, 2009.
architecture.
http://developer.download.nvidia.com/
compute/cuda/2_2/toolkit/docs/cudaprof_
Acknowledgments 1.2_readme.html.
This work was supported in part by an NVIDIA Professor Part- [16] NVIDIA. NVIDIA CUDA Programming Guide-2.3, 2009.
nership Award. We would also like to thank Balaji Subramaniam http://developer.download.nvidia.com/
for helping us with the statistical analysis of our micro-benchmark compute/cuda/2_3/toolkit/docs/NVIDIA_
results. CUDA_Programming_Guide_2.3.pdf.
[17] NVIDIA. Optimizing Matrix Transpose in CUDA, 2009.
NVIDIA_CUDA_SDK/C/src/transposeNew/doc/
9. REFERENCES MatrixTranspose.pdf.
[1] A. M. Aji, M. Daga, and W. Feng. CampProf: A Visual [18] S. Ryoo, C. I. Rodrigues, S. S. Stone, S. S. Baghsorkhi, S.-Z.
Performance Analysis Tool for Memory Bound GPU Ueng, and W. mei Hwu. Program Optimization Study on a
Kernels. Technical report, Virginia Tech, 2010. 128-Core GPU. In Workshop on General Purpose Processing
[2] M. Bader, H.-J. Bungartz, D. Mudigere, S. Narasimhan, and on Graphics Processing, 2008.
B. Narayanan. Fast GPGPU Data Rearrangement Kernels [19] S. Ryoo, C. I. Rodrigues, S. S. Stone, S. S. Baghsorkhi, S.-Z.
using CUDA. In Proceedings of High Performance Ueng, J. A. Stratton, and W.-m. W. Hwu. Program
Computing Conference, 2009. Optimization Space Pruning for a Multithreaded GPU. In
[3] S. S. Baghsorkhi, M. Delahaye, S. J. Patel, W. D. Gropp, and Proceedings of the 6th annual IEEE/ACM international
W. mei W. Hwu. An Adaptive Performance Modeling Tool symposium on Code Generation and Optimization, pages
for GPU Architectures. In Proceedings of the 15th ACM 195–204, New York, NY, USA, 2008. ACM.
SIGPLAN Symposium on Principles and Practice of Parallel [20] D. Schaa and D. Kaeli. Exploring the Multi-GPU Design
Programming, 2010. Space. In Proc. of the IEEE International Symposium on
[4] M. Boyer, K. Skadron, and W. Weimer. Automated Dynamic Parallel and Distributed Computing, 2009.
Analysis of CUDA Programs. In Proceedings of 3rd [21] W. van der Laan. Decuda, 2008.
Workshop on Software Tools for MultiCore Systems, 2010. http://wiki.github.com/laanwj/decuda.
[5] M. Daga, W. Feng, and T. Scogland. Towards Accelerating [22] V. Volkov and J. Demmel. Benchmarking GPUs to Tune
Molecular Modeling via MultiScale Approximation on a Dense Linear Algebra. In Proc. of the 2008 ACM/IEEE
GPU. In Proceedings of the 1st IEEE International Conference on Supercomputing, November 2008.
Conference on Computational Advances in Bio and medical [23] H. Wong, M.-M. Papadopoulou, M. Sadooghi-Alvandi, and
Sciences, 2011. A. Moshovos. Demystifying GPU Microarchitecture through
[6] J. C. Gordon, A. T. Fenley, and A. Onufriev. An Analytical Microbenchmarking. In Proceedings of the 37th IEEE
Approach to Computing Biomolecular Electrostatic International Symposium on Performance Analysis of
Potential, II: Validation and Applications. Journal of Systems and Software, 2010.
Chemical Physics, 2008.You can also read