Te Tahua Tukunga Hauwaro - Te Porotutuki
←
→
Page content transcription
If your browser does not render page correctly, please read the page content below
Chapter 7

Te Tahua Tukunga Hauwaro – Te Porotutuki
Demonstrating emissions budgets are achievable

Summary
The Commission’s analysis shows that while our recommended emissions budgets are ambitious, they are
also achievable.

To establish this, we have developed a series of possible paths outlining different rates of technology
and behaviour change to 2035 to test the budgets are resilient and ensure uncertainty about the future
does not stall or delay climate action. These scenarios follow different paths of technology and behaviour
changes to 2035, and include the critical actions identified through our analysis that must be carried out
over the next 15 years. These actions are outlined in Chapter 6: Long term scenarios to 2050. We have also
developed detailed assumptions that support those actions.

This chapter provides detail on our analysis to show the emissions budgets can be met. This includes:
•    Detail on the demonstration path, including assumptions that underpin that path over the next 15
     years.
•    Detail on two alternative paths that show the recommended emissions budgets could be met under
     a different mix of actions. These are ‘less technological change, more behaviour change’ and ‘more
     technological change, less behaviour change’.
•    Sensitivity analysis to test how further uncertainties could impact on the ability to meet the budgets.
     The analysis gives us confidence that these uncertainties are manageable.

It is important that we set budgets that have enough flexibility to respond to unanticipated change.
Aotearoa may need to adjust its course as the low emissions transition proceeds. This will mean
government, industry, businesses and individuals will be able to adapt as new information, technologies
and approaches to lowering emissions are developed.
Changes in our final advice
During consultation, we received feedback from submitters about our models and assumptions. This has
been fed into our analysis and changed some of our underlying assumptions. We have presented more
paths for achieving the budgets. We have rerun our models and carried out sensitivity analysis.

The key areas where we received feedback from submitters and made changes to our modelling in
response to new evidence are detailed sector by sector in the chapter.

98   He Pou a Rangi the Climate Change Commission | Ināia tonu nei: a low emissions future for Aotearoa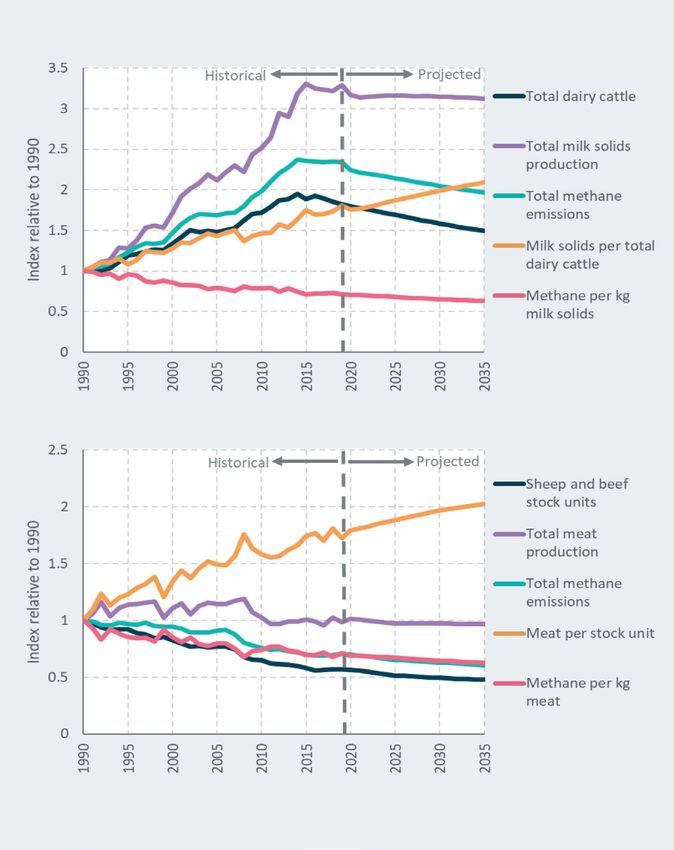
Introduction
1
      Our work shows that there are multiple paths for Aotearoa to achieve our recommended emissions
      budget levels. We have looked at multiple scenarios that follow different paths of technology and
      behaviour changes to 2035. We have also undertaken sensitivity analysis of our assumptions. All of
      this analysis tells us that the recommended emissions budgets are achievable despite uncertainty
      around how fast technology will develop and how behaviours could change in the next 15 years.
2
      Figure 7.1 below shows the process we have gone through to test that our recommended emissions
      budgets are achievable and will put us on track to meet the 2050 emissions reduction targets
      (2050 targets). We constructed a demonstration path that includes a portfolio of actions across the
      economy. We used the demonstration path to calculate the level of the first three emissions budgets
      which are set out in Chapter 5: Recommended emissions budgets.
3
      The demonstration path includes the actions from the long-term scenarios (outlined in Chapter 6:
      Long term scenarios to 2050) that were identified as being critical for meeting the 2050 targets.
      The portfolio of actions in the demonstration path are also consistent with the judgements described
      in Chapter 5: Recommended emissions budgets.
4
      The evidence base underpinning the assumptions for each action is outlined in detail in Chapters 5-9
      of the 2021 Supporting Evidence. The detailed lists of assumptions for all the path runs are available
      on our website www.climatecommission.govt.nz/modelling.

Figure 7.1: Our process to determine the levels at which to set the first three emissions budgets
5
      We also checked to see whether these emissions budget levels were still achievable if some
      technology or behaviour changes happened faster or slower than in the demonstration path.
      To do this we designed two alternative paths which are variations on the demonstration path, and
      carried out sensitivity analysis.

                                 He Pou a Rangi the Climate Change Commission | Ināia tonu nei: a low emissions future for Aotearoa   99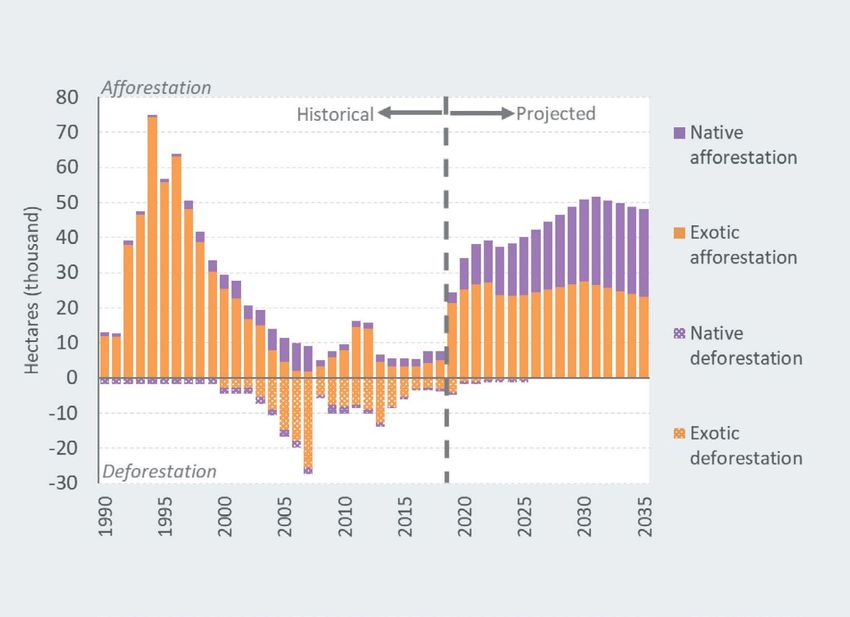
6
       The alternative paths include the same emissions reduction options as the demonstration path but
       vary the speed with which the options are taken up. These paths are:

        •    Alternative path A – this includes less technological change and more behaviour change than
             the demonstration path.
        •    Alternative path B – this includes more technological change and less behaviour change than
             the demonstration path.
7
       The purpose of these paths is not to prescribe the exact mix of technologies that Aotearoa should
       use, but to show that our recommended emissions budgets are achievable in light of uncertainty
       about the future. Some technologies or behaviour changes not included in these paths could end up
       eventuating, depending on the relative economics and people’s preferences.
8
       We have recommended emissions budgets that are ambitious, but also achievable. For this
       reason, the demonstration path focuses on technologies that are commercially available now.
       Recommending emissions budgets that are so ambitious they could only be met if new technologies
       were developed and deployed would undermine the purpose of emissions budgets – to set a credible
       course for medium-term emissions reductions.
9
       In response to submissions, we have made a number of amendments to our modelling and
       assumptions. The changes we have made are detailed in Box 7.3 at the end of this chapter.

100   He Pou a Rangi the Climate Change Commission | Ināia tonu nei: a low emissions future for Aotearoa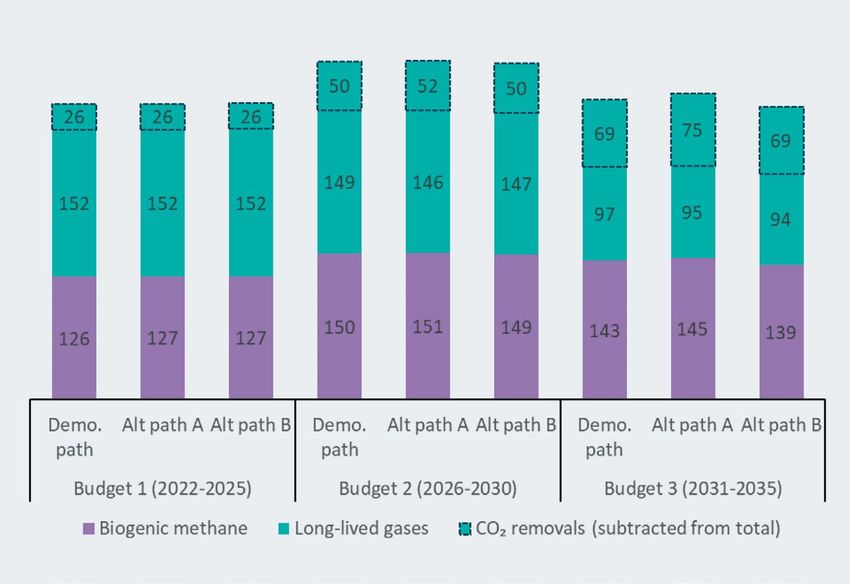
Box 7.1: Emissions values

All the paths to 2035 we set out in this chapter include the same future emissions values, which
increase over time (Figure 7.2). These emissions values apply to the energy and transport sectors
only in our modelling. These values should not be directly interpreted as New Zealand Emissions
Trading Scheme (NZ ETS) prices, as that will depend on the mix of policies Government chooses to
implement in meeting the emissions budgets.
We have arrived at the emissions values by looking at the abatement costs that would be required
in 2050 to eliminate fossil fuel emissions from those sectors where there are low-emissions
alternatives. Our modelling suggests that a price of around $250/tonne would be required to
achieve this.
A more detailed description of how we arrived at the emissions values and how they are used in
our modelling is set out in Chapter 12: Long-term scenarios to meet the 2050 target in the 2021
Supporting Evidence.

Figure 7.2: Emissions values for the energy and transport sectors applied in the paths

                            He Pou a Rangi the Climate Change Commission | Ināia tonu nei: a low emissions future for Aotearoa   101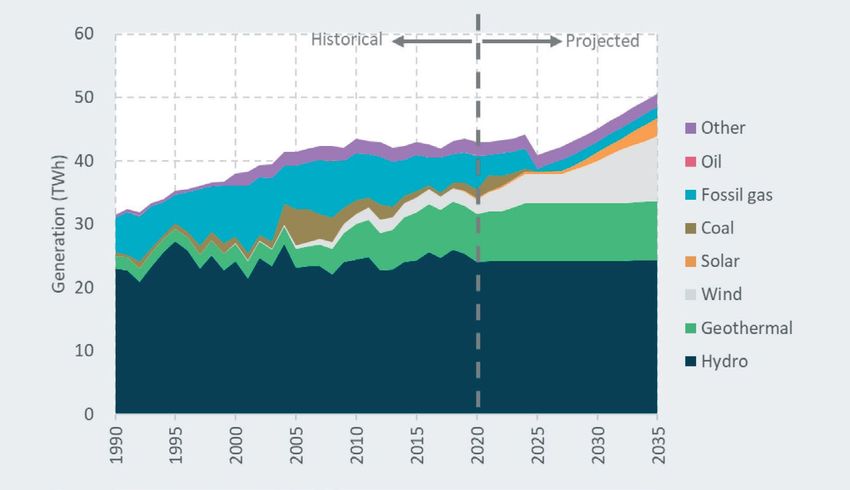
7.1 Summary of the demonstration path
10
This section outlines a demonstration path – one set of measures and actions within each sector
that would deliver our recommended emissions budgets. The final assumptions that sit behind the
demonstration path are outlined throughout this section.
11
Table 7.1 below provides a summary of key actions in the demonstration path across the first three
budget periods. In the following sections we give a more detailed description of the changes that
would happen within each sector.
12
In relation to the long-term scenarios described in Chapter 6: Long-term scenarios to 2050, the
demonstration path would see reductions in long-lived greenhouse gas emissions near the more
ambitious end of the range (Figure 7.3). Net long-lived greenhouse gas emissions would fall by 15%
by 2025, 38% by 2030, and 63% by 2035 compared to 2019. This path would set Aotearoa up to
achieve net zero long-lived greenhouse gas emissions in the early 2040s.
13
These emissions reductions would mostly come from road transport and energy, industry and
buildings (Figure 7.3). The demonstration path would see gross and net carbon dioxide emissions
reduced by 27% and 47% respectively by 2030, compared to 2019.
14
For biogenic methane, in the demonstration path we have assumed no adoption of a biogenic
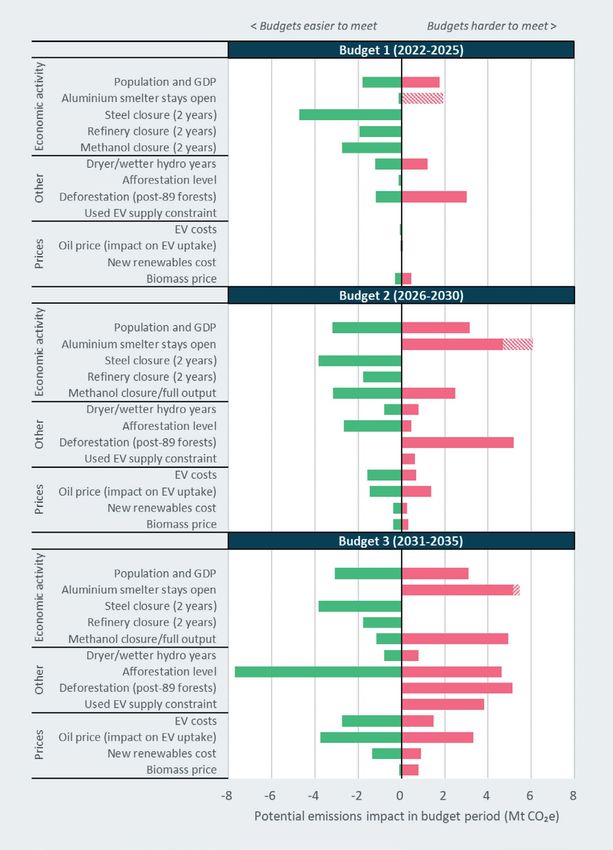
methane inhibitor or other biogenic methane reducing technologies that are not already
commercially available. Because of this, the demonstration path sees biogenic methane emissions
reductions towards the less ambitious end of the scenario range (Figure 7.4). The demonstration
path would see ambitious and sustained changes to low-emissions farm practices such as stock and
pasture management, alongside strong action to reduce biogenic methane emissions from landfills
(Figure 7.4).
102 He Pou a Rangi the Climate Change Commission | Ināia tonu nei: a low emissions future for Aotearoa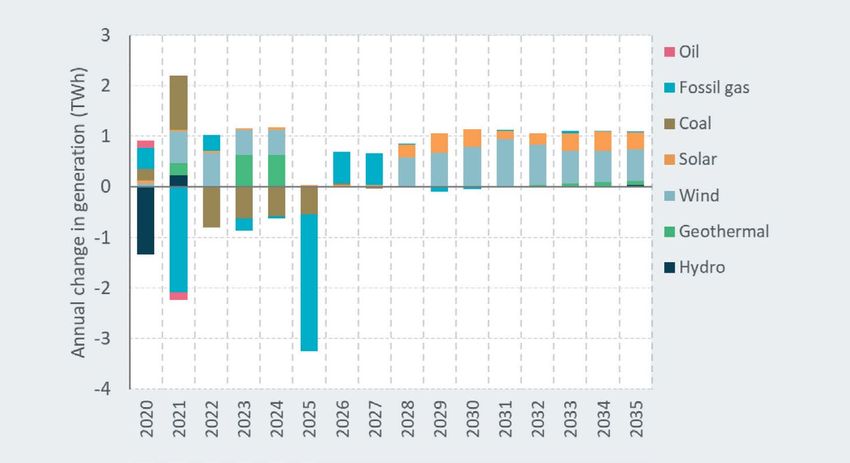
Table 7.1: Key transitions along the demonstration path

                                                          Budget 1                           Budget 2                          Budget 3

                                     Lower-               Accelerate uptake of electric and zero-                              Phase out imports
                                     emissions            emissions cars, buses and trucks                                     of internal
                                     vehicles             Improve efficiency of vehicles and freight                           combustion engine
                                                          movement                                                             light vehicles

                                     Reducing             Encourage switching to walking, cycling and public transport
                                     vehicle trips        Reduce demand for travel, for example through smart urban
                                                          development and increased working from home
                                                          Increase use of rail and coastal shipping for freight
                                     Aviation and         Improve                            Start electrifying                Start electrifying
                                     shipping             efficiency                         ferries and                       short-haul flights
                                                                                             coastal shipping
    Transport

                                     Low carbon                                              Increase use of biofuels
                                     liquid fuels

                                     Buildings            No new fossil gas heating systems                                    Start phasing out
                                                          installed after 2025                                                 existing fossil gas
                                                          Improve thermal efficiency                                           use in buildings
    Energy, industry and buildings

                                     Electricity          Phase out                          Transmission and                  Achieve ~95%
                                                          fossil base-load                   distribution grid                 renewable
                                                          generation                         upgrades                          generation
                                                                                             Expand
                                                                                             renewable
                                                                                             generation
                                     Industrial           Replace coal with biomass and electricity                            Replace fossil gas
                                     process heat                                                                              with biomass and
                                                                                                                               electricity
                                     Agriculture          Adopt low-                         Adopt low-                        Encourage new
                                                          emissions                          emissions                         low biogenic
                                                          practices on-farm                  breeding for                      methane
                                                                                             sheep                             technologies to
                                                                                                                               be adopted when
                                                                                                                               available
                                     Native forests       Ramp up establishing new native forests                              Establish 25,000
                                                                                                                               ha per year
                                     Exotic forests       Average 25,000 ha per year of new exotic                             Ramp down
                                                          forests                                                              planting new
                                                                                                                               exotic forests for
    Land

                                                                                                                               carbon storage
                                     Waste                Divert organic waste from landfill
  Waste and

                                                          Improve and extend landfill gas capture
  F-gases

                                     F-gases              Increase end-of-life recovery of F-gases

                                                      He Pou a Rangi the Climate Change Commission | Ināia tonu nei: a low emissions future for Aotearoa   103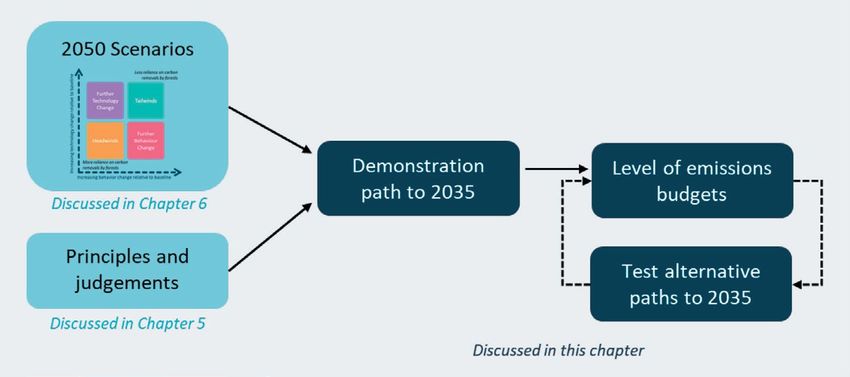
Figure 7.3: Long-lived greenhouse gas emissions in the demonstration path to 2035 compared with the
long-term scenario range
Source: Commission analysis

Figure 7.4: Biogenic methane emissions in the demonstration path to 2035 compared with the long-term
scenario range
Source: Commission analysis

104   He Pou a Rangi the Climate Change Commission | Ināia tonu nei: a low emissions future for Aotearoa
Figure 7.5: Snapshots of emissions in 2025, 2030 and 2035 in the demonstration path, compared
with 2019
Source: Commission analysis

7.2 Transport in the demonstration path
15
       Our approach to meeting the 2050 targets would see Aotearoa almost completely decarbonising
       the transport system. The demonstration path includes the necessary actions over the next 15 years
       to put Aotearoa on track for the 2050 targets while delivering immediate emissions reductions and
       co-benefits. This means travelling less, or shorter distances; using public transport, walking and
       cycling more; and changing how most vehicles are powered.
16
       The evidence base underpinning these assumptions and the full reasoning is outlined in Chapter 6:
       Reducing emissions from transport, buildings and urban form of the 2021 Supporting Evidence.

7.2.1 Changes to how New Zealanders move
17
       Changes to how and how much New Zealanders travel play an important role in the demonstration
       path.
18
       We assume the average household travel distance per person can be reduced by around 3% by 2030,
       relative to our Current Policy Reference case in 2030. This could be achieved, for example, through
       more compact urban development and encouraging remote working for those who can.
19
       We also assume that the mode share of total distance travelled by low-emissions options – walking,
       cycling, public transport, and emerging options such as e-scooters – can be increased, from around
       6% nationally in 2019, to 11% by 2030 and 14% by 2035. Within this, we assume that cycling grows
       from around 0.6% of household travel distance in 2019 to 1.5% in 2030, and public transport grows
       from around 3.5% to 7.7%.
20
       These figures are built up from regional-level assumptions. For example, we assume that share
       of travel distance by public transport nearly triples in Auckland by 2030, compared with growing
       by around 60% in Wellington and 20% in the rest of Aotearoa. We have considered the different
       circumstances and opportunities in urban, rural and provincial areas.

                                He Pou a Rangi the Climate Change Commission | Ināia tonu nei: a low emissions future for Aotearoa   105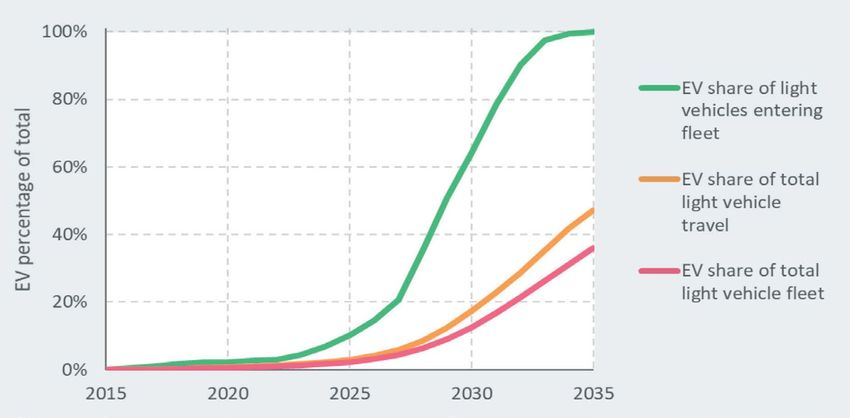
21
        Overall, these assumed changes would see total household vehicle travel holding flat from 2023
        and then declining, despite a growing population. We assume household light vehicle travel can be
        reduced by 9% by 2030, relative to our Current Policy Reference case in 2030 (Figure 7.6).

Figure 7.6: Household light vehicle travel in the demonstration path compared with under
current policies
Source: Commission analysis

7.2.2 Switching to electric and zero-emissions vehicles
22
        Electric vehicles (EVs) – that could include hydrogen fuel cell vehicles where battery electric is not
        feasible – have zero tailpipe emissions, and the electricity to power them can come from clean,
        renewable sources.
23
        The long-term scenarios outlined in Chapter 6: Long term scenarios to 2050 show that electrifying
        the vehicle fleet is a critical element of meeting the 2050 net zero target. Ending the import of
        internal combustion engine (ICE) light vehicles in the early 2030s is necessary in order to have most
        travel electrified by 2050 without forcing significant early scrappage of vehicles.
24
        EVs are currently more expensive to purchase than ICE vehicles, with the additional cost partly offset
        by cheaper running costs. The upfront cost of EVs is expected to continue to fall through continued
        reductions in lithium ion battery costs and rapidly increasing global production.
25
        In the demonstration path, we assume EVs reach purchase price parity with ICE vehicles on average
        by 2031.
26
        For light vehicles – cars, SUVs, vans and utes – imports of new and used ICE vehicles are phased out
        by 2032 and 2035, respectively. This timeframe is consistent with phase out dates set by a growing
        number of countries and automakers. While we have modelled different phase-out dates for new
        and used ICE vehicles, our advice on the direction of policy does not distinguish between the two
        (see Recommendation 17, Chapter 14: Policy direction for transport).

106   He Pou a Rangi the Climate Change Commission | Ināia tonu nei: a low emissions future for Aotearoa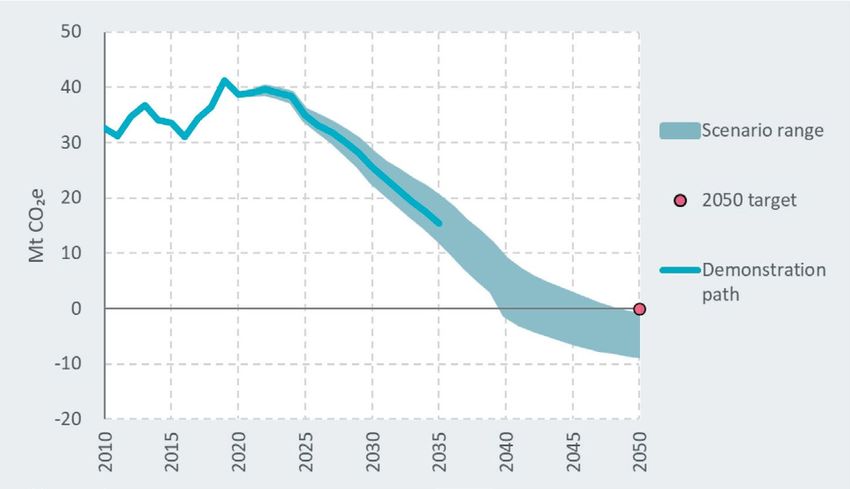
27
       Under the demonstration path, EVs would make up at least half of total light vehicle imports by
       2029. By 2035, 46% of all light vehicle travel would be in EVs and 36% of light vehicles on our roads
       would be electric (Figure 7.7).

Figure 7.7: Uptake of light EVs in the demonstration path
Source: Commission analysis

28
       The demonstration path also sees significant electrification of heavy transport. This includes a
       rapid switch to electric buses, led by favourable economics and in line with commitments from local
       councils and central government. Electrification of trucks, on the other hand, is slower to begin due
       to higher costs and technology barriers, such as current battery technology not allowing for the
       greater daily distances many trucks need to travel.
29
       For heavy duty trucks in particular, the extent to which batteries or hydrogen fuel cells will provide a
       more viable and cost-effective solution is uncertain. Battery electric trucks are a more efficient use
       of energy, requiring roughly one-third as much input electricity as a fuel cell truck running on green
       hydrogen. However, hydrogen fuel cell trucks offer other advantages such as being faster to refuel,
       travelling longer distances, and not having heavy batteries that take the place of freight.
30
       While we have modelled battery electric trucks as the electrification route, the resulting uptake could
       also represent fuel cell trucks powered with green hydrogen. In our consultation, we heard from
       councils and industry that there are multiple green hydrogen heavy transport projects underway.
31
       Of the trucks imported in 2030, 42% of medium trucks and 18% of heavy trucks would be electric.
       By 2035, these would increase to 95% and 73% respectively.

                                 He Pou a Rangi the Climate Change Commission | Ināia tonu nei: a low emissions future for Aotearoa   107
Box 7.2: Costs of electric vehicles now and in the future Electric vehicles (EVs) today cost more to purchase than a comparable internal combustion engine (ICE) vehicle. We estimate the additional upfront cost for a EV in Aotearoa is currently around $16,000 excluding GST, of which about $11,000 is the cost of the battery. However, the outlook is positive, with leading international analysts such as Bloomberg New Energy Finance forecasting that electric cars will be cheaper to make than petrol cars by 2030. These expected cost reductions come through a combination of falling battery costs and other manufacturing cost reductions as automakers retool their production lines and scale up EV production. The cost of lithium ion batteries has already fallen 88% from 2010 to 2020 and is projected to more than halve again by 2030. In the demonstration path, we assume that EVs reach purchase price parity with ICE vehicles on average by 2031. We have been conservative to reflect uncertainty around manufacturer pricing and other factors. We have tested faster and slower cost reductions in the alternative paths. Because EVs are cheaper to fuel and run, they will have a lower total cost of ownership compared with an ICE vehicle several years ahead of reaching purchase price parity. We estimate this would occur by 2026 on average for a new car purchase, for a five-year ownership period. For vehicles driven more than average, the time when an electric car is cheaper will come sooner. For vehicles driven less than average, that time will come later. Figure 7.8 shows the different components of the total cost of ownership for a new car purchase in 2021, 2025 and 2030. In addition to the falling capital costs, the operating cost for the battery electric car also falls. This is because we assume a shift to cost-reflective electricity pricing, with vehicles primarily charged overnight at a low rate. Looking over the whole life of the vehicle, which for a new car entering Aotearoa is around 20 years on average, the time when an EV becomes cheaper arrives even sooner. We estimate the whole-of- life cost for a new battery electric car will be lower than a new petrol car from 2022 (Table 7.2). By 2030, we estimate this whole-of-life cost would be 20% lower. For more information on how the numbers in Figure 7.8 and Table 7.2 have been calculated and on the underlying assumptions, see Chapter 12: Long-term scenarios to meet the 2050 target in the 2021 Supporting Evidence. The 2021 Supporting Evidence also contains cost assumptions for other vehicle types. 108 He Pou a Rangi the Climate Change Commission | Ināia tonu nei: a low emissions future for Aotearoa
Figure 7.8: Projected five-year total cost of ownership for a new battery electric car compared
with a new ICE engine car in 2021, 2025 and 2030 (private perspective)
Source: Commission analysis

Table 7.2: The year that a new electric car becomes cheaper than a new petrol car on whole-of-
life cost, total cost of ownership and purchase price under the demonstration path assumptions

                              Whole-of-life                   Five-year                             Purchase price
                              cost (societal                  total cost of
                              perspective, 3%                 ownership (private
                              discount rate)                  perspective)

    Year by which
    new battery
    electric car is
                              2022                            2026                                  2031
    cheaper than
    new petrol car
    on average

Source: Commission analysis

                                He Pou a Rangi the Climate Change Commission | Ināia tonu nei: a low emissions future for Aotearoa   109
7.2.3 Improving the efficiency of vehicles and freight movement
32
Even with the rapid switch to EVs, roughly 80% of the vehicles entering the fleet this decade would
still be ICE vehicles. Improving their efficiency is therefore important for reducing emissions out to
2035 and beyond.
33
The demonstration path assumes the efficiency of light ICE vehicles entering the fleet improves by
around 1.3% per year on average, leading to a fleet-wide efficiency improvement of 11% by 2035.
This is based on Ministry of Transport projections and includes the effect of a growing share of
conventional hybrid vehicles.
34
We assess there are fewer opportunities for improving the efficiency of trucks. However, further
opportunities to reduce emissions from freight exist through operational efficiency (such as route
optimisation and collaborative use) and switching some freight movements from road to rail and
coastal shipping. The demonstration path assumes 5% operational efficiency gains in road freight
and that 3% of total freight tonne-kilometres can switch by 2030, relative to the Current Policy
Reference case. Further reductions in freight emissions could be achieved by completing the
electrification of the Auckland to Wellington railway line and electrifying the Hamilton to Tauranga
railway line.
7.2.4 Increasing use of low carbon liquid fuels
35
Low carbon liquid fuels, such as biofuels, are another way to reduce emissions from ICE vehicles
now. They may also have a long-term role in hard-to-electrify uses, particularly long-haul aviation
and shipping.
36
The demonstration path assumes the use of low carbon fuels increases to 5 petajoules per year by
2030 and 9.5 petajoules per year by 2035. This is equivalent to around 270 million litres of fuel or
roughly 5% of total liquid fuel demand in 2035. For simplicity, we have modelled this as an equal
share across all fuel types (petrol, diesel, jet fuel and marine fuel oil).
7.2.5 Reducing emissions from domestic aviation and shipping
37
Aviation and shipping face more challenges for decarbonisation than land transport. Still, in addition
to low carbon liquid fuels there are other proven and emerging opportunities.
38
The demonstration path assumes further improvements in efficiency, which have played an
important role in limiting emissions growth historically.
39
Based on stakeholder feedback and our analysis, we assume that from 2030, short-haul aviation –
such as a trip from Wellington to Nelson – begins to convert to new generation planes. We modelled
this as electric planes, but biofuels or hydrogen could also be used to make sustainable aviation fuel
for longer distance flights. Overall, we assume 5% of aviation fuel use can be displaced by 2035.
40
We also assume that domestic shipping, including the Cook Strait ferries, switches to zero-emissions
fuels at the same rate as heavy trucks. Use of batteries, hydrogen or ammonia fuel cells are all
potential options.
110 He Pou a Rangi the Climate Change Commission | Ināia tonu nei: a low emissions future for Aotearoa7.3 Buildings in the demonstration path
41
The long-term scenarios show that actions to improve the energy efficiency of buildings, alongside
decarbonising the energy used for heating, hot water and cooking, will be important for meeting
the 2050 targets. Improving the energy efficiency of homes reduces emissions and can improve
the occupants’ health, particularly for low-income households. This is because homes in Aotearoa
are typically underheated in winter. Households may choose to maintain a warmer home after
improving energy efficiency, rather than reducing their energy use or emissions. A warmer drier
home is also healthier (see Chapter 8: Demonstrating emissions budgets can be fair, inclusive and
equitable).
42
In the demonstration path, we assume that the heat demand for existing homes reduces by 6% by
2035. We assume newly built homes require 35% less heating compared to today’s performance.
43
It is already possible to transition away from heating homes with coal and fossil gas. Heat pumps
already offer a lower cost way to heat homes compared to fossil gas. For hot water, where possible,
electric resistive hot water cylinders offer an alternative to fossil gas systems with comparable costs.
44
Heat pumps will offer a lower cost option to heat most new commercial and public buildings. For
existing buildings, renovations offer an opportunity to replace fossil fuel heating systems, such as
fossil gas central heating, with lower emissions alternatives such as heat pumps or biomass.
45
Commercial and public buildings offer large opportunities to improve energy efficiency through
improved insulation and greater control of energy use. New commercial and public buildings can
be built to higher standards with new technologies to monitor and control energy use, and existing
buildings retrofitted to achieve these improvements.
46
The demonstration path assumes a 30% reduction in new commercial and public buildings’ heat
demand is possible by 2035 compared to today’s performance. We assume that existing commercial
and public buildings’ heat demand reduces by 25% by 2035.
47
Commercial and public buildings can transition away from coal to alternatives such as biomass which
could be used in existing boilers.
48
The demonstration path assumes that by 2030 coal use in commercial and public buildings will be
largely eliminated. The Government announcement in 2020 that all coal boilers in public sector
buildings will be phased out is a step towards this.
49
Fossil fuel heating systems will typically last for 20 years or longer. The demonstration path looks
to avoid new heating systems having to be scrapped before the end of their useful lives to avoid
unnecessary costs.
50
This means that we assume all new space heating or hot water systems installed after 2025 in new
buildings are electric, to put Aotearoa on track for nearly completely decarbonising building heating
systems by 2050.
51
For existing buildings, to be consistent with the insights from our long-term scenarios, we assume
the phase out begins in 2030 (Figure 7.9). We also assume that no further fossil gas connections to
the grid, or bottled LPG connections, occur after 2025. This would allow time for a steady transition,
to be on track for a complete transition away from using fossil gas in buildings by 2050.
52
While they have not been directly modelled, it is possible that low emissions gases, such as biogas or
hydrogen, could be blended into the current fossil gas network. This would reduce its emissions.
He Pou a Rangi the Climate Change Commission | Ināia tonu nei: a low emissions future for Aotearoa 11153
There are also emissions from building construction, producing construction materials and from
waste generated throughout the lifecycle of a building. We account for emissions from construction,
building energy use and producing construction materials under industry.
54
The evidence base underpinning these assumptions and the full reasoning is outlined in Chapter 6:
Reducing emissions from transport, buildings and urban form of the 2021 Supporting Evidence.
Figure 7.9: Energy use in buildings in the demonstration path
Source: Commission analysis
7.4 Electricity in the demonstration path
55
The use of low emissions electricity allows other sectors to reduce emissions. Electrifying transport
and process heat will require significant expansion in electricity generation capacity. Demand for
electricity will also increase as buildings and process heat switch away from fossil fuels. Increased
generation and demand will need to be accompanied by expanding infrastructure for transmission
and distribution.
56
The long-term scenarios showed that renewable wind and solar generation need to rapidly expand
in the 2030s and beyond to meet increased electricity demand as electric vehicles (EVs) are widely
adopted. This rapid expansion has been modelled in the demonstration path (Figure 7.10 and
Figure 7.11).
57
However, in the short term, electricity generation companies may not commit to this expansion in
capacity while there is uncertainty around the future of the New Zealand aluminium smelter at
Tiwai Point.
58
The New Zealand aluminium smelter is the single largest consumer of electricity. Over the last five
years it used on average around 13% per year of the country’s electricity. During the course of the
Commission preparing its advice, the future of the smelter was under review by its owner Rio Tinto.
If Rio Tinto decides to close it, this electricity would be available for other uses, delaying the need for
new generation. In January 2021 the New Zealand aluminium smelter reached a deal to extend its
electricity contract through to December 2024, enabling it to continue operations until 2024.
112 He Pou a Rangi the Climate Change Commission | Ināia tonu nei: a low emissions future for Aotearoa59
In the demonstration path, as in the Current Policy Reference case, we assume the Tiwai Point
aluminium smelter comes to a full close at 31 December 2024 and assume electricity becomes
available for other uses in Aotearoa.
60
Wind, solar and geothermal offer low cost and low emissions ways of generating electricity. The
demonstration path would see 3.8 TWh of currently committed generation projects built between
2020 and 2024. The building of further renewables pauses due to the New Zealand aluminium
smelter closing and resumes in the late 2020s. Beyond 2030, our modelling shows increases in
wind, solar and geothermal generation greater than 1 TWh per year. This is illustrated in Figure 7.10
and 7.11. The exact combination of renewable generation that is built in reality will depend on how
the relative economics pan out.
61
Some geothermal fields have high emissions from their geothermal fluid, with an equivalent
emissions intensity to fossil gas generation. In the demonstration path these high emitting
geothermal fields would continue to operate. However, these high emitting fields have naturally
degassed in recent years and we assume a continuation of their historic rate of reduction in
emissions intensity. Geothermal power generation increases 23% while emissions increase 6% above
2019 levels by 2035.
62
Fossil gas generation provides flexibility to meet daily and seasonal peaks in demand and backs up
renewable generation. While the demonstration path would see reductions in fossil gas generation,
some fossil gas is still required to provide this flexibility until 2035 at least. In the demonstration
path, coal fired generation at Huntly closes in the mid-2020s.
63
The evidence base underpinning these assumptions and the full reasoning is outlined in Chapter 5:
Reducing emissions from energy and industry of the 2021 Supporting Evidence.
Figure 7.10: Electricity generation by fuel in the demonstration path
Source: Commission analysis
He Pou a Rangi the Climate Change Commission | Ināia tonu nei: a low emissions future for Aotearoa 113Figure 7.11: Annual increase (positive) or decrease (negative) in electricity generation in the
demonstration path compared to the previous year. Note that 2020 was an historic dry year with low
inflows into the hydro lakes, resulting in low hydro generation.
Source: Commission analysis
7.5 Industry and heat in the demonstration path
64
There are proven options for decarbonising low- and medium-temperature process heat. These
include switching fuel use from coal and fossil gas to biomass and electricity. There are also
opportunities to improve energy efficiency.
65
Some coal boilers in the food processing sector are already being replaced with biomass or
electricity.
66
The demonstration path would see a steady, but reasonably rapid, rate of conversion to be on track
to eliminate coal use for food processing before 2040 (Figure 7.12). Coal use would decline at around
1.4 PJ per year to 2030 – the equivalent of converting one to two very large dairy processing plants
away from coal each year or converting a larger number of smaller plants.
67
Along with boiler conversion, the demonstration path assumes significant improvements in energy
efficiency across the food processing sector, averaging 1.1% per year.
114 He Pou a Rangi the Climate Change Commission | Ināia tonu nei: a low emissions future for AotearoaFigure 7.12: Food processing energy use in the demonstration path
Source: Commission analysis
68
Where available, biomass from forestry and wood processing residues are a low-cost fuel switching
opportunity. There may be constraints on biomass supply in some regions where there is not
significant forestry. In these regions, electric boilers will be needed, however they will have a higher
operational cost than fossil fuel boilers at current carbon prices. Electrifying process heat will also
require expanding the electricity transmission and distribution grids. This will add to the total cost.
69
In the demonstration path, fuel switching to biomass also occurs in some other energy-intensive
industries such as wood, pulp and paper production. Biomass use in the wood, pulp and paper
production sector steadily increases from current levels, reaching an additional 3 PJ by 2035.
70
Overall, the demonstration path takes advantage of the country’s currently underused biomass
resource to help decarbonise transport and process heat, moving towards a more circular economy.
We assume that the biomass resource is from accessible domestic forestry residue and pulp logs.
Achieving this uptake will require developing supply chains for gathering and processing biomass
along with establishing local markets.
71
High-temperature process heat is more challenging to decarbonise and the demonstration path
assumes continued use of fossil gas and coal in these sectors. While there is potential to further
decarbonise a range of industrial processes through emerging technologies, we assume these are
not available for use before 2035.
72
The evidence base underpinning these assumptions and the full reasoning is outlined in Chapter 5:
Reducing emissions from energy and industry of the 2021 Supporting Evidence.
He Pou a Rangi the Climate Change Commission | Ināia tonu nei: a low emissions future for Aotearoa 1157.6 Agriculture in the demonstration path
73
The two main agricultural greenhouse gases are biogenic methane and nitrous oxide. Biogenic
methane has a different target to other gases, recognising the different nature of the gas. Nitrous
oxide is included in the long-lived greenhouse gas target.
74
The long-term scenarios showed that widespread adoption of existing farm management practices
would be important for meeting the less ambitious end of the 2050 biogenic methane target.
Meeting the more ambitious end would require developing and deploying new technologies.
75
In the demonstration path, we have also focused on the changes that farmers can make using
current technology and practice. Achieving the 2030 targets and putting Aotearoa on track to meet
the 2050 targets in the demonstration path involves changes in farming practices. This will take
substantial work for the sector to deliver but is achievable with a sustained effort.
76
New technologies that could reduce biogenic methane emissions from agriculture are not required
to meet the recommended emissions budgets but would be of substantial benefit if developed,
providing greater flexibility and the ability to reduce emissions further.
77
Converting to lower emissions land uses such as horticulture also provides an opportunity to reduce
emissions in the agricultural sector. However, there are currently barriers.
78
The evidence base underpinning these assumptions and the full reasoning is outlined in Chapter 7:
Reducing emissions from agriculture of the 2021 Supporting Evidence.
7.6.1 Reducing emissions through changes in farming practices
79
The work of the Biological Emissions Reference Group (BERG), the New Zealand Agricultural
Greenhouse Gas Research Centre, and others, has identified several changes farmers can make that
can reduce their greenhouse gas emissions. These include improving per animal performance while
reducing stocking rates, reducing replacement animals, and moving to a lower input farm system.
These options will interact within farm systems. No one approach or option will work for all farmers,
nor should all farmers be expected to achieve the same level of emissions reductions.
80
The key requirement for any practice change to reduce total biogenic methane emissions, and not
just emissions intensity, is to reduce total dry matter consumption. The challenge for farmers is to
find a better balance between livestock numbers, production levels and feed inputs (supplementary
feed and fertiliser), which enables them to maintain farm profitability while reducing emissions. This
generally means a greater proportion of dry matter consumed is used for production and less is used
for animal ‘maintenance’. Numerous modelling studies and farm trials suggest this is possible over
time with data, skills and knowledge. With improving animal genetics, the performance frontier is
continually advancing.
81
In the long-term scenarios we have made different assumptions about overall changes to livestock
numbers and average production per animal that could result from a range of practice changes
being adopted across different farms. We have tested these against more detailed assumptions on
specific measures used in the BERG work to confirm they are plausible. We have also validated our
modelling of emissions against the Ministry for Primary Industries' (MPI’s) agricultural greenhouse
gas inventory model.
116 He Pou a Rangi the Climate Change Commission | Ināia tonu nei: a low emissions future for Aotearoa82
The demonstration path follows the ‘Tailwinds’ future (see Chapter 6: Long term scenarios to
2050) where farmers succeed in making significant productivity gains at the same time as reducing
livestock numbers. The alternative paths presented below in Section 7.9 consider a future where
productivity improvements are much more limited.
83
In the Current Policy Reference case, total dairy cattle numbers fall by around 8% from 2019 levels by
2030 while milk solids production drops by around 4%. This is based on MPI’s projections.
84
In the demonstration path, practice changes enable total dairy cattle numbers to be reduced further
– to 13% below 2019 levels – while maintaining roughly the same milk production as in the Current
Policy Reference case (Figure 7.13). This is consistent with work for the BERG assessing the potential
for increasing individual animal performance and reducing replacement rates.
85
Sheep and beef animal numbers are projected to fall by around 8% from 2019 levels by 2030 under
the Current Policy Reference case, due to continued retirement of farmland and land-use change to
forestry. Animal numbers are expressed as a weighted average of sheep and beef numbers based on
approximate relative feed intake – one beef cattle is the equivalent of five sheep.
86
The demonstration path sees deeper reductions in sheep and beef animal numbers of an additional
5 percentage points below 2019 by 2030, with only a small additional drop in meat production of
around 1 percentage point. This includes the impact of new native forests established on sheep and
beef farms, which is assumed to have a small effect on production.
87
Through these changes, the demonstration path sees agricultural methane emissions reduced by
almost 11% below 2017 levels by 2030.
88
The changes would lead to a similar drop in nitrous oxide emissions. This includes modelled
reductions in nitrogen fertiliser use on dairy farms that would be consistent with the reduction in
dry matter consumption per hectare (ha). We estimate a potential reduction on the order of 20%
by 2030 in the demonstration path, though the precise number would depend on farmer decisions
around use of supplementary feed and grazing off. We have also assumed the share of urea fertiliser
coated with urease inhibitor increases to 100% by 2030.
He Pou a Rangi the Climate Change Commission | Ināia tonu nei: a low emissions future for Aotearoa 117Figure 7.13: Changes in livestock numbers, production and emissions since 1990 and in the demonstration path for dairy farming (top) and sheep and beef farming (bottom) Source: Commission analysis 118 He Pou a Rangi the Climate Change Commission | Ināia tonu nei: a low emissions future for Aotearoa
7.6.2 New technologies to reduce emissions
89
       Selective breeding for lower emissions sheep is a proven option which is in the early stages of
       commercial deployment. The demonstration path assumes that this can be progressively adopted,
       reducing overall biogenic methane emissions from the sheep and beef farming sector by 1.5% by
       2030 and 3% by 2035.
90
       We have assumed selective breeding does not have an emissions impact before 2025. Breeding for
       low emissions cattle has commenced, but it will take a decade or so to see an impact on emissions
       from selective breeding. We therefore assume there is no selective breeding for cattle by 2035.
91
       Biogenic methane inhibitors and vaccines are being researched and trialled. These could reduce the
       amount of biogenic methane that is released from cattle and sheep. While there has been progress
       on inhibitors, these are not yet commercially available. There might be an inhibitor on the market
       in the near future, but there are still barriers to overcome like uncertainties about what their costs
       could be and how effectively they could reduce emissions.
92
       In the demonstration path, we have assumed that biogenic methane inhibitors and vaccines are
       not used before 2035. However, if any of these technologies could be brought to market before
       2035, they would provide additional options for meeting the emissions budgets. We will review how
       these technologies are progressing and will consider changes to the emissions budgets if evidence
       becomes available that they can be widely adopted in the future.

7.6.3 Converting land to lower emissions land uses
93
       In the demonstration path, we assume 2,000 ha of land is converted to horticulture per year
       from 2025 (Figure 7.14). We expect that this could increase in the future if barriers – such as water
       availability, labour, supply chains and path to market – are addressed.
94
       Converting land to exotic and native forests is discussed in the next section.

Figure 7.14: Land use for agriculture and forestry in the demonstration path
Source: Commission analysis

                                  He Pou a Rangi the Climate Change Commission | Ināia tonu nei: a low emissions future for Aotearoa   119
7.7 Forests in the demonstration path
95
The demonstration path would see a significant increase in new native forests established on less
productive land, through a combination of active planting and letting land revert to native forests.
This is in line with the insights from the long-term scenarios. In these scenarios we saw the need
for new native forests to build a long-term carbon sink to offset residual long-lived greenhouse gas
emissions from hard-to-abate sectors.
96
MPI has forecast that there will be around 12,000 ha of new native forests established in 2021. The
demonstration path would see this ramp up to 25,000 ha per year by 2030 (Figure 7.15). In total,
close to 300,000 ha of new native forests would be established from 2021 to 2035 (Figure 7.14
above). The rate that we can plant or revert native forest would likely be limited by nursery capacity
(where planting is needed), pest control and fencing.
97
Estimates from recent studies suggest there is in the order of 1,200,000 to 1,400,000 ha of
marginal land that could be converted to forests, 740,000 ha of which could revert to native forests
naturally. As much of this land is steep and prone to erosion, we consider that it would be more
suitable for permanent forests, particularly native forests.
98
Establishing close to 300,000 ha of native forests could cost between $5 billion and $15 billion. The
carbon benefits alone could outweigh the establishment and maintenance costs after a few decades.
This return could be achieved in as short as about 15 years for reverted forests or as long as about 70
years for higher cost planted forests. Native forests also provide a range of benefits.
99
In the demonstration path, exotic forestry planting would continue the trajectory expected under
Current Policy Reference scenario up until 2030, averaging around 25,000 ha per year over the
decade. From 2030 onwards, the rate of exotic forestry planting for carbon removals would reduce.
In total, around 380,000 ha of new exotic forestry would be established from 2021 to 2035.
100
We have assumed there is no change in permanent exotic forest planting beyond what is included
in the Current Policy Reference case as additional planting would not be required to reach the 2050
targets.
101
As well as planting new forests, the demonstration path would see reduced deforestation, which
is still a considerable source of emissions in Aotearoa. The demonstration path assumes that no
further native deforestation occurs after 2025.
120 He Pou a Rangi the Climate Change Commission | Ināia tonu nei: a low emissions future for AotearoaFigure 7.15: Afforestation and deforestation by year in the demonstration path
Source: Commission analysis
102
Trees can help in the transition to a low emissions Aotearoa in other ways.
103
Bioenergy offers a low cost route for decarbonising some sectors, including process heat. Overall,
there appears to be a large potential biomass supply from pulp logs and collecting and using waste
from forestry and wood processing.
104
However, availability is likely to vary across the country due to regional mismatches in supply and
demand, and the cost of transporting biomass. While the supply of biomass residues may appear to
be abundant in some regions, trade-offs may also need to be made when deciding what parts of the
economy to decarbonise using biomass first.
105
Timber can displace emissions-intensive materials such as steel and cement in buildings. This
reduces embodied emissions and can lock up carbon for several decades.
106
The evidence base underpinning these assumptions and the full reasoning is outlined in Chapter 9:
Removing carbon from our atmosphere of the 2021 Supporting Evidence.
He Pou a Rangi the Climate Change Commission | Ināia tonu nei: a low emissions future for Aotearoa 1217.8 Waste and F-gases in the demonstration path
107
Reusing and recovering waste materials is a key part of a circular economy. The demonstration
path would see a reduction in the amount of waste generated, and a focus on reducing the amount
of organic waste, such as food, wood and paper, that goes into landfills. Overall, the share of total
organic waste avoided or recovered from landfill would increase to 28% by 2030 (Figure 7.16).
108
Waste emissions can be further reduced by increasing the amount of methane that is captured and
destroyed from landfills. This could be achieved through upgrading or installing new landfill gas
capture systems, or by diverting organic waste from sites without landfill gas capture to those with
capture. Installing gas capture at existing sites that have received substantial volumes of organic
waste in the past would be particularly impactful as it enables the capture of legacy emissions as this
waste decomposes.
109
In the demonstration path we assume that by 2030, it is possible to capture roughly one-quarter of
the methane that would have been emitted from landfills currently without capture systems (non-
municipal and smaller municipal landfills). We also assume that the efficiency of existing gas capture
systems is slightly increased.
110
Overall, these changes see methane emissions from waste falling 29% by 2030 relative to 2017 levels
in the demonstration path.
111
The evidence base underpinning these assumptions and the full reasoning is outlined in Chapter 8:
Reducing emissions from waste of the 2021 Supporting Evidence.
Figure 7.16: Total organic waste sent to landfill in the demonstration path
Source: Commission analysis
112
Fluorinated gases, particularly hydrofluorocarbons (HFCs), are greenhouse gases that are primarily
used as refrigerants in fridges, freezers and air conditioning systems. The demonstration path
assumes greenhouse gas emissions from HFCs reduce by 21% by 2030 and 32% by 2035 relative to
2019, in line with the actions Aotearoa takes under the Kigali Amendment to the Montreal Protocol.
This can be achieved through reducing the import of HFCs contained within products, reducing
equipment leakage and increasing end-of-life recovery of products that contain these gases.
122 He Pou a Rangi the Climate Change Commission | Ināia tonu nei: a low emissions future for Aotearoa7.9 There are different ways Aotearoa could meet the budgets
113
We are required under the Climate Change Response Act 2002 to recommend emissions budgets
that are ambitious but achievable. There is inherent uncertainty when assessing the future – some
technologies may develop faster than predicted, while others may be slower or not become
commercially viable.
114
To ensure that emissions budget levels are achievable, we have tested to ensure that they can be met
across a range of future circumstances.
115
Being able to meet the budgets in different ways gives us confidence that there is enough flexibility
in how the recommended emissions budgets can be met. Putting Aotearoa on track to its emissions
targets and playing its part in the global effort to limit warming to 1.5°C requires budgets to be set at
an ambitious level that will require hard work to achieve. However, if we make them too hard, there
is no flexibility if things do not turn out how we plan.
116
We have developed two alternative paths to the demonstration path. These build on the long-
term scenarios and demonstrate how the recommended emissions budgets could be met with
different mixes of actions. This helps to test the degree of flexibility the budget levels allow and how
slower progress in some areas could be made up for by further progress in others. It also helps to
understand which actions are critical in any path.
117
The specific variations in alternative paths A and B (see Chapter 6: Long term scenarios to 2050)
compared with the demonstrated path are set out in Table 7.3. Other actions common to all three
paths are as described in the previous section above.
118
Figure 7.17 shows the emissions and removals for each path over the three budget periods. The
alternative paths would meet the overall emissions budgets defined by the demonstration path to
within 1 MtCO2e. They would also meet the 2030 biogenic methane target.
119
The alternative paths would also achieve broadly the same balance of long-lived gases and biogenic
methane within the budgets. Due to the different warming impacts of different greenhouse
gases, altering the balance of long-lived gases and biogenic methane would impact the country’s
contribution to warming and our ability to meet the 2050 targets.
7.9.1 Alternative path A: Less technological change, more behaviour change
120
We have tested whether our recommended emissions budgets could still be met through a slower
uptake in electric vehicles (EVs) and with less emissions reduction achieved through changes in farm
management practices. In this case, the emissions budgets could be met through:
• Further reducing travel and shifting to lower emissions travel modes such as walking, cycling and
public transport
• Further improving the emissions efficiency of internal combustion engine (ICE) vehicles entering
the fleet, particularly through higher uptake of conventional hybrids
• Further land-use change from livestock agriculture into horticulture and exotic forestry
• Further reducing the amount of organic waste sent to landfill
• Further increasing end of life capture and destruction of F-gas refridgerants
• An earlier switch away from fossil gas use in the wood processing sector
He Pou a Rangi the Climate Change Commission | Ināia tonu nei: a low emissions future for Aotearoa 1237.9.2 Alternative path B: More technological change, less behaviour change
121
We have also tested whether our recommended emissions budgets could be met if people do not
change behaviour as far as assumed in the demonstration path. In this case, the emissions budgets
could be met through:
• further accelerating uptake of EVs so that by 2030 all new light vehicles entering the country are
electric
• a biogenic methane inhibitor being widely adopted on dairy farms, reducing biogenic methane
emissions from dairy cattle by around 5% in 2030 and 15% by 2035
• further increases to landfill gas capture coverage and efficiency.
122
This path would overachieve the third emissions budget by 8 MtCO2e, illustrating the opportunities
to extend future ambition through driving strong and early adoption of key technologies.
Table 7.3: Actions and outcomes that differ between the demonstration path and alternative
paths A and B
Demonstration Alternative path A Alternative path B
path
EV share of 50% by 2029 50% by 2031 50% by 2027
light vehicle ~100% by 2032 ~100% by 2035 ~100% by 2030
registrations
Household light 36 billion vehicle- 33 billion vehicle- 39 billion vehicle-
vehicle travel km in 2035 km in 2035 km in 2035
(5% increase from (5% decrease from (12% increase from
2019) 2019) 2019)
Fuel economy of Average improves Average improves Same as
ICE cars entering to 7.1 L per 100 km to 6.0 L per 100 demonstration path
fleet by 2035 (20% lower km by 2035 (32%
than 2019) lower than 2019)
with higher share
of conventional
hybrids
Low carbon liquid 12 PJ (~270 million litres) per year by 2035, None
fuels including non-transport use
Electric air travel 5% of domestic None 10% of domestic
air passenger-km air passenger-km
electric by 2035 electric by 2035
A large pulp mill 2030 2025 2030
conversion to high
efficiency recovery
boiler
124 He Pou a Rangi the Climate Change Commission | Ināia tonu nei: a low emissions future for AotearoaFarm management Reduce average Reduce average emissions per ha by 8% for
changes emissions per ha dairy and 1% for sheep and beef by 2035
by 13% for dairy (compared with baseline reduction of 6% for
and 4% for sheep dairy and increase of 3% for sheep and beef)
and beef by 2035
relative to 2019
Biogenic methane None Reduces dairy
inhibitors and enteric methane
vaccine by 5% by 2030 and
15% by 2035
Exotic Average of 25,000 Average of 29,000 Same as
afforestation ha per year to 2030 ha per year to 2030 demonstration path
Land-use change 2,000 ha per From 2021, Same as
to horticulture year converted to additional 3,500 ha demonstration path
horticulture from per year converted
2025 from dairy
Waste recovery/ Reduce total Reduce total Same as
diversion organic waste to organic waste to demonstration path
landfill by 34% landfill by 51%
by 2035, relative by 2035, relative
to current policy to current policy
reference case reference case
Landfill gas By 2035: Municipal landfill
capture Average municipal landfill capture efficiency capture efficiency
increased from 68% to 73% increased to 80%;
Capture systems
Capture systems cover 60% of methane
cover 73% of
generated from smaller and non-municipal
methane generated
landfills
from smaller and
non-municipal
landfills
HFCs 32% emissions 39% emissions Same as
reduction by 2035, reduction by 2035, demonstration path,
relative to 2019 relative to 2019 relative to 2019
He Pou a Rangi the Climate Change Commission | Ināia tonu nei: a low emissions future for Aotearoa 125Figure 7.17: Emissions and removals by budget period in the demonstration path and alternative paths A and B Source: Commission analysis 126 He Pou a Rangi the Climate Change Commission | Ināia tonu nei: a low emissions future for Aotearoa
7.10 Risks to meeting the budgets and opportunities to
    outperform
123
      We have undertaken sensitivity analysis to test how further uncertainties could impact on the ability
      to meet the recommended emissions budgets.
124
      Figure 7.18 shows the modelled impact on emissions in each budget period for the 13 individual
      factors tested.
125
      Holding all other assumptions constant, we have modelled how the demonstration path would be
      affected by:
      •   Slower or faster rates of population and GDP growth. We have tested population growth rates
          0.4 percentage points faster or slower, and GDP growth rates 0.3 percentage points higher or
          lower, based on government projections.
      •   Continued operation of the New Zealand aluminium smelter. We have tested what happens if
          the smelter continues to operate beyond 2024. Two variants have been modelled to highlight
          different potential outcomes for the electricity sector. The first assumes full certainty that
          the smelter will continue to operate (solid bars in Figure 7.18). The second assumes ongoing
          uncertainty around whether the smelter will continue to operate, resulting in lower investment
          in new renewable generation (hatched bars in Figure 7.18).
      •   Potential closure or continued operation of other large industrial emitters. For illustrative
          purposes, we have tested the impact if steel production, oil refining or methanol production
          were to close for the last two years of each budget period. For methanol, we have also tested a
          case where full output resumes from 2026 with the reopening of the mothballed Waitara Valley
          methanol train.
      •   Variability in hydro in-flows. We have estimated the variability in emissions that could occur
          with more dryer or wetter hydro years occurring in the budget period, compared to mean hydro
          years as assumed in our modelling.
      •   Uncertainty in projected levels of afforestation and deforestation. We have tested using the
          high and low bounds of the Ministry of Primary Industries’ projections for exotic afforestation
          and deforestation of post-1989 forests.
      •   Potential for constrained supply of used EVs. We have tested what happens if imports of used
          EVs are constrained to the same level as in the Current Policy Reference case (assuming no other
          changes in the vehicle market).
      •   Uncertainty around projected energy and vehicle costs. We have tested high and low values for
          EV costs, oil price, capital cost reductions for renewable generation, and biomass prices. Note
          that in our transport modelling, the oil price only affects the choice of vehicle technology – it
          does not affect travel demand or choice of travel options.
126
      Appendix 1 in Chapter 12: Long-term Scenarios to meet the 2050 target of the 2021 Supporting
      Evidence provides further detail on the assumed variations or sensitivity ranges tested in each case,
      compared with what is assumed in the demonstration path.

                                He Pou a Rangi the Climate Change Commission | Ināia tonu nei: a low emissions future for Aotearoa   127
You can also read