Air Monitoring Network Plan - 2021-2022 City of Philadelphia Department of Public Health Air Management Services
←
→
Page content transcription
If your browser does not render page correctly, please read the page content below
2021-2022
Air Monitoring Network Plan

        City of Philadelphia
    Department of Public Health
     Air Management Services

            July 1, 2021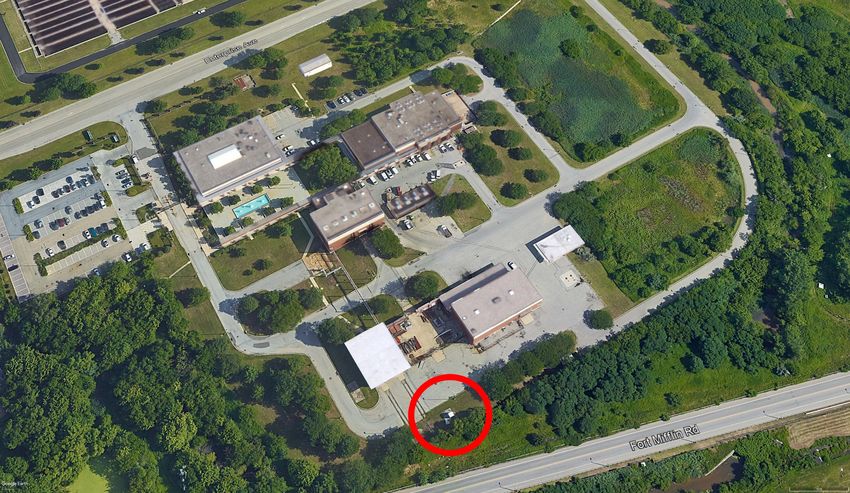
Executive Summary
Philadelphia has an air monitoring network of ten air monitoring stations that house instruments
that measure ambient levels of gaseous, solid, and liquid aerosol pollutants. It is operated by the
City of Philadelphia’s Department of Public Health, Air Management Services (AMS), the local
air pollution control agency for the City of Philadelphia. This network is part of a broader
network of air monitoring operated by our local states of Pennsylvania, New Jersey, Delaware
and Maryland that make up the Philadelphia-Camden-Wilmington, PA-NJ-DE-MD Metropolitan
Statistical Area (MSA).

The United States Environmental Protection Agency (US EPA) created regulations on how the
air monitoring network is to be set up. These regulations can be found in Title 40 – Protection of
Environment in the Code of Federal Regulations (CFR) Part 58 – Ambient Air Quality
Surveillance, located online at: http://www.ecfr.gov/cgi-bin/text-
idx?SID=86f79e0c1262e76604e10118aa3cc0ec&mc=true&node=pt40.6.58&rgn=div5.

Beginning July 1, 2007, and each year thereafter, AMS has submitted to EPA Region III, an Air
Monitoring Network Plan (AMNP) which assures that the network stations continue to meet the
criteria established by federal regulations.

Air monitoring provides critical information on the quality of air in Philadelphia. The objective
for much of our network is to measure pollutants in areas that represent high levels of
contaminants and high population exposure. Some monitoring is also done to determine the
difference in pollutant levels in various parts of the City, provide long term trends, help bring
facilities into compliance, provide real-time monitoring and provide the public with information
on air quality.

Air monitoring data is submitted to the EPA on a quarterly basis. EPA’s AirData website
(https://www.epa.gov/outdoor-air-quality-data) provides access to air quality data collected at the
monitors. On May 1st of the current year, AMS certifies the prior year’s data. The annual data
certification process is outlined in 40 CFR Part 58.15.

The proper siting of a monitor requires the specification of the monitoring objective, the types of
sites necessary to meet the objective, and the desired spatial scale of representativeness. These
are discussed in the section entitled “Definitions”.

This Plan is composed of fourteen sections plus Appendices A – D:

   1. Public Participation – This section provides information on how the public is made
      aware of the AMNP and where it is available for review.

   2. Definitions – This section describes the terms used for air monitoring programs,
      measurement methods, monitoring objectives, spatial scales, air monitoring areas,
      pollutants, collection methods, and analysis methods.

                                              Page i
3. Current Network at a Glance – This section shows the location of the monitoring sites
   and the pollutants measured at each site.

4. Current Sites Summary – This section provides information applicable to our overall
   network such as population. It also provides a brief overall purpose for each monitoring
   site.

5. Direction of Future Air Monitoring – This section gives a perspective of the major
   areas and initiatives AMS will be considering during the next few years.

6. Proposed Changes to the Network – This section describes changes that may occur
   within the next 18 months that would modify the network from how it is currently
   described in the AMNP.

7. NCore Monitoring Network – This section documents the NCore monitoring network
   codified in 40 CFR Part 58.10(a)(3) and 40 CFR Part 58 Appendix D section 3.

8. Pb Monitoring Network – This section documents the Pb monitoring network codified
   in 40 CFR Part 58.10(a)(4) and 40 CFR Part 58 Appendix D section 4.5.

9. NO2 Monitoring Network – This section documents the NO2 monitoring network
   codified in 40 CFR Part 58.10(a)(5) and 40 CFR Part 58 Appendix D section 4.3.

10. SO2 Monitoring Network – This section documents the SO2 monitoring network
    codified in 40 CFR Part 58.10(a)(6) and 40 CFR Part 58 Appendix D section 4.4.

11. CO Monitoring Network – This section documents the CO monitoring network codified
    in 40 CFR Part 58.10(a)(7) and 40 CFR Part 58 Appendix D section 4.2.

12. PM2.5 Monitoring Network – This section documents the PM2.5 monitoring network
    codified in 40 CFR Part 58.10(a)(8) and 40 CFR Part 58 Appendix D section 4.7.

13. O3 Monitoring Network – This section documents the O3 monitoring network codified
    in 40 CFR Part 58.10(a)(9) – (12) and 40 CFR part 58 Appendix D section 4.1.

14. Detailed Information on Each Site – This is the largest section of the AMNP. Each
    monitoring site is separately described in a table, complete with pictures and maps. The
    material is presented as:
       o A table providing information on the pollutants measured, sampling type,
           operating schedule, collection method, analysis method, spatial scale, monitoring
           objective, probe height, and begin date of each monitor;
       o Pictures taken at ground level of the monitoring station;
       o A map of the monitoring site complete with major cross streets and major air
           emission sources within 3000 meters (almost 2 miles); and
       o An aerial picture providing a north view of the site.

                                         Page ii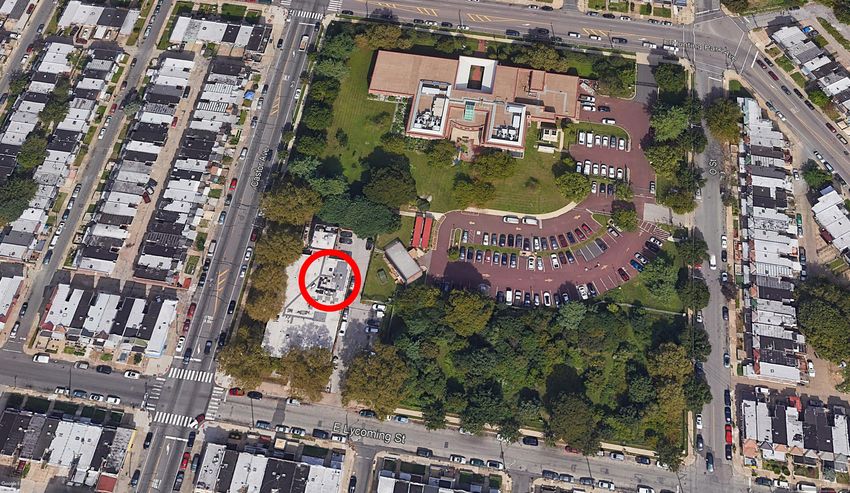
15. Appendix A – PAMS Monitoring Implementation Plan

   16. Appendix B – Philadelphia Air Quality Survey & Quality Assurance Project Plan

   17. Appendix C – 2020 Community Scale Air Toxics Ambient Monitoring Grant

   18. Appendix D – Proof of Publication

AMS has provided a copy of the AMNP for public inspection on the City’s website at:
https://www.phila.gov/departments/air-pollution-control-board/air-management-notices/.

Comments or questions concerning the air monitoring network or this Plan can be directed to:

                                        Mr. Jason Li
                         Engineering Supervisor of Program Services
                                 Air Management Services
                             321 University Avenue, 2nd Floor
                                   Philadelphia, PA 19104
                                    Phone: 215-685-9440
                               E-mail: jiazheng.li@phila.gov

                                            Page iii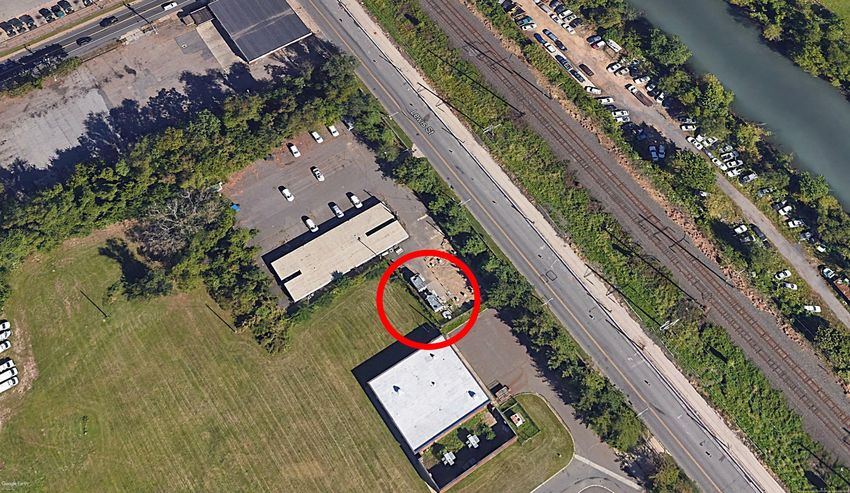
Table of Contents
Executive Summary                                   i
Public Participation                                1
Definitions                                         2
   Air Monitoring Programs                          2
   Measurement Methods                              2
   Monitoring Objectives                            3
   Spatial Scales                                   3
   Air Monitoring Area                              4
   Pollutants and Parameters                        4
   Collection Methods                               5
   Analysis Methods                                 6
Current Network at a Glance                         8
Summary of Current Sites                            10
Direction of Future Air Monitoring                  12
Proposed Changes to the Network                     13
NCore Monitoring                                    14
Pb Monitoring Network                               15
NO2 Monitoring Network                              16
SO2 Monitoring Network                              17
CO Monitoring Network                               18
PM2.5 Monitoring Network                            19
O3 Monitoring Network                               20
Detailed Information on Each Site                   21
   LAB                                              22
   ROX                                              25
   NEA                                              28
   NEW                                              31
   RIT                                              35
   FAB                                              38
   SWA                                              41
   TOR                                              44
   MON                                              47
   VGR                                              51

                                      Page iv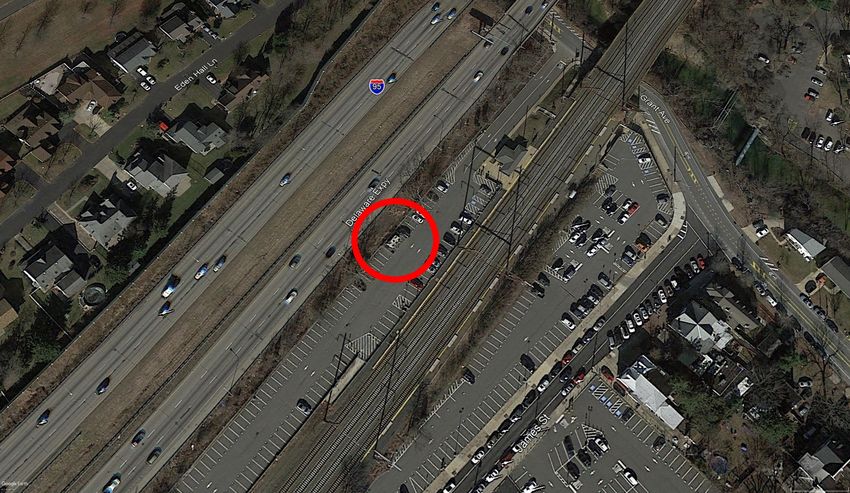
Tables
Table 1 – Site Summary Table                                                        11
Table 2 – Detailed LAB Information with Monitoring Station Picture                  22
Table 3 – Detailed ROX Information with Monitoring Station Picture                  25
Table 4 – Detailed NEA Information with Monitoring Station Picture                  28
Table 5 – Detailed NEW Information with Monitoring Station Picture                  31
Table 6 – Detailed RIT Information with Monitoring Station Picture                  35
Table 7 – Detailed FAB Information with Monitoring Station Picture                  38
Table 8 – Detailed SWA Information with Monitoring Station Picture                  41
Table 9 – Detailed TOR Information with Monitoring Station Picture                  44
Table 10 – Detailed MON Information with Monitoring Station Picture                 47
Table 11 – Detailed VGR Information with Monitoring Station Picture                 51

                                       Figures
Figure 1 – 2021 Philadelphia Air Monitoring Network as of July 1, 2021              9
Figure 2 – LAB Monitoring Site Map with Major Streets and Major Emission Sources    23
Figure 3 – LAB North Aerial View                                                    24
Figure 4 – ROX Monitoring Site Map with Major Streets and Major Emission Sources    26
Figure 5 – ROX North Aerial View                                                    27
Figure 6 – NEA Monitoring Site Map with Major Streets and Major Emission Sources    29
Figure 7 – NEA North Aerial View                                                    30
Figure 8 – NEW Monitoring Site Map with Major Streets and Major Emission Sources    33
Figure 9 – NEW North Aerial View                                                    34
Figure 10 – RIT Monitoring Site Map with Major Streets and Major Emission Sources   36
Figure 11 – RIT North Aerial View                                                   37
Figure 12 – FAB Monitoring Site Map with Major Streets and Major Emission Sources   39
Figure 13 – FAB North Aerial View                                                   40
Figure 14 – SWA Monitoring Site Map with Major Streets and Major Emission Sources   42
Figure 15 – SWA North Aerial View                                                   43
Figure 16 – TOR Monitoring Site Map with Major Streets and Major Emission Sources   45
Figure 17 – TOR North Aerial View                                                   46
Figure 18 – MON Monitoring Site Map with Major Streets and Major Emission Sources   49
Figure 19 – MON North Aerial View                                                   50
Figure 20 – VGR Monitoring Site Map with Major Streets and Major Emission Sources   52
Figure 21 – VGR North Aerial View                                                   53

                                         Page v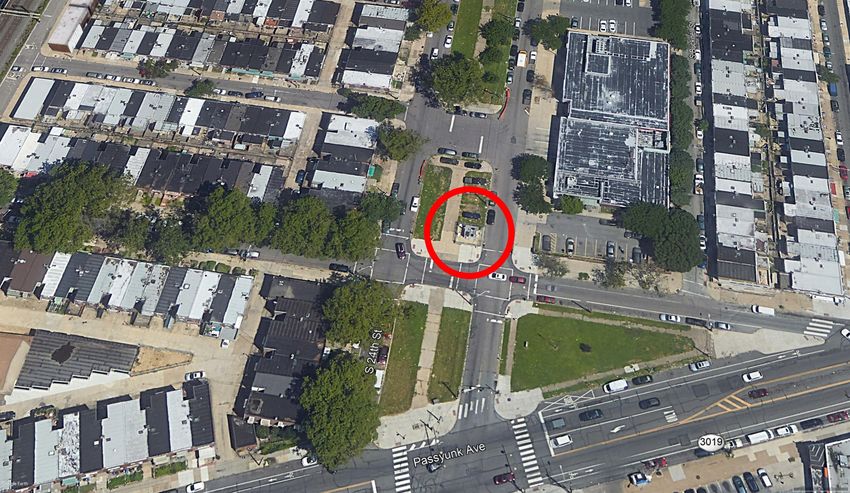
Appendices
Appendix A – PAMS Monitoring Implementation Network Plan                        54
Appendix B – Philadelphia Air Quality Survey & Quality Assurance Project Plan   60
Appendix C – 2020 Community-Scale Air Toxics Ambient Monitoring Grant           63
Appendix D – Proof of Publication                                               66

                                         Page vi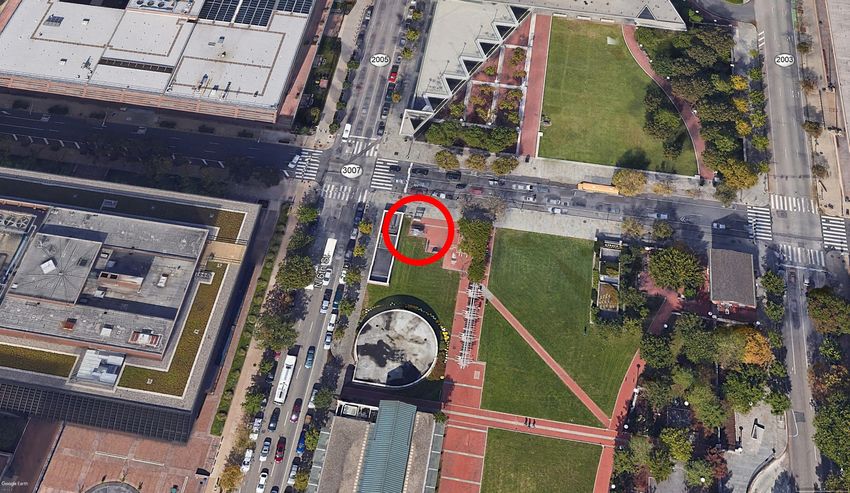
Public Participation
The Code of Federal Regulations (CFR) Title 40: Protection of Environment, Part 58: Ambient
Air Quality Surveillance requires state and local air pollution control agencies to adopt and
submit to the Environmental Protection Agency (EPA) Regional Administrator an Annual
Monitoring Network Plan (AMNP) by July 1, 2021. The AMNP provides for the establishment
and maintenance of an air quality surveillance system that consists of a network of monitoring
stations. A proposed AMNP must be made available for public inspection and comment for at
least 30 days prior to submission to EPA.

Air Management Services (AMS) is the local air pollution control agency for the City of
Philadelphia under the Department of Public Health. Philadelphia has an air monitoring network
of 10 air monitoring stations that house instruments that measure ambient levels of air pollutants.

The proposed AMNP is available for public inspection on the City’s website at
https://www.phila.gov/departments/air-pollution-control-board/air-management-notices/ and at
the office of Air Management Services, 321 University Avenue, 2nd Floor, Philadelphia, PA
19104, during normal business hours. For further information, contact Mr. Jason Li, Engineering
Supervisor of Program Services at (215) 685-9440.

Written comments on the proposed AMNP should be sent to Mr. Jason Li, Engineering
Supervisor of Program Services, Air Management Services, 321 University Avenue, 2nd Floor,
Philadelphia, PA 19104 or via email at jiazheng.li@phila.gov. Use “2021 Air Monitoring
Network Plan” as the subject line in written communication. Only written comments will be
accepted. Comments received by facsimile will not be accepted. Persons wishing to file
comments on the proposed AMNP must submit comments by May 17, 2021.

                                              Page 1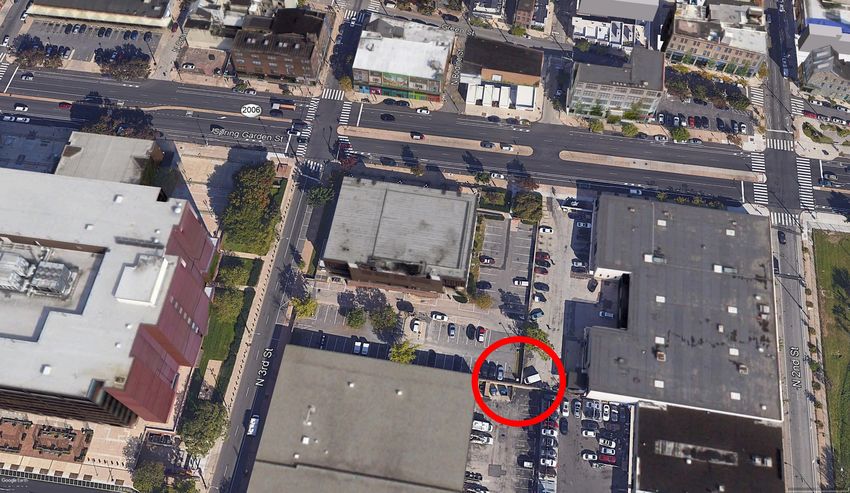
Definitions
Air Monitoring Programs
EPA has established various air monitoring programs for the measurement of pollutants. Some of
these are briefly described below. Later in this AMNP, air monitoring sites and monitoring
equipment are specifically identified relative to these air monitoring programs:

   o CSN – Chemical Speciation Network. It is a PM2.5 sampling network with sites located
     principally in urban areas.
   o NATTS – National Air Toxics Trends Stations. This network provides ambient levels of
     hazardous air pollutants. These sites are established with the intent that they will operate
     over many years and provide both current and historical information.
   o NCore – National Core multi-pollutant monitoring stations. Monitors at these sites are
     required to measure particles (PM2.5, speciated PM2.5, PM10-2.5), O3, SO2, CO, nitrogen
     oxides (NO/NO2/NOy), and basic meteorology. They principally support research in air
     pollution control.
   o SLAMS – State or Local Air Monitoring Stations. The SLAMS make up the ambient air
     quality monitoring sites that are primarily needed for NAAQS comparisons, but may
     serve other data purposes. SLAMS exclude special purpose monitor (SPM) stations and
     include NCore, PAMS, Near-road NO2/CO and all other State or locally operated stations
     that have not been designated as SPM stations.
   o PAMS – Photochemical Assessment Monitoring Station for the enhanced monitoring of
     ozone, oxides of nitrogen (NOx), and volatile organic compounds (VOC) to obtain more
     comprehensive and representative data on ozone air pollution..
   o SPM – Special Purpose Monitor. As the name implies these monitors are placed for
     purposes of interest to the city of Philadelphia. Often this monitoring is performed over a
     limited amount of time. Data is reported to the federal Air Quality System (AQS) and is
     not counted when showing compliance with the minimum requirements of the air
     monitoring regulations for the number and siting of monitors of various types.
   o Urban Air Toxics – Urban Air Toxics (UAT) monitoring addresses toxic air pollutant
     emissions in urban areas. UAT air monitoring is regularly conducted for volatile organic
     compounds (VOCs).

Measurement Methods
   o Federal Equivalent Method (FEM) – A method for measuring the concentration of an
     air pollutant in the ambient air that has been designated as an equivalent method in
     accordance with 40 CFR Part 53; it does not include a method for which an equivalent
     method designation has been canceled in accordance with 40 CFR Part 53.11 or 40 CFR
     Part 53.16.
   o Federal Reference Method (FRM) – A method of sampling and analyzing the ambient
     air for an air pollutant that is specified as a reference method in an appendix to 40 CFR
     Part 50, or a method that has been designated as a reference method in accordance with
     this part; it does not include a method for which a reference method designation has been
     canceled in accordance with 40 CFR Part 53.11 or 40 CFR Part 53.16.

                                            Page 2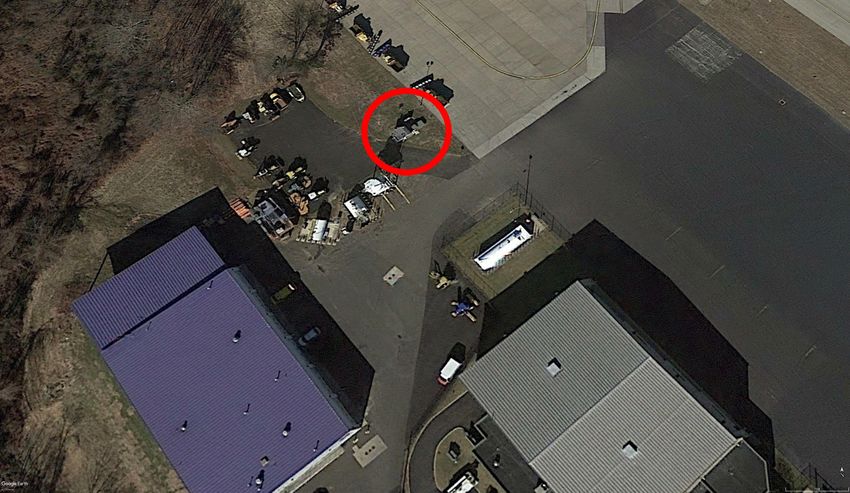
Monitoring Objectives
The ambient air monitoring networks must be designed to meet three basic monitoring
objectives:
    o Provide air pollution data to the general public in a timely manner.
    o Support compliance with ambient air quality standards and emissions strategy
        development.
    o Assist in the evaluation of regional air quality models used in developing emission
        strategies, and to track trends in air pollution abatement control measures’ impact on
        improving air quality.

In order to support the air quality management work indicated in the three basic air monitoring
objectives, a network must be designed with a variety of different monitoring sites. Monitoring
sites must be capable of informing managers about many things including the peak air pollution
levels, typical levels in populated areas, air pollution transported into and outside of a city or
region, and air pollution levels near specific sources.

Spatial Scales
The physical siting of the air monitoring station must be consistent with the objectives, site type
and the physical location of a particular monitor.

The goal in locating monitors is to correctly match the spatial scale represented by the sample of
monitored air with the spatial scale most appropriate for the monitoring site type, air pollutant to
be measured, and the monitoring objective.

The spatial scale results from the physical location of the site with respect to the pollutant
sources and categories. It estimates the size of the area surrounding the monitoring site that
experiences uniform pollutant concentrations. The categories of spatial scale are:

   o Microscale – Defines concentrations in air volumes associated with area dimensions
     ranging from several meters up to about 100 meters.
   o Middle scale – Defines concentration typical of areas up to several city blocks in size
     with dimensions ranging from about 100 meters to 0.5 kilometer.
   o Neighborhood scale – Defines concentrations within some extended area of the city that
     has relatively uniform land use with dimensions in the 0.5 to 4.0 kilometers range. The
     neighborhood and urban scales listed below have the potential to overlap in applications
     that concern secondarily formed or homogeneously distributed air pollutants.
   o Urban scale – Defines concentrations within an area of city-like dimensions, on the order
     of 4 to 50 kilometers. Within a city, the geographic placement of sources may result in
     there being no single site that can be said to represent air quality on an urban scale.
   o Regional scale – Defines usually a rural area of reasonably homogeneous geography
     without large sources, and extends from tens to hundreds of kilometers.
   o National and global scales – These measurement scales represent concentrations
     characterizing the nation and the globe as a whole.

                                               Page 3
Air Monitoring Area
o Core-Based Statistical Area (CBSA) – Defined by the U.S. Office of Management and
Budget, as a statistical geographic entity consisting of the county or counties associated
with at least one urbanized area/urban cluster of at least a population of 10,000 people,
plus adjacent counties having a high degree of social and economic integration.
o Metropolitan Statistical Area (MSA) – A Core-Based Statistical Area (CBSA)
associated with at least one urbanized area of a population of 50,000 people or more. The
central county plus adjacent counties with a high degree of integration comprise the area.
Pollutants and Parameters
Air Management Services monitors for a wide range of air pollutants and parameters:
o Criteria Pollutants are measured to assess if and how well we are meeting the National
Ambient Air Quality Standards (NAAQS) that have been set for each of these pollutants.
These standards are set to protect the public’s health and welfare.
o Ozone (O3)
o Sulfur Dioxide (SO2)
o Carbon Monoxide (CO)
o Nitrogen Dioxide (NO2)
NO means nitrogen oxide.
NOX means oxides of nitrogen and is defined as the sum of the
concentrations of NO2 and NO.
NOy means the sum of all total reactive nitrogen oxides, including NO,
NO2, and other nitrogen oxides referred to as NOZ.
o Particulate
PM2.5 means particulate matter with an aerodynamic diameter less than or
equal to a nominal 2.5 micrometers.
PM10 means particulate matter with an aerodynamic diameter less than or
equal to a nominal 10 micrometers.
PM Coarse means particulate matter with an aerodynamic diameter greater
than 2.5 micrometers and less than 10 micrometers.
Ultrafine Particulate Matter means particulate matter with an aerodynamic
diameter less than 0.1 micrometers.
o Lead (Pb)
o BaP – means Benzo(a)Pyrene, a polycyclic aromatic hydrocarbon that is a product of
incomplete combustion or burning organic (carbon-containing) items.
o Black Carbon – Black Carbon is a major component of "soot", a complex and most
strongly absorbing component of particulate matter (PM), that is formed by the
incomplete combustion of fossil fuels, biofuels, and biomass.
o MET – Meteorology parameters that may include temperature, relative humidity,
barometric pressure, wind speed, wind direction, mixing height, precipitation, solar and
UV radiation.
o Speciated PM2.5 – PM2.5 particles are analyzed to identify their makeup (60 components
including elements, radicals, elemental carbon, and organic carbon) and help assess the
level of health risk and identify sources that are contributing to the levels of PM2.5 being
measured.
Page 4o Toxics – Approximately 44 compounds, carbonyls – 7 compounds, and metals - 7
elements are toxic and are measured to assess the risk of cancer and non-cancer caused
by these pollutants. The VOC compounds are analyzed by GC/MS (EPA Compendium
Method TO-15); carbonyls are analyzed by HPLC or uHPLC, and metals by ICP-
MS(WV).
o PAMS Volatile Organic Compounds (VOC) – Approximately 57 of these compounds
are monitored to assist in understanding the formation of ozone and how to control this
pollutant. These compounds are analyzed by Auto GC-FID.
Collection Methods
Particulate samples
o Broadband Spectroscopy PM Mass Monitor – This instrument provides continuous
PM2.5 real-time mass measurements using broadband spectroscopy which combines
advanced LED technology with light scattering theory. Certain PM Mass Monitor Models
provide simultaneous, continuous PM10 and PM2.5, real-time PM mass measurements.
The following instruments provide concentration values of particulate over a 24-hour
period. Laboratory analysis is required before the concentration of particulate can be
determined.
o Hi-Vol – High-Volume Air Samplers (HVAS) are used to determine the concentration of
particulate matter in the air. All collected material is defined as total suspended (in the
air) particulates (TSP), including lead (Pb) and other metals. A Hi-Volume sampler
consists of two basic components: a motor similar to those used in vacuum cleaners and
an air flow control system.
o Met One SASS – Filters used to collect PM measurement of total mass by gravimetry,
elements by x-ray fluorescence.
o Filter-based PM2.5 – Filter-based PM2.5 monitors an air sample drawn through a Teflon
filter for 24 hours.
o URG – Filters used to collect PM measurement of organic and elemental carbon.
Gaseous / criteria pollutants
o Instrumental - Data from these instruments is telemetered to a central computer
system and values are available in near “real time”. An analyzer used to measure
pollutants such as: carbon monoxide, sulfur dioxide, nitrogen oxides and ozone.
Toxic and organic (VOC) pollutants
o SS Canister Pressurized – Ambient air is collected in stainless-steel canisters,
cryogenically concentrated using liquid nitrogen and analyzed for target VOCs and other
organic components by GC-FID and GC-MS.
o Canister Sub Ambient Pressure – Collection of ambient air into an evacuated canister
with a final canister pressure below atmospheric pressure.
o DNPH-Coated Cartridges – Cartridges are coated with 2,4-dinitrophenylhydrazine
(DNPH). This is used for carbonyl determination in ambient air. Ultra-High and High
Performance Liquid Chromatography (uHPLC and HPLC) measures the carbonyl.
Page 5Analysis Methods
Particulate concentration
o Gravimetric – The determination of the quantities of the constituents of a compound,
describes a set of methods for the quantitative determination of an analyte based on the
weight of a solid. Laboratory analysis is needed.
o Broadband Spectroscopy – Broadband spectroscopy combines advanced LED
technology with light scattering theory. Certain PM Mass Monitor Models provide
simultaneous, continuous PM10 and PM2.5, real-time PM mass measurements.
Composition/make-up of particulates
o Energy Dispersive XRF – Energy dispersive x-Ray Fluorescence Spectrometer for the
determination of species in ambient particulate matter.
o Ion Chromatography – Ion-exchange chromatography (or ion chromatography) is a
chromatography process that separates ions and polar molecules based on their affinity to
the ion exchanger for the determination of species in ambient particulate matter.
o IMPROVE – Thermal Optical Reflectance (TOR) analysis using the Interagency
Monitoring of Protected Visual Environments (IMPROVE)_A protocol.
o Inductively Coupled Plasma/Mass Spectrometry (ICP/MS) – Inductively Coupled
Plasma/Mass Spectrometry for the determination of metals including Lead concentration
in ambient particulate matter.
Gaseous / criteria pollutants
o Nitrogen Oxides – Chemiluminescence – Emission of light as a result of a chemical
reaction at environmental temperatures. This analysis is used for NO, NOx, and NOy.
NO2 is calculated as NOx- NO. True NO2 monitoring technology provides a direct NO2
measurement. The instrument utilizes a Cavity Attenuated Phase Shift (CAPS) technique.
o Carbon Monoxide – Gas Filter Correlation – Measures low ranges of carbon
monoxide by comparing infrared energy absorbed by a sample to that absorbed by a
reference gas according to the Beer-Lambert law. Using a Gas Filter Correlation Wheel, a
high energy IR light source is alternately passed through a CO filled chamber and a
chamber with no CO present. The light path then travels through the sample cell, which
has a folded path of 14 meters. The energy loss through the sample cell is compared with
the span reference signal provided by the filter wheel to produce a signal proportional to
concentration.
o Sulfur Dioxide – UV Fluorescent – UV Fluorescence Sulfur Dioxide Analyzer is a
microprocessor controlled analyzer that determines the concentration of sulfur dioxide
(SO2), in a sample gas drawn through the instrument’s sample chamber where it is
exposed to ultraviolet light, which causes any SO2 present to fluoresce. The instrument
measures the amount of fluorescence to determine the amount of SO2 present in the
sample gas.
o Ozone – Ultra Violet - A light, which supplies energy to a molecule being analyzed.
Ozone is analyzed with UV.
Toxic and volatile organic pollutants
o Cryogenic Preconcentration GC-FID – Cryogenic Preconcentration Gas
Chromatograph/Flame Ionization Detector - air injection volume for capillary GC
combined with low concentrations of analyte require that samples be preconcentrated
prior to GC analysis. Sample preconcentration is accomplished by passing a known
volume of the air sample through a trap filled with fine glass beads that is cooled to
Page 6-180oC. With this technique, the volatile hydrocarbons of interest are quantitatively
retained in the trap, whereas the bulk constituents of air (nitrogen, oxygen, etc.) are not.
The air sample is collected in a vessel of known volume. A portion of this volume is
analyzed and used to calculate concentration of each compound in the original air sample
after Gas Chromatographic (Flame Ionization Detector, GC-FID) analysis. The sample
trapped cryogenically on the glass beads is thermally desorbed into a stream of ultra-pure
helium and re-trapped on the surface of a fine stainless steel capillary cooled to -180o C.
This second cryogenic trapping stage "focuses" the sample into a small linear section of
tubing. The cold stainless steel capillary is ballistically heated (by electrical resistance)
and the focused sample quickly desorbs into the helium stream and is transferred to the
chromatographic column. Cryogen (liquid nitrogen, LN2) is used to obtain sub ambient
temperatures in the VOC concentration and GC. This analysis is used to determine the
concentration of Benzene and other organic compounds and VOC in the atmosphere.
o GC-MS – Gas Chromatograph/Mass Spectrometer. Analysis of organic or VOC are
conducted using a gas chromatograph (GC) with a mass spectrometer (MS) attached as
the detector. Cryogenic preconcentration with liquid nitrogen (LN2) is also used to trap
and concentrate sample components.
o Auto GC-FID – Automated Gas Chromatograph. Continuous hourly analysis of VOC
using airmoVOC C2-C6 (light volatile hydrocarbons) and airmoVOC C6-C12 (heavy
volatile hydrocarbons) analyzers with Flame Ionization Detection.
o High Pressure Liquid Chromatography (HPLC) – The analytical method used to
analyze carbonyl compounds such as acetaldehyde and formaldehyde. Carbonyl
compounds are collected on the sampling media as their 2,4-dinitrohydrazine derivatives.
The derivatives are separated by liquid chromatography (LC) on a packed column by
means of a solvent mixture under high pressure (HPLC) followed by UV detection of
each carbonyl derivative. Ultra-High Performance Liquid Chromatography (uHPLC)
allows for faster analysis time as well as chromatograms with greater resolution.
Page 7Current Network at a Glance
The City of Philadelphia is served by a network of ten air monitoring sites located throughout the
City that measure the criteria pollutants (except lead 1): ozone (O3), carbon monoxide (CO),
nitrogen dioxide (NO2), sulfur dioxide (SO2), and particulate matter (PM10 and PM2.5). Four of
the sites also measure toxics, such as benzene, acetaldehyde, and formaldehyde. The map below
shows the location of air monitors and the pollutants measured at each monitor location.
1
EPA waved monitoring lead since 2017 because the 2014-2016 design value was 0.04 ug/m3.
Page 8Figure 1 - 2021 Philadelphia Air Monitoring Network as of July 1, 2021
Page 9Summary of Current Sites
All of our ten monitoring sites are located in Philadelphia, PA:
State: Pennsylvania
City: Philadelphia
County: Philadelphia
Metropolitan Statistical Area (MSA): Philadelphia – Camden - Wilmington, PA-NJ-DE-MD
MSA number: 37980
Population: 6,102,434 (2019 annual estimate) 2
EPA Region: III, Philadelphia
Class I area: Brigantine Natural Wildlife Preserve near Atlantic City, NJ
City population: 1,584,064 (2019 annual estimate) 3
Time zone: EST
UTM zone: 18
2
MSA population estimates from:
https://www.census.gov/data/tables/time-series/demo/popest/2010s-total-metro-and-micro-statistical-areas.html
3
Philadelphia County population estimates from:
https://www.census.gov/data/tables/time-series/demo/popest/2010s-counties-total.html
Page 10Table 1 – Site Summary Table
AQS Site AMS
Address Statement of Purpose
Code Site
Built in 1964, is a good site to test new or complex monitoring
421010004 LAB 1501 E. Lycoming St.
methods as laboratory staff are readily available.
421010014 ROX Eva & Dearnley Sts. Periphery site.
Periphery site.
421010024 NEA Grant Ave & Ashton Rd.
High Ozone.
Originally sited to measure the impact of Franklin Smelting
and Refining (now closed), MDC (now closed), and the waste
421010048 NEW 2861 Lewis St.
water treatment plant. In 2013, the NCore site was re-located
here and in 2017 is a designated PAMS site.
This site was selected to help assess the impact of the
421010055 RIT 24th & Ritner Sts. petroleum refinery on the local community. The area was
identified by air quality modeling.
This site was established to represent the highest levels of
PM2.5 in the City based on EPA Region III’s air quality
421010057 FAB 3 & Spring Garden Sts.
rd
modeling of air toxics in Philadelphia. It shows high levels of
PM2.5 created by vehicle traffic.
This site was established to measure toxics, carbonyls, and
421010063 SWA 8200 Enterprise Ave. metals. EPA Region III modeling analysis showed areas near
the airport to have high levels of aldehydes.
This site was established as the 1st near-road NO2 monitor in
421010075 TOR 4901 Grant Ave & James St. the Philadelphia-Camden-Wilmington, PA-NJ-DE-MD
Metropolitan Statistical Area.
This site was established as the 2nd near-road NO2 monitor in
421010076 MON I-76 & Montgomery Drive the Philadelphia-Camden-Wilmington, PA-NJ-DE-MD
Metropolitan Statistical Area.
EPA’s Village Green Air Monitoring Station. Utilizes solar
VGR 6th & Arch Sts. and wind turbine power as energy sources. Sited to increase
community awareness of environmental conditions.
Page 11Direction of Future Air Monitoring
The agency will study and assess the overall monitoring program within the City to determine
the course of future changes to the air monitoring network.
The agency will focus on the following:
• The agency will re-evaluate the number and monitoring locations for toxics due to
decreased EPA funding and health risks in key locations.
• The agency will consider monitoring data from the Philadelphia Air Quality Survey
(PAQS) project, the Community Scale Air Toxics Ambient Monitoring grant, the mobile
monitoring project, and other monitoring projects to evaluate concentrations of air
pollutants throughout the city. Based on these results, the agency plans to propose
updates to FRM/FEM and air toxics monitoring locations.
• Improve the understanding of particulate and air toxic pollutants in Philadelphia.
o The agency plans to pursue negotiations with the port entities in order to
implement monitoring and emission inventory efforts in this location.
• The agency would like to consider Environmental Justice during the development of the
Air Monitoring Network Plan and look to investigate concentrations in these
communities.
• The agency would like to consider the establishment of an asset management framework
for the monitoring system and develop an air quality monitoring modernization plan as
opportunities for sustainability.
• The agency would like to understand the performance and remedy the challenges on the
use of low-cost sensors to provide real-time, local-scale air quality information.
Page 12Proposed Changes to the Network
Below are changes that are anticipated to occur over the next 18 months to the existing air
monitoring network:
• March 2021 – December 2022
o PAMS Monitoring set to begin by June 1, 2021.
See Appendix A for latest PAMS Monitoring Implementation Plan.
o Establish a PM2.5 monitor at LAB – starting date to be determined.
o Real-time data is planned to be available in the Summer of 2021 at
https://www.pandonia-global-network.org for the PANDORA spectrometer
installed in March of 2021 at the NEW site. The PANDORA spectrometer is an
operational research instrument from National Aeronautics and Space
Administration (NASA) in partnership with EPA that takes column measurements
of O3, SO2, formaldehyde, BrO, NO2, and H2O available at PAMS sites.
o Philadelphia Air Quality Survey.
AMS will continue to maintain sites and sample ambient air as shown in
Appendix B.
o AMS awarded EPA’s Community-Scale Air Toxics Ambient Monitoring grant
for 2020.
See Appendix C for more information.
o A mobile monitoring station is planned to be added in the Fall of 2021 that will
measure BTEX (Benzene, Toluene, Ethylbenzene, m-, o-, and p- Xylene), NO,
NO2, SO2, O3, PM2.5, meteorological data, CO, CO2, CH4, H2O, and Total VOCs
measurement calibrated to Isobutylene. A modified Ford Transit 250 will include
GPS to track speed and direction and can be used while the vehicle is in motion or
stationary.
o AMS plans to assist EPA on a port monitoring project.
Page 13NCore Monitoring Network
The requirements for the NCore air monitoring network are codified in 40 CFR Part 58.10(a)(3)
and 40 CFR Part 58 Appendix D section 3.
The NCore station is located at NEW.
As codified in 40 CFR Part 58 Appendix D section 5(a), PAMS measurements are required at
NCore sites that are in Core-Based Statistical Areas (CBSAs) with populations of 1,000,000 or
more. 40 CFR Part 58.13(h) requires the PAMS sites to be established and operating no later
than June 1, 2021.
The PAMS Monitoring Implementation Network Plan is included in Appendix A.
Page 14Pb Monitoring Network
The requirements for the Pb air monitoring network are codified in 40 CFR Part 58.10(a)(4) and
40 CFR Part 58 Appendix D section 4.5.
Philadelphia County has no source oriented Pb sources that emit 0.50 or more tons per year.
Page 15NO2 Monitoring Network
The requirements for the NO2 air monitoring network are codified in 40 CFR Part 58.10(a)(5)
and 40 CFR Part 58 Appendix D section 4.3.
AMS currently operates an NO2 monitor that meets the area-wide monitoring requirements. The
first near-road NO2 monitor was established at TOR and started operation on January 1, 2014.
The second near-road NO2 monitor is located at MON and started operation on July 20, 2015.
Page 16SO2 Monitoring Network
The requirements for the SO2 air monitoring network are codified in 40 CFR Part 58.10(a)(6)
and 40 CFR Part 58 Appendix D section 4.4.
Page 17CO Monitoring Network
The requirements for the CO air monitoring network are codified in 40 CFR Part 58.10(a)(7) and
40 CFR Part 58 Appendix D section 4.2.
The Philadelphia-Camden-Wilmington, PA-NJ-DE-MD CBSA has a CO monitor collocated
with the near-road NO2 monitor at TOR and has been operational since January 1, 2014.
Page 18PM2.5 Monitoring Network
The requirements for the PM2.5 air monitoring network are codified in 40 CFR Part 58.10(a)(8)
and 40 CFR Part 58 Appendix D section 4.7.
The requirement for at least one PM2.5 monitor to be collocated at a near-road NO2 station for
CBSAs with a population of 1,000,000 or more persons is met at the TOR monitoring site.
Page 19O3 Monitoring Network
The requirements for the O3 air monitoring network are codified in 40 CFR Part 58.10(a)(9) –
(12) and 40 CFR Part 58 Appendix D section 4.1.
AMS currently operates three O3 monitors.
Enhanced Monitoring Plan
40 CFR Part 58 Appendix D. 5(h) requires: “States with Moderate and above 8-hour O3
nonattainment areas and states in the Ozone Transport Region as defined in 40 CFR 51.900
shall develop and implement an Enhanced Monitoring Plan (EMP) detailing enhanced O3 and
O3 precursor monitoring activities to be performed. The EMP shall be submitted to the EPA
Regional Administrator no later than October 1, 2019 or two years following the effective date of
a designation to a classification of Moderate or above O3 nonattainment, whichever is later. At
a minimum, the EMP shall be reassessed and approved as part of the 5-year network
assessments required under 40 CFR 58.10(d). The EMP will include monitoring activities
deemed important to understanding the O3 problems in the state. Such activities may include,
but are not limited to, the following:
(1) Additional O3 monitors beyond the minimally required under paragraph 4.1 of this
appendix,
(2) Additional NOx or NOy monitors beyond those required under 4.3 of this appendix,
(3) Additional speciated VOC measurements including data gathered during different
periods other than required under paragraph 5(g) of this appendix, or locations other
than those required under paragraph 5(a) of this appendix, and
(4) Enhanced upper air measurements of meteorology or pollution concentrations.”
Please note only States, not local counties, are required to submit an EMP to the EPA. AMS will
work with PADEP for enhanced O3 and O3 precursor monitoring.
Currently, AMS monitors the following beyond the minimal requirements:
(1) Year round ozone monitoring at all sites.
Pending funding for EMPs, AMS cannot guarantee that year round monitoring will continue.
PAMS Monitoring Implementation Network Plan is included in Appendix A.
Page 20Detailed Information on Each Site
The tables that follow provide detailed information for each of the 10 monitoring stations in
Philadelphia County. As per 40 CFR Part 58.10(a)(1), the siting and operation of each monitor in
the 2021-2022 AMNP meets the requirements of 40 CFR Part 58 and Appendices A, B, C, D,
and E of this part where applicable.
Page 21Table 2 – Detailed LAB Information with Monitoring Station Picture
AMS SITE ID: LAB
AQS Site ID: 421010004
Street Address: 1501 E. Lycoming Street, 19124
Geographical Coordinates
Latitude: 40.008889
Longitude: -75.09778
Monitor Probe
Monitoring Operating Collection Analysis Parameter AQS Monitoring Begin
Parameter Network Comments POC Spatial Scale Height
Type Schedule Method Method Code Method Objective Date
Affiliation (m)
Ultraviolet Year-round Population
Ozone SLAMS Continuous Instrumental 44201 2 087 Neighborhood 7 1/1/2018
Absorption operation Exposure
PM2.5 Teledyne T640 Broadband Population
SLAMS Continuous 88101 4 236 Neighborhood 2 TBD
Continuous at 5.0 LPM Spectroscopy Exposure
Page 22Figure 2 – LAB Monitoring Site Map with Major Streets and Major Emission Sources
Page 23Figure 3 – LAB North Aerial View
Page 24Table 3 – Detailed ROX Information with Monitoring Station Picture
AMS SITE ID: ROX
AQS Site ID: 421010014
Street Address: Eva & Dearnley Streets
Geographical Coordinates
Latitude: 40.049604
Longitude: -75.241209
Monitor
Monitoring Operating Analysis Parameter AQS Monitoring Probe Begin
Parameter Network Collection Method Comments POC Spatial Scale
Type Schedule Method Code Method Objective Height (m) Date
Affiliation
Urban Air DNPH-Coated Population
Carbonyls Other 1/6 days HPLC Vary 2 102 Neighborhood 4 5/7/2003
Toxics Cartridges Exposure
Canister
Urban Air Multi- Population
Toxics Other 1/6 days Subambient Vary 4,5 150 Neighborhood 4 1/1/2004
Toxics Detector GC Exposure
Pressure
Page 25Figure 4 – ROX Monitoring Site Map with Major Streets and Major Emission Sources
Page 26Figure 5 – ROX North Aerial View
Page 27Table 4 – Detailed NEA Information with Monitoring Station Picture
AMS SITE ID: NEA
AQS Site ID: 421010024
Street Address: Grant Ave & Ashton Rd
Geographical Coordinates
Latitude: 40.076389
Longitude: -75.011944
Monitor
Monitoring Operating Collection Analysis Parameter AQS Monitoring Probe Begin
Parameter Network Comments POC Spatial Scale
Type Schedule Method Method Code Method Objective Height (m) Date
Affiliation
Ultraviolet Year-round Highest
Ozone SLAMS Continuous Instrumental 44201 1 087 Neighborhood 6 1/1/1974
Absorption operation concentration
Page 28Figure 6 – NEA Monitoring Site Map with Major Streets and Major Emission Sources
Page 29Figure 7 – NEA North Aerial View
Page 30Table 5 – Detailed NEW information with Monitoring Station Picture
AMS SITE ID: NEW
AQS Site ID: 421010048
Street Address: 2861 Lewis Street
Geographical Coordinates
Latitude: 39.991389
Longitude: -75.080833
Monitor Probe
Monitoring Operating Collection Parameter AQS Monitoring Begin
Parameter Network Analysis Method Comments POC Spatial Scale Height
Type Schedule Method Code Method Objective Date
Affiliation (m)
Gas Filter Correlation CO Population
CO (trace) SLAMS NCORE Continuous Instrumental High sensitivity 42101 1 093 Neighborhood 2 10/2/2013
Analyzer Exposure
Population
SO2 (trace) SLAMS NCORE Continuous Instrumental Ultraviolet Fluorescence High sensitivity 42401 2 100 Neighborhood 2 10/2/2013
Exposure
Year-round Population
Ozone SLAMS NCORE Continuous Instrumental Ultraviolet Absorption 44201 1 087 Neighborhood 2 10/2/2013
operation Exposure
High sensitivity
Chemiluminescence Population
NO SLAMS NCORE Continuous Instrumental external converter 42601 1 099 Neighborhood 10 10/2/2013
Teledyne Exposure
mounted at 10m
High sensitivity
Chemiluminescence Population
NOy SLAMS NCORE Continuous Instrumental external converter 42600 1 699 Neighborhood 10 10/2/2013
Teledyne Exposure
mounted at 10m
Teledyne API
PM10 Population
SLAMS NCORE Continuous T640X at Broadband Spectroscopy 81102 2 239 Neighborhood 2 1/1/2019
Continuous Exposure
16.67 LPM
Teledyne API
PM2.5 Population
SLAMS NCORE Continuous T640 at 5.00 Broadband Spectroscopy 88101 5 236 Neighborhood 2 8/19/2020
Continuous Exposure
LPM
Teledyne API
PM2.5 Population
SLAMS NCORE Continuous T640X at Broadband Spectroscopy 88101 4 238 Neighborhood 2 1/1/2020
Continuous Exposure
16.67 LPM
Met One
Energy Dispersive XRF,
PM2.5 NCORE, SASS (Nylon Population
SLAMS 1/3 days Ion Chromatography and Analysis by EPA Vary 5 Vary Neighborhood 2 10/2/2013
Speciated CSN and Teflon) Exposure
IMPROVE
and URG
Population
PM2.5 FRM SLAMS NCORE 1/3 days R&P PM2.5 Gravimetric NEW-D 88101 1 145 Neighborhood 2 10/2/2013
Exposure
Teledyne API
PM10-2.5 Population
SLAMS NCORE Continuous T640X at Broadband Spectroscopy 86101 4 240 Neighborhood 2 1/1/2019
(PM Coarse) Exposure
16.67 LPM
Air quality measurements
approved instrumentation Population
Meteorological SLAMS NCORE Continuous Vary 1 Vary Neighborhood 10 6/1/1993
for wind speed, wind Exposure
direction, humidity,
Page 31barometric pressure,
rainfall, and solar radiation
In addition to the 1-
in-6 days UAT
sampling, also
DNPH- sampling for three
Urban Air Population
Carbonyls Other 1/6 days Coated HPLC of 8-hour periods Vary 1,3 102 Neighborhood 7 10/14/2016
Toxics Exposure
Cartridges every 3rd day
during PAMS
season (June 1 -
Aug 31)
Canister
Urban Air Population
Toxics Other 1/6 days Subambient Multi-Detector GC Vary 1,2 150 Neighborhood 7 10/14/2016
Toxics Exposure
Pressure
Year-round Population
PAMS VOC SLAMS PAMS Continuous CAS Auto GC Vary Neighborhood 5 6/1/2021
operation Exposure
Ceilometer SLAMS PAMS Continuous Vaisala 1/1/2018
Solar radiation SLAMS PAMS Continuous MetOne
UV radiation SLAMS PAMS Continuous Eppley
Precipitation SLAMS PAMS Continuous MetOne
Teledyne Cavity Attenuated Phase Population
True NO2 SLAMS PAMS Continuous 42602 1 212 Neighborhood 4/1/2019
Model T500U Shift Spectroscopy Exposure
Page 32Figure 8 – NEW Monitoring Site Map with Major Streets and Major Emission Sources
Page 33Figure 9 – NEW North Aerial View
Page 34Table 6 – Detailed RIT Information with Monitoring Station Picture
AMS SITE ID: RIT
AQS Site ID: 421010055
Street Address: 24th & Ritner Streets
Geographical Coordinates
Latitude: 39.922867
Longitude: -75.186921
Monitor Probe
Monitoring Operating Collection Parameter AQS Monitoring Begin
Parameter Network Analysis Method Comments POC Spatial Scale Height
Type Schedule Method Code Method Objective Date
Affiliation (m)
Ultraviolet Population
SO2 SLAMS Continuous Instrumental 42401 1 100 Neighborhood 4 11/9/2004
Fluorescence Exposure
Met One SASS Energy Dispersive XRF,
PM2.5 Population
SLAMS CSN 1/3 days (Nylon and Ion Chromatography Analysis by EPA Vary 5 Vary Neighborhood 2 9/1/2005
Speciated Exposure
Teflon) and URG and IMPROVE
Analysis by WV
Population
Metals Other 1/6 days Hi-Vol ICP-MS (TSP sampler Vary 1 089 Neighborhood 4 8/31/2004
Exposure
with quartz)
Urban Air DNPH-Coated Population
Carbonyls Other 1/6 days HPLC Vary 2 102 Neighborhood 4 Vary
Toxics Cartridges Exposure
Canister
Urban Air Population
Toxics Other 1/6 days Subambient Multi-Detector GC Vary 4,5 150 Neighborhood 4 11/1/2004
Toxics Exposure
Pressure
PM2.5 Teledyne T640 at Broadband Population
SLAMS Continuous 88101 2 236 Neighborhood 4 4/1/2020
Continuous 5.0 LPM Spectroscopy Exposure
Page 35Figure 10 – RIT Monitoring Site Map with Major Streets and Major Emission Sources
Page 36Figure 11 – RIT North Aerial View
Page 37Table 7 – Detailed FAB Information with Monitoring Station Picture
AMS SITE ID: FAB
AQS Site ID: 421010057
Street Address: 3rd and Spring Garden Sts.
Geographical Coordinates
Latitude: 39.960048
Longitude: -75.142614
Monitor Probe
Monitoring Operating Collection Analysis Parameter AQS Monitoring Begin
Parameter Network Comments POC Spatial Scale Height
Type Schedule Method Method Code Method Objective Date
Affiliation (m)
PM2.5 Teledyne T640 Broadband Highest
SLAMS Continuous 88101 2 236 Neighborhood 2 1/1/2020
Continuous at 5.0 LPM Spectroscopy Concentration
Page 38Figure 12 – FAB Monitoring Site Map with Major Streets and Major Emission Sources
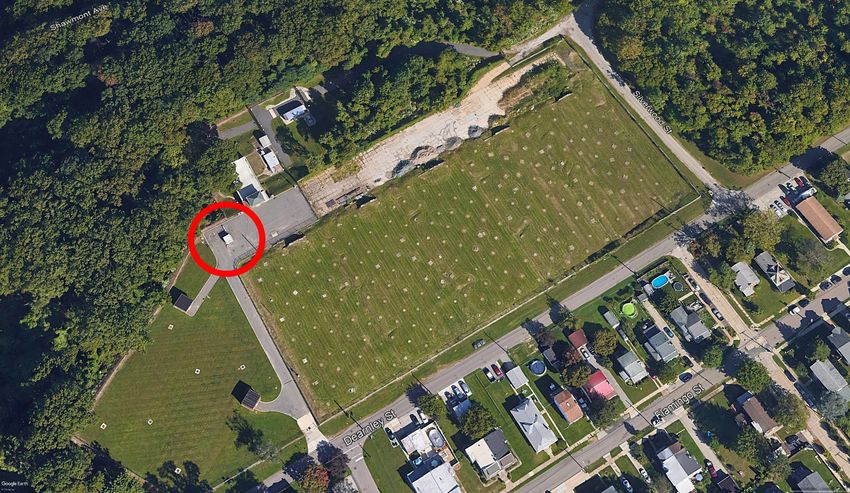
Page 39Figure 13 – FAB North Aerial View
Page 40Table 8 – Detailed SWA Information with Monitoring Station Picture
AMS SITE ID: SWA
AQS Site ID: 421010063
Street Address: 8200 Enterprise Avenue, 19153
Geographical Coordinates
Latitude: 39.88294
Longitude: -75.21965
Monitor
Monitoring Operating Analysis Parameter AQS Monitoring Probe Begin
Parameter Network Collection Method Comments POC Spatial Scale
Type Schedule Method Code Method Objective Height (m) Date
Affiliation
Urban Air DNPH-Coated Source-
Carbonyls Other 1/6 days HPLC Vary 2 102 Neighborhood 4 9/10/2009
Toxics Cartridges Oriented
Canister
Urban Air Multi- Source-
Toxics Other 1/6 days Subambient Vary 3,5 150 Neighborhood 4 9/10/2009
Toxics Detector GC Oriented
Pressure
Page 41Figure 14 – SWA Monitoring Site Map with Major Streets and Major Emission Sources
Page 42Figure 15 – SWA North Aerial View
Page 43Table 9 – Detailed TOR Information with Station Monitoring Picture
AMS SITE ID: TOR
AQS Site ID: 421010075
Street Address: 4901 Grant Ave. & James St., 19114
Geographical Coordinates
Latitude: 40.054171
Longitude: -74.985166
Monitor Probe
Monitoring Operating Collection Parameter AQS Spatial Monitoring Begin
Parameter Network Analysis Method Comments POC Height
Type Schedule Method Code Method Scale Objective Date
Affiliation (m)
Highest
Gas Filter Correlation
CO SLAMS Near Road Continuous Instrumental 42101 1 093 Microscale Concentration, 5 1/1/2014
CO Analyzer
Source Oriented
Highest
Gas Phase
NO2 SLAMS Near Road Continuous Instrumental 42602 1 099 Microscale Concentration, 5 1/1/2014
Chemiluminescence
Source Oriented
Highest
Gas Phase
NO SLAMS Near Road Continuous Instrumental 42601 1 099 Microscale Concentration, 5 1/1/2014
Chemiluminescence
Source Oriented
Highest
Gas Phase
NOx SLAMS Near Road Continuous Instrumental 42603 1 099 Microscale Concentration, 5 1/1/2014
Chemiluminescence
Source Oriented
Highest
PM2.5 Teledyne T640 Broadband
SLAMS Near Road Continuous 88101 2 236 Microscale Concentration, 5 4/1/2020
Continuous at 5.0 LPM Spectroscopy
Source Oriented
Highest
Vaisala 435C RH/AT
Meteorological SLAMS Near Road Continuous Vary 1 Vary Microscale Concentration, 5 1/1/2014
Sensor
Source Oriented
Page 44Figure 16 – TOR Monitoring Site Map with Major Streets and Major Emission Sources
Page 45Figure 17 – TOR North Aerial View
Page 46Table 10 Detailed MON Information with Monitoring Station Picture
AMS SITE ID: MON
AQS Site ID: 421010076
Street Address: I-76 & Montgomery Drive, Car Barn OFM Shop 282
Geographical Coordinates
Latitude: 39.988842
Longitude: -75.207205
Monitor Probe
Monitoring Operating Collection Parameter AQS Monitoring Begin
Parameter Network Analysis Method Comments POC Spatial Scale Height
Type Schedule Method Code Method Objective Date
Affiliation (m)
Highest
Gas Filter Correlation Concentration,
CO SLAMS Near Road Continuous Instrumental 42101 1 093 Microscale 4 1/10/2017
CO Analyzer Source
Oriented
Highest
Gas Phase Concentration,
NO2 SLAMS Near Road Continuous Instrumental 42602 1 099 Microscale 4 7/1/2015
Chemiluminescence Source
Oriented
Highest
Gas Phase Concentration,
NO SLAMS Near Road Continuous Instrumental 42601 1 099 Microscale 4 7/1/2015
Chemiluminescence Source
Oriented
Highest
Gas Phase Concentration,
NOx SLAMS Near Road Continuous Instrumental 42603 1 099 Microscale 4 7/1/2015
Chemiluminescence Source
Oriented
Highest
Teledyne
PM2.5 Broadband Concentration,
SLAMS Near Road Continuous T640 at 5.0 88101 2 236 Neighborhood 4 6/1/2020
Continuous Spectroscopy Source
LPM
Oriented
Highest
Concentration,
Black Carbon SLAMS Near Road Continuous Instrumental Teledyne Model 633 88317 1 894 Microscale 4 7/1/2015
Source
Oriented
Highest
Ultrafine Concentration,
SLAMS Near Road Continuous Instrumental Teledyne Model 651 87101 1 173 Microscale 4 7/1/2015
Particulate Source
Oriented
Page 47Integrated
samplers.
Highest
Hi-Vol- Weighed by
Concentration,
BaP SLAMS Near Road 1/6 days SA/GMW- Gravimetric AMS. 17242 1 091 Microscale 4 7/1/2015
Source
321-B Analysis by
Oriented
Allegheny
County, PA
Analysis by
WV (TSP Population
Metals Other Near Road 1/6 days Hi-Vol ICP-MS Vary 1 089 Neighborhood 4 7/1/2015
sampler with Exposure
quartz)
Air quality
measurements
approved Highest
instrumentation for wind Concentration,
Meteorological SLAMS Near Road Continuous Vary 1 Vary Microscale 4 7/1/2015
speed, wind direction, Source
humidity, barometric Oriented
pressure, rainfall, and
solar radiation
Page 48Figure 18 – MON Monitoring Site Map with Major Streets and Major Emission Sources
Page 49Figure 19 – MON North Aerial View
Page 50Table 11 – Detailed VGR Information with Monitoring Station Picture
AMS SITE ID: VGR
AQS Site ID:
Street Address: 6th & Arch Streets
Geographical Coordinates
Latitude: 39.952608
Longitude: -75.149704
Monitor Probe
Monitoring Operating Collection Parameter AQS Spatial Monitoring Begin
Parameter Network Analysis Method Comments POC Height
Type Schedule Method Code Method Scale Objective Date
Affiliation (m)
2B
Ozone Continuous Not in AQS 3/15/2015
Technologies
PM2.5
Continuous Thermo Not in AQS 3/15/2015
Continuous
Wind speed, wind
Meteorological Continuous direction, humidity, Not in AQS 3/15/2015
temperature
Page 51Figure 20 – VGR Monitoring Site Map with Major Streets and Major Emission Sources
Page 52Figure 21 – VGR North Aerial View
Page 53Appendix A
PAMS Implementation Network Plan
Page 54PAMS Monitoring Implementation Network Plan
Monitoring Organizations Required To Operate At NCore Sites
Philadelphia Air Management Services operates one Photochemical Assessment Monitoring
Station (PAMS) site in the air monitoring network, at the NEW site, per the monitoring rule (80
FR 65292; October 26, 2015) which requires PAMS measurements June 1 through August 31 at
NCore sites that are located in Core-Based Statistical Areas (CBSAs) with populations of
1,000,000 or more.
The main objective of the PAMS program is to develop a database of ozone precursors and
meteorological measurements to support ozone model development and track the trends of
important ozone precursor concentrations. The EPA and other scientists use the data collected
from the PAMS network to develop, evaluate, and improve ozone models.
Per 85 FR 834; February 7, 2020, the EPA finalized a revision to the start date for the updated
PAMS monitoring site network established in 40 CFR part 58, Appendix D. This final action
extended the start date from June 1, 2019, to June 1, 2021, giving state and local air monitoring
agencies two additional years to acquire the necessary equipment and expertise needed to
successfully make the required PAMS measurements by the start of the 2021 PAMS season.
Network Decision
The NCore site located at NEW serves as the location of the required PAMS site and measures
the following parameters described below. An Inventory of equipment used at the site(s) is
provided in Attachment 2.
Auto GC Decision
Volatile organic compounds (VOCs) – A complete list of the targeted compounds are found in
Table 1.
We will measure hourly speciated VOC concentrations with an auto-gas chromatograph (GC)
using the Consolidated Analytical Systems (CAS).
Meteorology Measurements Decision
We will measure mixing height using the Vaisala CL51 Ceilometer.
Other Required Measurements
o Carbonyls - Carbonyl sampling at a frequency of three 8-hour samples on a one-in-three
day basis (~90 samples per PAMS sampling season) using ATEC Sampler and Waters
HPLC equipment for analysis. A complete list of the target carbonyl compounds may be
found in Table 1. The TO-11A test method, as used in the National Air Toxics Trends
(NATTS) program 4 will be used.
4
See NATTS Technical Assistance Document for TO-11A method.
Page 55o Nitrogen Oxides - Will monitor for NO and NOy (total oxides of nitrogen) in addition to
true NO2. The true NO2 is required to be measured with a direct reading NO2 analyzer,
cavity attenuated phase shift (CAPS) spectroscopy or photolytic-converter NOx analyzer.
We will measure true NO2 using the Teledyne T500U. NO and NOy will be measured
using Teledyne instrumentation as well.
Table 1 PAMS Target Compound List
Priority Compounds Optional Compounds
1 1,2,3-trimethylbenzene a 19 n-hexane b 1 1,3,5-trimethylbenzene 19 m-diethlybenzene
2 1,2,4-trimethylbenzene a 20 n-pentane 2 1-pentene 20 methylcyclohexane
3 1-butene 21 o-ethyltoluene a 3 2,2-dimethylbutane 21 methylcyclopentane
4 2,2,4-trimethylpentane b 22 o-xylene a,b 4 2,3,4-trimethylpentane 22 n-decane
5 acetaldehyde b,c 23 p-ethyltoluene a 5 2,3-dimethylbutane 23 n-heptane
6 acetone c,d 24 Propane 6 2,3-dimethylpentane 24 n-nonane
7 benzene a,b 25 propylene 7 2,4-dimethylpentane 25 n-octane
8 c-2-butene 26 styrene a,b 8 2-methylheptane 26 n-propylbenzene a
9 ethane d
27 toluene a,b
9 2-methylhexane 27 n-undecane
10 ethylbenzene a,b 28 t-2-butene 10 2-methylpentane 28 p-diethylbenzene
11 Ethylene 11 3-methylheptane 29 t-2-pentene
12 formaldehyde b,c 12 3-methylhexane 30 α/β-pinene
13 Isobutane 13 3-methylpentane 31 1,3 butadiene b
14 Isopentane 14 Acetylene 32 benzaldehyde c
15 Isoprene 15 c-2-pentene 33 carbon tetrachloride b
16 m&p-xylenes a,b
16 cyclohexane 34 Ethanol
17 m-ethyltoluene a 17 cyclopentane 35 Tetrachloroethylene b
18 n-butane 18 isopropylbenzene b
Source: Revisions to the Photochemical Assessment Monitoring Stations Compound Target List.
U.S. EPA, November 20, 2013
a
Important SOAP (Secondary Organic Aerosols Precursor) Compounds
b
HAP (Hazardous Air Pollutant) Compounds
c
Carbonyl compounds
d
Non-reactive compounds, not considered to be VOC for regulatory purposes
Page 56You can also read