2021 Proposed Operating Budget - Overview - City of Burlington
←
→
Page content transcription
If your browser does not render page correctly, please read the page content below

2021 Proposed Operating Budget
Overview

Overview
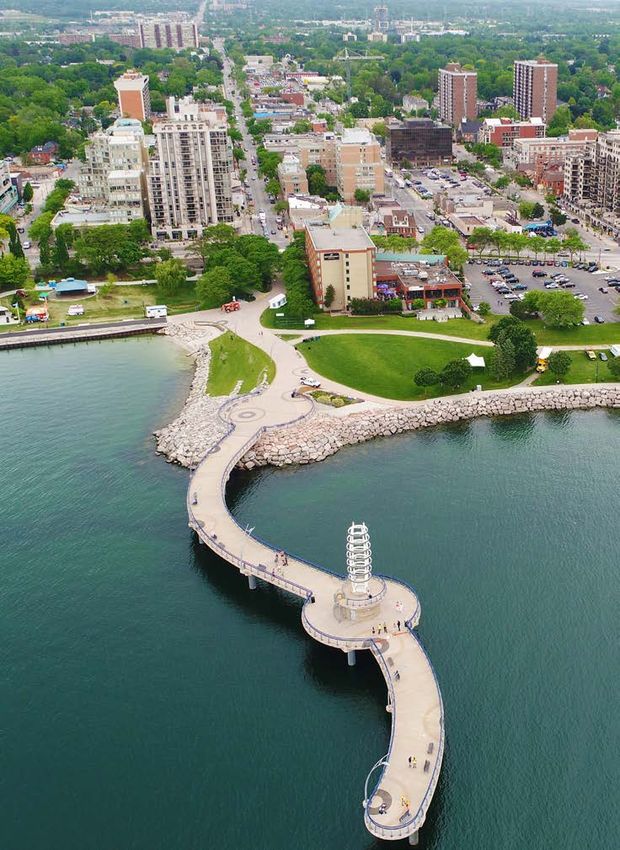
City of Burlington
Located on the northwest shore of Lake Ontario, Burlington, with its population of 183,300, is ranked by Macleans Magazine as
Canada’s best community and best place to raise a family. It’s a place where our people, our nature and our businesses thrive.
As a community of the Greater Toronto/Hamilton area, Burlington is close to major transportation and the U.S. border. To the
south, Burlington is fortunate to have a beautiful and publicly accessible waterfront along the shores of Lake Ontario and in
the north, through the cliffs of the Niagara Escarpment, the City has a UNESCO world biosphere reserve.
Burlington boasts great employment opportunities, low crime rates and
a community feel. More than half of the city is protected rural space.
Burlington is proud of its green city heritage with more than 581
hectares (1,436 acres) of parkland and some of the best hiking in
the world on the Bruce Trail and the Niagara Escarpment.
The city offers world-class urban amenities, including shopping
and dining and is home to some of Ontario’s top festivals and
events. Attractions include the world-renowned Royal Botanical
Gardens and the Burlington Performing Arts Centre.

Overview                                                                                                                 3
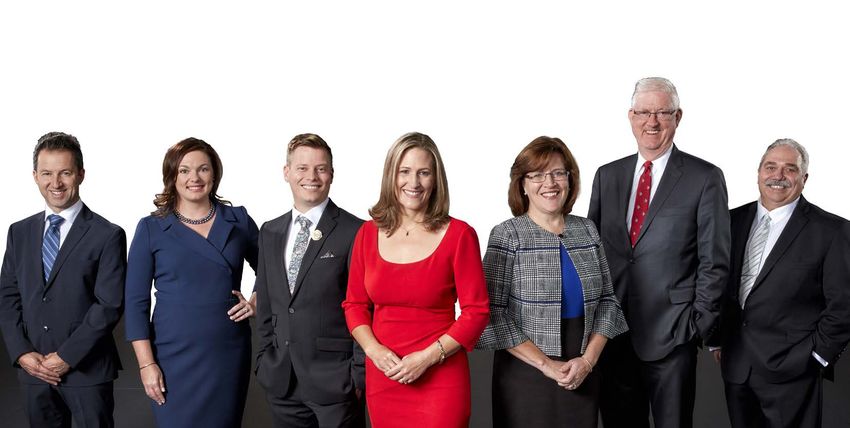
Burlington City Council
BELL SCHOOL LINE
DERRY RD
TWISS RD
McNIVEN RD
NO. 8 SIDE RD
The City of Burlington is a place where people, nature and BRITANNIA
RD
MILBUROUGH LINE
BLIND LINE
business thrive. Burlington Council and the Burlington Leadership
Team work towards common objectives in partnership with our NO. 4 SIDE RD
community to address our changing city and contribute to the NO. 2 SIDE RD
CEDAR SPRINGS RD
quality of life for residents. NO. 1 SIDE RD
TREMAINE RD
Together we commit. DUNDAS ST
TR
7E
40
RD
UPPER MIDDLE
WATERDOWN RD
MAINWAY
VICE RD
HWY 403 NORTH SER
QEW
PLAINS
RD E HARVESTER RD
WALKERS LINE
PLAINS RD W PLAINS RD E
GUELPH LINE
FAIRVIEW ST
APPLEBY LINE
KING RD
BRANT ST
QEW
AVE
BURLOAK DR
MAPLE
NOR
TH S
HOR NEW ST
E BLV
D
LAKESHORE RD
DR
RT
TPO
EAS
Ward 1 Ward 2 Ward 3 Mayor Ward 4 Ward 5 Ward 6
Councillor Councillor Councillor Marianne Councillor Councillor Councillor
Kelvin Galbraith Lisa Kearns Rory Nisan Meed Ward Shawna Stolte Paul Sharman Angelo Bentivegna
Overview 4
2018-2022 Burlington’s Plan: From Vision to Focus
Burlington’s 2015-2040 Strategic Plan is a long-term vision for the future. It is a framework for critical decision-making and
guide to how we manage our resources today to position Burlington for the future. It is the result of a year of engagement that
included residents, businesses, community groups, city employees and members of Burlington City Council.
The 2018-2022 Burlington’s Plan: From Vision to Focus document is our corporate workplan that prioritizes key strategic
directions from Burlington’s long-term 25-year Strategic Plan and details key goals and strategic actions required to move
these priorities forward during this term of Council.
Vision to Focus includes 5 Focus Areas:

         Focus Area 1 - Increasing Economic Prosperity and Community Responsive City Growth Management

         Focus Area 2 - Improving Integrated City Mobility

         Focus Area 3 - Supporting Sustainable Infrastructure and a Resilient Environment

         Focus Area 4 - Building More Citizen Engagement, Community Health and Culture

         Focus Area 5 - Delivering Customer Centric Services with a Focus on Efficiency and Technology Transformation

Overview                                                                                                                 5
About the Plan
Our Focus 2018-2022                                                       Our Vision 2040+
•   Increasing economic prosperity and community responsive city          Where People, Nature and Business Thrive
    growth management.
                                                                          • A City that Grows
•   Improving integrated city mobility.
•   Supporting sustainable infrastructure and resilient environment.
                                                                          • A City that Moves

•   Building more citizen engagement, community health and culture.       • A Healthy and Greener City
•   Delivering customer centric services with a focus on efficiency and   • An Engaged City
    technology transformation.

      Building the Vision

                Making Progress:
               Plans and Initiatives

Overview                                                                                                     6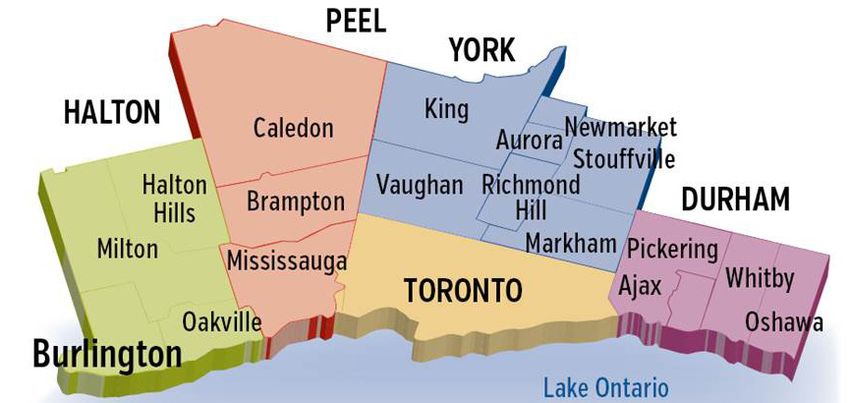
Vision to Focus and the Budget Process
The City’s strategic plan clearly sets forth initiatives to plan                         Establishing priorities for existing and new city investment
for the future. It is staff’s responsibility to resource, administer                     was a key step in developing the budget this year. Linking
and deliver strategies and initiatives laid out in the plan.                             Vision to Focus to the budget provides accountability
                                                                                         between what is achieved and the value to the taxpayer.
It is important to ensure that resources and funding are aligned                         This process provides a clear link between the long-term
with the four-year V2F Plan and ultimately to the long-term                              strategy, the four-year vision, the cost of implementing the
Strategic Plan. During the 2021 budget development, the V2F                              initiatives and the responsibility of staff to deliver on the
needs were balanced against the current pressures facing                                 City’s priorities.
the operating budget as a result of the COVID-19 pandemic.
These decisions about resources and pacing of implementation                             The budget is one mechanism that brings the V2F Plan to life
of the V2F Plan initiatives were evaluated by the Strategy and                           through specific initiatives.
Risk Team.

                                               Stakeholders      Visitors                            Customers    Community
                                                                                    Vision                         Members
                                                                                  (Community)

                                                                                   Council
                                                 Citizens                                                        Community
                                                                                                                 Measurement Results
                                                                                  Strategy

                                                                              City Leadership
                                                             s
                                                          tie

                                                                                                           Re
                                                       ori

                                                                             Corporate Planning

                                                                                                             su
                                                                                                                          Performance

                                                                                                               lts
                                                    Pri

                                                                                                                          Measurement
                                                                                                                          Results

                                                                            Service Business Plans

                                                                             Operational Process

                                                                              Staff Performance

Overview                                                                                                                                          7
How the Budget is Developed
Framework Report Public Engagement
The 2021 budget process began with a Budget Framework The City is continuously looking for ways to improve and increase
Report. This was presented to Council for consideration and transparency for the public. Staff will continue to use the
approval in Sept. 2020, after which staff began the preparation city’s website and engagement platform as a communication
of the budget. medium through videos, webcast and online surveys.
Internal Staff Review The “Budget Basics” video continues to be available on the
The next step was a comprehensive review of the budget website which explains how the city develops its budgets.
by internal staff teams. The operating budget underwent This year a new budget video has been developed to outline
a line by line review by the Chief Financial Officer and the pressures the City is facing with respect to the COVID-19
Service Leads. This review checked the proposed budgets pandemic and to encourage the public to provide feedback
for reasonableness and adjusted where appropriate to find on the budget.
budget savings and reduce costs. This review ensured the This year, the City is piloting an educational budget simulation
proposed budget was submitted and aligned with the city’s tool, Balancing Act, to educate the public on the City’s budget
financial policies. This review resulted in approximately $2.34 and highlight the challenge of maintaining and improving
million in budget reductions. services to the public, with limited sources of revenue. Using
Strategy and Risk Team (SRT) Review this tool, the public can simulate where they would recommend
City Service budgets be amended to either increase or reduce
Following the internal staff review, the Budget and the
overall spending and revenues.
Operating Risk Mitigation Measures were reviewed by the SRT
from a corporate perspective, to ensure compliance with Vision In addition, a revised version of Burlington Open Budget, on the
to Focus strategic goals, objectives and financing capabilities. city’s website, will be available to the public to allow residents
to view the city’s 2021 budget data in an intuitive and
illustrative form.
A virtual budget townhall using the TEAMS live format was
held on Jan. 20, 2021.
A comprehensive report outlining the 2021 Budget
Engagement process (Report F-05-21) will be presented
to Committee on Feb. 3, 2021.
Overview 8How the Budget is Approved
Following the internal staff review process the proposed
budget is presented to the Corporate Services, Strategy, Risk
and Accountability Committee for their review. To assist in the
decision-making process, Council is provided with a budget
overview report, presentation, and proposed budget book.
Members of Council complete a Budget Action Request form to
propose budget amendments. Using this form, Council members
have the option of amending or removing recommended
budget items and introducing new items for consideration.
Committee budget meetings to review and make amendments
to the budget are scheduled for Feb. 23 and 25, 2021. Preliminary
budget approval is granted at this committee level, followed
by formal approval of the budget at the subsequent Council
meeting of Mar. 3, 2021.
Overview 9Budget Process
Budget Budget Internal Strategy and Council
Public CSSRA
Framework Development Staff Risk Team Review and
Engagement Committee
Report and Review Review Review Approval
Key Budget Dates
Below is a brief timeline of the 2021 operating budget process:
Date Meeting Item
Jan. 20, 2021 TEAMS Live Virtual Budget Town Hall
Jan. 21, 2021 CSSRA Committee Operating Budget Overview Report
Feb. 23 and 25, 2021 CSSRA Committee Operating Budget Review and Approval
Mar. 3, 2021 Council Operating Budget Approval
Note: CSSRA is Corporate Services, Strategy, Risk and Accountability
Overview 10Service Structure of the City
The City of Burlington has multiple lines of business. For business planning purposes, they are organized into 45 distinct services.
Of these, 27 services are delivered directly to the public, 11 are internally focused support services and 7 are managed externally
by distinct governance structures but receive a portion of their funding from the city. For budget presentation purposes the 45
services have been grouped into 7 service categories.
A City that Grows A City that Moves A Healthy and An Engaging City A Safe City Good Governance Enabling Services
• Building Code • Parking Greener City • Art Gallery of • Animal Services • Corporate Legal • Asset Management
Permits and Management • Cemetery Burlington • By-Law • Corporate • Corporate Customer
Inspection • Road and • Arts and Culture Enforcement and Strategy Experiences -
• Environment and
• Burlington Sidewalk Energy • Burlington Licensing • Internal Audit Service Burlington
Economic Maintenance Museums • Emergency • Facilities and
• Organized Sport • Legislative
Development • Roads and Management Buildings - Design
Support • Burlington Services
• Community Design Structures - Performing Arts • Fire 911 and Construction
• Parks and Open • Mayor and Council
and Development Design and Centre Communication • Financial
Space - Design
Review Construction Management
and Development • Burlington Public • Fire Emergency
• Traffic Operations Library Response • Fleet Management
• Parks and
Management
Open Space - • Corporate • Fire Prevention, • Geographic
• Transportation Maintenance Communications Education, Fire Information and
Planning and Engagement Code Inspection Mapping
• Recreation
• Transit • Tourism and Enforcement • Human Resources
• Surface Water
• Specialized Transit Drainage Burlington • Halton Court • Information
Services Technology
• Tree Management
• Sign Production
Service
Overview 11Budget at a Glance
The City of Burlington proposed 2021 Operating Budget represents a public investment of $270.1 million to provide daily services
to its residents, while advancing Council’s priorities and long-term objectives.
Investment in City Services
The chart below illustrates where the City invests the revenue it receives from property taxes for these service categories.
A City that Grows A City that Moves A Healthy and An Engaging City A Safe City Good Governance Enabling Services
Greener City
Total
Operating $10.5 $53.0 $39.8 $18.5 $36.7 $8.0 $24.1
Investment
Portion
Funded by $3.1 $37.8 $31.1 $18.1 $33.1 $7.1 $17.5
Property
Taxes
*values in millions
Overview 12How is the Operating Budget Funded?
Senior Government Grants External Recoveries
Property
3% User Fees External Recoveries are the revenues associated with doing
Taxes 9.1% work for other agencies such as other levels of government
and the school boards. The largest of the recoveries are work
67.2% External Recoveries
the City performs for Halton Region followed by services
2.3% performed for other municipalities.
Internal Revenues
User Fees
2021 Total 2.4% In accordance with the Municipal Act, 2001, the City of Burlington
Operating
Other Corporate has by-laws which impose fees and charges for services or
Investment
Revenues activities provided. Examples include: transit fares, permit fees,
$270.1 million registration fees, and rental revenue for the use of City facilities.
16%
Internal Revenues/Charges
Internal Revenues are related to Internal Charges in that
they are the revenues for work done for other services that
are internal to the organization. The largest driver of these
revenues is the revenue that Fleet Services receives for the
Property Taxes work it performs for the other services within the City of
The single largest portion of City funding comes from Burlington. Other large drivers are the revenue that the City
property taxes. receives from Halton Court Services for a share of the revenue
generated as well as the work of some City Services such
Senior Government Grants as Information Technology, Finance and Human Resources
These grants are provided by provincial and federal perform for the functioning of the Halton Courts.
governments and are tied directly to legislated cost sharing
Other Corporate Revenues
arrangements. It should be noted that these revenues “flow
through” the operating budget and are directly transferred These Revenues include returns from the investment portfolio,
into reserve funds until such time as they may be used for managed by the Finance department, as well as the dividend
their designated purpose. As such these grants contribute and interest the City receives from Burlington Hydro. Other
to higher gross revenues and gross expenditures but have large items include Payments in Lieu of Taxation, Penalty and
no impact on the City’s net operating budget. Interest on Taxes and Supplementary Taxes.
Overview 13Budget Format –
Two Budgets in One
As a result of the financial pressures of the ongoing COVID-19
Pandemic, the 2021 Operating budget is effectively two
budgets in one. The steps to develop the 2021 budget were
as follows:
• Base Budget - The budget was first built under traditional
business as usual assumptions with city services adjusting
their ongoing base budgets to reflect service efficiencies
and standard inflationary pressures offset with “normal”
changes to revenues based on fee changes and volumes.
• COVID Budget - All city services were asked to separately
identify one-time budget adjustments required as a result of
COVID-19. These adjustments include one-time reductions in
budgeted revenues and changes in expenses to recognize
temporary service redesign plans required to protect the
health and wellbeing of residents, businesses and staff.
Finally, services were asked to make further one-time budget
adjustments to expenditures reflecting continued travel
restrictions and additional savings resulting from remote
working such as decreases in professional development given
virtual training opportunities, meeting expenses and mileage.
The net result of these one-time COVID-19 impacts have been
shown separately from the ongoing base budget throughout
the budget documents.
The ongoing 2021 budget results in a tax increase while the
one-time 2021 COVID budget has been offset by temporary
cost savings and a one-time funding plan.
Overview 14COVID-19 Pandemic
The COVID-19 pandemic is an unprecedented global event, The COVID-19 pandemic represents one of the most significant
unlike anything that has been experienced in our lifetimes. financial challenges municipalities have ever faced. The financial
In addition to the immediate health concerns that it represents impacts are the result of restrictions designed to reduce the
for individuals, it is expected to continue to have wide-reaching transmission of the virus within our community.
economic impacts on many individuals and organizations.
2021 Estimated COVID-19 Impacts
Budgetary pressures associated with the COVID-19 pandemic Transit
Tenant Revenue/
are expected to continue into 2021. The largest of these impacts $2,635 Food Services
relate to decreased revenues particularly in recreation
programs and facility rentals and transit fares. Staff have spent $605
considerable time reviewing the financial impacts on Services
Parking By-law
experienced during 2020 and recognize similar conditions
will continue well into 2021 with gradual improvement as the $388
year progresses given the roll out of a vaccination program. 2021 Parking District
Unlike the Federal and Provincial Governments, the City One-time $338
cannot budget for a deficit and therefore must budget/fund COVID-19
revenue shortfalls. Licensing
Impacts
($000s) $225
The projected total 2021 revenue impact of COVID-19 is $12.3
million due to modified operations of various programs and Other Revenue Impacts
services and reduced capacity limits in place to protect the
$76
health and safety of residents.
Recoveries and Grants
$27
Recreation, Community Janitorial Services/
and Culture Contracted Services
$7,997 $22
Overview 152021 Estimated COVID-19 Impacts
Decrease in Revenues/ 2021 COVID-19 Assumptions/Comments
Increase in Expenditures Impact
Recreation, Community and Culture $ 7,997,034 Revenue impacts across Ice Rentals (85% reduction in Q1, decreasing to 50% reduction in Q4);
Admissions (75% reduction in Q1, decreasing to 50% reduction in Q4); Memberships (100% reduction
in Q1, decreasing to 75% reduction in Q4); Registered Programs (90% reduction in Q1, decreasing to
50% reduction in Q4); Facility Rentals (85% reduction in Q1, decreasing to 50% reduction in Q4) and
School Board Facility Rental Revenues (100% reduction in Q1, decreasing to 50% reduction in Q4).
Also a 50% decline in sponsorship revenue and $100K decline in concession revenues expected.
Transit $ 2,635,425 Ridership levels are assumed to be 50% of 2020 budget until Q4, where a slight rebound is expected.
Advertising and Charter revenues are also impacted by low ridership.
Tenant Revenue $ 605,475 Tenant lease revenue anticipated to be lower due to COVID restrictions impacting food services providers.
Parking By-law $ 387,500 Parking fine revenue anticipated to be 25% lower due to a reduction of enforcement during COVID
restrictions.
Parking District $ 337,916 Approximately 30% reduction in downtown parking revenues due to reduced travel and remote work
arrangements.
Licensing $ 225,000 General and Lottery licensing revenues are expected to be 35% below normal conditions as COVID
restrictions continue.
Recoveries & Grants $ 27,040 Minor reduction in recoveries for work performed on behalf of other agencies.
Janitorial Services/Contracted Services $ 22,109 Increased janitorial costs due to COVID precautions.
Other Revenue Impacts $ 76,379 Various other minor reductions across a number of areas based on 2020 experience.
Total Impact $ 12,313,878
Overview 16COVID-19 Mitigation Measures Safe Restart Agreement Funding
Part-time Travel Related Costs– $415 On Aug. 12, 2020, the Province of Ontario announced as part
RF Draws–Recreation
One-time Wages– of Phase 1 of the federal-provincial Safe Restart Agreement
Net Zero Operations– RF Provisions–Recreation
COVID $800 that the City of Burlington will receive $4,470,700 to support
$594 Net Zero Operations– $378
Funding– municipal operating pressures and a further $1,571,213 for
$6,618 School Rental Expense– Burlington Transit – totaling just over $6 million.
Recreation– $340
An application was made for Phase 2 Safe Restart funding
RF Provisions–
and on Dec. 17, 2020 the City was advised that we would
Parking District– $338
2021 receive a further $7,302,000 to support municipal operating
COVID-19 Fuel– $268 pressures and $2,208,957 for Burlington Transit – totaling
Mitigation Printing Materials just over $9.5 million.
Measures and Supplies– $126
($000s)
In total, the City received $15.5 million from the Safe Restart
Presto Commissions– $72 Program.
Program Related Costs– $70
This funding will help municipalities like Burlington protect
Leaf Collection Program the health and well-being of our residents, while continuing
Modification– $41 to deliver critical public services to our community and assist
with economic recovery. It will also provide immediate relief
In order to help offset the impacts related to the pandemic, from transit pressures, such as lower ridership, reduced
Council approved a recommendation to temporarily redirect revenues as well as for new costs due to COVID-19, such as
the planned Infrastructure Renewal Levy to the operating enhanced cleaning and personal protective equipment for staff.
budget to fund one-time COVID impacts in 2021. This will
A portion of the total funding will be used to mitigate the
provide $2.18 million of one-time funding to offset the one-time
City’s 2020 losses while $6,617,577 will be used to offset
COVID impacts in 2021.
anticipated 2021 COVID impacts.
In addition, Services have identified one-time mitigation
savings in 2021 given continued travel restrictions and a remote
working environment. These savings are considered to be
temporary in nature and have a minimal impact on service
delivery. Overall, a total of $4.4 million in one-time mitigation
measures have been incorporated into the 2021 Budget.
Overview 17COVID-19 Mitigation Measures
Mitigation Measures 2021 COVID-19 Assumptions/Comments
Impact
Savings in Part-time Wages $ (799,537) Part-time wage savings are realized mainly as a result of reduced recreational offerings (40% reduction
in Q1, 25% in Q2 and 10% reduction in Q3, returning to normalized offerings in Q4). Savings are slightly
offset by increased costs for Greeters/Screeners and Facility personnel.
Reduced Travel Related Expenses $ (415,100) Savings in professional development, meeting expenses and other travel related costs given continued
travel restrictions and remote working environment.
Reduced School Rental Expense for Recreation $ (340,217) Reduced rental expense as school gymnasiums are unavailable for use during COVID restrictions.
Fuel Savings $ (267,984) 10% fuel savings in Transit as a result of modified Transit schedule.
Savings in Printing and Materials and Supplies $ (125,587) Reduction in recreation program materials and printing costs.
Reduced Presto Commissions $ (71,819) Commissions paid to Metrolinx decline as a result of lower anticipated ridership.
Reduced Program Related Costs $ (70,440) Savings are mainly due to reduced food inventory expenses as a result of closed concessions, including
The Bistro at the Senior Centre.
Savings in Leaf Collection Program $ (40,500) Savings in the Leaf Collection Program due to a continued modified schedule in 2021.
Other Expense Reductions $ (74,880) Various other miscellaneous savings across a number of services including savings in the Leaf
Collection Program due to a modified 2021 collection schedule.
Total Impact $ (2,206,065)
Additional One-Time Mitigation Measures
Safe Restart Funding $ (6,617,577) Carry over of Safe Restart funding to support one-time 2021 COVID impacts.
One-Time Infrastructure Levy Reallocation $ (2,180,000) Re-allocation of infrastructure levy to fund one-time 2021 COVID impacts.
Reduced Parking District Reserve Fund Provisions $ (337,916) Reduced provision to Parking District Reserve Fund as a result of decreased revenues.
Reduced Net Zero Reserve Fund Provisions $ (378,453) A decline in revenues in net zero operations (Tyandaga and Food Services) will result in reduced reserve
fund provisions/draws from reserve funds (see next item).
Increased Net Zero Reserve Fund Draws $ (593,866) Draws from net zero reserve funds required to offset revenue shortfalls.
Total Impact $ (10,107,813)
Total Mitigation Measures $ (12,313,878)
Net Financial Impact $ 0
Overview 18Base Budget Pressures, Financial Sustainability and Budget Risks
The City continues to closely monitor revenue sources and This has been identified as the number one enterprise risk for
financial strategies to maintain financial sustainability as the City. While additional staff positions were added to the 2020
outlined in the objectives of the city’s long-term financial budget, financial constraints prevented many other pent-up
plan. There are a number of issues that the City will need to needs from being incorporated. This results in deficiencies in
be mindful of in 2021 and future years. human capital, difficulties servicing a growing population and
leads to risk in operations and compliance with legislation.
These pressures include:
Human Resource Management, Labour Market and Designing and Evolving our Organization (DEOO)
Workforce Evolving the Organization - Phase 1 set the stage for engaging
Municipalities are service organizations that rely heavily on staff in further refining the organizational design through
human resources to deliver the range and quality of services Designing and Evolving our Organization (DEOO). The City
that residents have come to expect. Human resource costs of Burlington is at a tipping point particularly related to the
(including benefits, training, etc.) as a percentage of the City’s management of risks and effectively implementing and
gross budget has decreased from 50.5% in 2004 to 47.3% executing strategy. The staff and service delivery has been
in 2021. cumulatively affected and, to a certain extent negatively
affected, by a history of changes.
A significant risk to the corporation is the attraction and retention
of talent within the Greater Toronto/Golden Horseshoe area. Designing and Evolving our Organization – Phase 2 allows the
The following realities create a labour market and workforce risk: City of Burlington to continue to evolve to meet the changing
environment, address the strengths and weaknesses of the
• Number of staff eligible to retire; organization, and prepare for the future.
• Number of municipal job opportunities within one-hour
commute of Burlington and the new environment that Management is working across and throughout the organization
supports remote work making it easier for people to live to stabilize and enhance our competency, capability and
and work in different locations; capacity through resource needs – from people, process, and
• Increasing challenge to retain and attract employees across technology – to be a customer-centered organization and to
a range of professional and technical job classes; effectively deliver on our commitments.
• Ability to hire qualified candidates; and
• A compensation system which has become less competitive
within the market.
Overview 19Base Budget Pressures, Financial Sustainability and Budget Risks
Annually DEOO will include the following process: Building a 21st Century Workforce
• Assessing current state of resources based on risks and There are several technology related projects currently
City Service needs underway to modernize the delivery of city services and
• Updating the plan including resource rationalization and provide ongoing operational efficiencies and improved data
process improvement analytics. Some of these projects include:
• Presenting the plan for review and approval in principle • The city’s new Enterprise Resource Planning (ERP) system;
• Council approval of updated DEOO Plan and budget • A new Enterprise Asset Management System (EAMS);
By following these steps, DEOO becomes part of our natural • The continued expansion of the new Customer Relationship
Management (CRM) system; and
process of aligning our resources to the achievement of
• Operationalizing the city’s new Business Intelligence (BI)
strategic objectives and effective and efficient service delivery
platform.
while managing risk. Through this process, resource needs
will be identified and prioritized, giving consideration to Each of these major initiatives require financial and staffing
rationalization where it makes sense and process improvements. resources to ensure a successful implementation and as
These decisions will be reflected in an annually updated DEOO well as ongoing operational support. As part of the 2021
plan and budget. Operating Budget, permanent resources are being requested
to support the strategy, processes and technology for the
A total of 8.5 new positions were approved during 2020 as
Business Intelligence (BI) platform and data analytics.
part of DEOO - Phase 1. The cost of these positions have been
reflected in the City’s base budgets but are outlined separately Controllable Revenues
in the Human Resources Summary included in the Additional In 2020, the City realized an $18 million shortfall in revenues
Analysis section of this book. across city operations as a result of the COVID-19 pandemic.
While it is difficult to predict the long-term impact, it is expected
that there will once again be a significant reduction in revenues
as these are highly dependent on the phased recovery of
services and the future participation in city programs and
services by residents and businesses. For 2021, anticipated
revenue reductions have been reflected as one-time impacts.
Should a portion of these revenue reductions prove to be longer
in nature, they will need to be incorporated as permanent
adjustments to future budgets.
Overview 20Base Budget Pressures, Financial Sustainability and Budget Risks
Assessment Growth
The impacts from growth accounts for a portion of the city’s Year Net Assessment Growth
increased costs year over year. These cost increases have
been offset by assessment growth which allows a municipality 2017 0.15%
to finance increased costs without increasing taxes. 2018 0.41%
The Framework report assumed assessment growth at 0.6% 2019 0.64%
however, the actual weighted assessment growth for the 2020 1.07%
2021 budget is 0.34%. This provides approximately $590,000
of additional revenue to offset inflation and growth-related 2021 Proposed 0.34%
costs in the base budget. The 0.34% represents net assessment 2017–2021 Average 0.52%
growth, as changes in assessment resulting from Assessment
Review Board decisions and Requests for Reconsideration
Local Boards
are included in the overall change.
Local Boards include the Burlington Public Library, Burlington
To mitigate the impact of the reduced assessment growth a Museums, Art Gallery of Burlington, The Burlington Performing
one-time revenue draw from the Tax Rate Stabilization Reserve Arts Centre (BPAC), Tourism Burlington and Burlington
Fund of $450,000 for assessment growth stabilization equivalent Economic Development. For 2021, a base budget increase of
to 0.26% has been included in the 2021 Proposed Budget. 1.75% was provided for local boards, equating to $274,096.
Over the past five years, net assessment growth has ranged
from a high of 1.07% to a low of 0.15% for an average of 0.52%.
Overview 21Base Budget Pressures, Financial Sustainability and Budget Risks
Planning for the Future – Reserve Funds As of September 2020, the City’s uncommitted consolidated
Reserves and reserve funds, when used in conjunction with year-end balance in capital renewal reserve funds is
debt policies, are a critical component of a municipality’s approximately $31.3 million, below the intended target. The
long-term financial plan and financial health. repurposing of the Infrastructure Renewal Levy temporarily
decreases funding to the capital program however this is a
Reserves and reserve funds provide tax rate and cash flow prudent measure given the uncertainty COVID places on the
stability when the City is faced with unforeseen or uncontrollable 2021 budget. While this temporary repurposing is recommended
events such as the COVID-19 Pandemic. It ensures cash flows to address the short-term COVID operating impacts for 2021
are sustained and allows for internal financing for temporary it is not sustainable as a means of funding longer term
or one-time expenditures. Furthermore, these funds provide operating impacts.
the City flexibility to manage debt levels and planning for
future liabilities. • Corporate Reserves and Reserve Funds – These reserve
and reserve funds are used to manage current costs that
• Stabilization Reserve Funds – These reserve and reserve will be transferred to future generations, as the City incurs
funds are used to mitigate the risk of raising taxes or reducing liabilities that do not have to be paid immediately. Reserve
service levels due to unforeseen or temporary events. In order and reserve funds in this category include Employee Accident
to continue to build the balance and to maintain a prudent (self-insured WSIB), Benefits and Insurance costs.
level, the City is targeting an uncommitted balance in
stabilization reserve funds of between 10-15% of net revenues. Contributions to Corporate Reserve/Reserve Funds should
take into consideration the liability associated with these
As of September 2020, the consolidated balance of these funds. A sufficient budget allocation is required to fund WSIB
reserve funds is below target at 8.8%. Funding from the Safe costs and post-employment benefits so that the Employee
Restart Agreement will be used to offset the anticipated 2020 Accident Reserve Fund and Benefits Reserve Fund can
budget shortfall with the balance remaining carried forward eventually be replenished to cover the future liabilities.
to support anticipated one-time COVID impacts in 2021.
Major Base Budget Drivers
• Capital Reserve Funds - Annual contributions to capital A summary of the major drivers contributing to the Base Budget
funds that are consistent and predictable is vital for the increase can be found in the Additional Analysis section of
future rehabilitation and replacement of assets. The City is this document.
targeting a balance equal to 2% of the total asset replacement
value. Based on the City’s total asset replacement value of
$3 billion, this equates to an estimated $60 million.
Overview 22City of Burlington Reserves and Reserve Funds As at Sept. 30, 2020 Capital Related Reserve and Reserve Funds Uncommitted Balance Development Related Reserve and Reserve Funds $ 22,017,533 Vehicle and Equipment Reserve Funds $ 4,137,857 Transit Related Reserve Funds $ 2,969,783 Other Capital Reserve Funds $ 32,067,679 Total Capital Related Reserve and Reserve Funds $ 61,192,852 Operating Related Reserve and Reserve Funds Uncommitted Balance Stabilization Reserve and Reserve Funds $ 24,441,425 Corporate Reserve Funds $ 8,572,239 Corporate Reserves $ 254,372 Total Operating Related Reserve and Reserve Funds $ 33,268,036 Local Boards and Programs Specific Reserve and Reserve Funds Uncommitted Balance Program Specific Reserve Funds $ 15,550,285 Local Boards Reserve Funds $ 5,622,486 Program Specific Reserves $ 19,216 Total Local Boards and Program Specific Reserve and Reserve Funds $ 21,191,987 Total Reserve Funds $ 105,730,672 Total Reserves $ 9,922,203 Total Reserve Funds and Reserves $ 115,652,875 Overview 23
City of Burlington’s Debt Policy
The Province of Ontario legislates a municipal debt limit of               not issued, total City principal debt outstanding at year end
no greater than 25% of revenues. Consistent with the City                  2020 is approximately $99.8 million.
of Burlington’s Long-Term Financial Plan, the City’s debt
                                                                           An effective debt policy is an important part of having a
policy limits the total debt charges and liabilities to 12.5% of
                                                                           responsible financial plan. By controlling debt levels, it allows
revenues (half of the Provincial limit).
                                                                           the City to make the necessary spending choices. It is also
The City’s total debt charges as a percentage of own source                designed to keep our city financially stable and sustainable,
revenue is 10.5%, which is below the Council approved policy               while allowing the flexibility to borrow money in the future as
of 12.5%, and below the provincial limit of 25%.                           unexpected capital needs arise.
The City has an estimated $88.8 million in total principal                 Staying at or below the targeted debt limit gives Burlington
debt outstanding. Taking into consideration principal debt                 the flexibility to manage the financing of much needed
repayments of $13.6 million, a debt issuance of $6.8 million,              capital expenses in the future.
as well as $17.8 million in debt which has been approved and

         Debt Charges as a Percent of Previous Year’s Net Revenues                     Council target
                                                                                       Debt charges as % of net revenue
         14%
                                                                                                                                12.5%
         12%

         10%                    9.4%                                9.1%
                    8.9%                     8.8%            8.8%              8.4%       8.0%
         8%                                                                                           7.5%
                                                                                                                 7.0%       6.7%
         6%

         4%

         2%

         0%
                   2015        2016         2017         2018       2019      2020        2021       2022       2023       2024
         *Note: Chart excludes other long-term liabilities

Overview                                                                                                                            24
2021 Proposed Risk Mitigation Measures
Risk mitigation measures are proposed variations in the • Additional resources to support the Development Application
budgeted expenditures or revenues for which separate budget and Review Process as identified in Report PL-45-20.
disclosure is warranted. • An additional resource to meet workload demands and
ensure legislated timelines are met for the review and
In 2021, these risk mitigation measures have been divided issuance of building permits.
into four categories as follows: • An additional legal resource to support the ongoing work
Sustaining City Services of Community Planning including ongoing implementation
of the updated Official Plan.
• Additional funding for on-going recreation facility maintenance
as well the conversion of part-time staffing to full-time. Enhancing Services
• Permanent resources to support the City’s data analytics,
• Funding to make the Free Transit for Seniors pilot a
strategy, processes and technology (BI program). permanent program.
• Additional part-time resource to support the audio and video
• One-time funding to continue the plumbing grant program.
technology within Council Chambers.
• Additional resources to support ongoing and growing Modifications to Services to Address COVID
workloads in Forestry and Road Maintenance. • Implementation of the parking measures at Beachway and
• Additional resource to support and enhance community Lowville Park as identified in Report RS-09-20.
engagement. • Additional temporary resources to aid with Municipal Bylaw
Enforcement funded from Halton Region in 2021 on a
Managing Community Growth
one-time basis.
• One-time funding to carry out the comprehensive review
of the Zoning Bylaw and complete the Major Transit Station The details of these Risk Mitigation Measures can be found
Area planning project. in the Risk Mitigation Measures section of this book.
Other Additional Items (not included in the proposed budget)
In addition to the above risk mitigation measures recommended The details of these Other Additional Items can be found in
in the 2021 budget, a number of additional items have been the Other Additional Items section of this book.
provided in the Proposed Budget Book for Council’s information.
These items could not be accommodated within the 4.99%
tax increase.
Overview 25Property Tax Impact
The Budget has been developed to provide services in the most Included in the 2021 Proposed Budget are four categories of
cost-effective manner. It considers the cost pressures to deliver risk mitigation measures as follows:
services that meet the service demands of the community, • Sustaining city services ($1.1 million) result in an additional
balanced against reasonable tax increases and user fees. tax increase of 0.63%
• Managing community growth ($155K) result in an additional
The total net tax levy is $183,768,566. This levy is determined tax increase of 0.09%.
by taking the difference between the total gross operating • Enhancing services (117K) result in an additional tax
expenditures of $273,323,110 and budgeted non-tax revenues increase of 0.07%.
of $89,554,544 The net tax levy represents 67.2% of total City • Modifications to services to address COVID
revenues. ($168K savings) results in a tax decrease of 0.10%
• This budget delivers a base budget to maintain services at • This brings the total City tax increase to 4.99%
3.65% • Combined with the Halton Region increase and the Boards
• Assessment growth (new residential units and businesses) of of Education, the overall increase is 2.88% or $21.89 per
0.34% as well as further draw from the tax rate stabilization $100,000 of Current Value Assessment
reserve fund of $450,000 (0.26%) reduces the based budget
tax impact to 3.05%
• The dedicated infrastructure levy of $2.18 million (temporarily
redirected to address short-term COVID impacts) results in
an additional tax increase of 1.25%
• This brings the total proposed city tax increase to 4.3% before
recommended risk mitigation measures.
Overview 26Property Tax Impact
The following table provides a breakdown of the 2021 proposed tax increase:
One-time
Base Budget Tax Tax
COVID
Change Impact Impact
Impacts
City Services $ 5,999,080 3.43% $ 8,797,577
Corporate Revenues and Expenditures $ 390,080 0.22%
Base Impact $ 6,390,060 3.65% $ 8,797,577 5.03%
Assessment Growth (0.34%)
One-time funding $ (450,000) (0.26%)
Re: Projected Assessment Growth
Revised Impact $ 5,940,060 3.05%
Infrastructure Levy redirected to address one-time COVID Impacts $ 2,180,000 1.25% $ (2,180,000) (1.25%)
One-time COVID funding $ (6,617,577) (3.78%)
Cumulative Impact $ 8,120,060 4.30% $ (8,797,577) (5.03%)
Sustaining City Services $ 1,108,502 0.63%
Managing Community Growth $ 155,470 0.09%
Enhancing Services $ 116,700 0.07%
Modifications to Services to address COVID $ (168,000) (0.10%)
Total Impact $ 9,332,732 4.99% $ 0 0.00%
Estimated Overall Tax Impact* (City, Region, Education) 2.88%
* Halton Region 1.84% and Board of Education 0.00%
Overview 27Property Tax Impact
Boards of
Property Tax Split City of Education
Burlington
The City of Burlington collects taxes for the City, Halton 19.5%
Region and Halton School Boards. For each $1.00 in residential 45.6%
taxes collected, approximately 45.6% stays with the City,
34.9% goes to Halton Region and 19.5% goes to the Halton
School Boards.
City Tax Rate Calculation
Taxpayers across the whole city are responsible for paying Property
their proportionate share of those services charged to the Tax Split
entire city. The net cost of these services is approximately
$157.6 million. In addition to the “whole city” services, urban
area taxpayers are also responsible for paying for certain
unique services that have traditionally been charged to urban
residents only. These services include such things as transit,
storm sewers, sidewalks, etc. resulting in an additional net Halton
cost of approximately $23 million. The total net costs are Region
then divided by the total assessment base to determine the
tax rates for each property class.
34.9%
2020 Share 2021 Share 2020 Tax $ Impact % Impact
2020 Taxes 2021 Taxes
of Tax Bill of Tax Bill Increase on Tax Bill on Tax Bill
Burlington 44.7% 45.6% $ 339.95 4.99% $ 356.92 $ 16.97 2.23%
Halton 35.2% 34.9% $ 267.62 1.84% $ 272.54 $ 4.92 0.65%
Education 20.1% 19.5% $ 153.00 0.00% $ 153.00 $ – 0.00%
TOTAL 100% 100% $ 760.57 2.88% $ 782.46 $ 21.89 2.88%
* numbers may not add due to rounding
Overview 28Property Tax Impact
Property Taxes
Property taxes remain the largest and most important City of Amount of City
Assessed
revenue source for municipalities. The two components Burlington of Burlington
Value
required for determining property taxes are: Tax Rate Property Tax
• The current assessed value of the property
• The tax rate applied to the property class
Assessment
Current value assessment is the amount of money that
a property would sell for, if sold at arm’s length, by a Halton Amount of
Assessed
willing seller to a willing buyer. The Municipal Property Region Halton Region
Value
Assessment Corporation (MPAC) is responsible for Tax Rate Property Tax
setting assessment values for all properties in Ontario.
Residential Tax Rate
The tax rate consists of three components: The City
of Burlington, Halton Region and The Halton Boards of
Education. The city and regional portions are based on Assessed Amount of
Education
Education
budgetary needs while the education portion is based Value Tax Rate
Property Tax
on the provincial education funding requirements.
The residential tax rate is determined by dividing the
budgetary needs by the total assessment base. Tax
rates are set for each property class.
Calculating Property Taxes
Property taxes are calculated using the property’s
assessed value, the municipal tax rates (City and Region) Total Property Taxes
and the Education tax rate:
Overview 29Property Tax Comparison
Burlington’s taxes are competitive
As with all municipalities, the City of Burlington strives to strike the right balance for its residents: maintaining existing services,
programs and infrastructure and sometimes enhancing services, while managing tax increases. In a climate of increasing costs
and significantly reduced user-fee revenues, this can be a challenge. Burlington’s residential property taxes remain below the
group average when compared to similar homes in municipalities across the Greater Toronto Area (GTA).
Residential Property Tax Burdens
Detached Bungalow - BMA Management Consulting Inc. - Municipal Study 2019
7,000
6,303
6,000
5,000 4,813
4,670 4,747
4,533 4,581 4,620 4,620
4,249
4,000 3,970
3,733
3,560
3,000
Group Average
2,000
Richmond Hill
Mississauga
Halton Hills
Burlington
Markham
Hamilton
Vaughan
Oakville
Oshawa
1,000 Whitby
Milton
0
Overview 30You can also read