Prioritizing transcriptomic and epigenomic experiments using an optimization strategy that leverages imputed data
←
→
Page content transcription
If your browser does not render page correctly, please read the page content below
Bioinformatics, 37(4), 2021, 439–447
                                                                                                         doi: 10.1093/bioinformatics/btaa830
                                                                                   Advance Access Publication Date: 23 September 2020
                                                                                                                        Original Paper

Genome analysis
Prioritizing transcriptomic and epigenomic experiments
using an optimization strategy that leverages
imputed data

                                                                                                                                                                      Downloaded from https://academic.oup.com/bioinformatics/article/37/4/439/5910545 by guest on 01 June 2021
Jacob Schreiber1,*, Jeffrey Bilmes2 and William Stafford Noble                                                                    3,
                                                                                                                                   *
1
 Paul G. Allen School of Computer Science and Engineering, 2Department of Electrical and Computer Engineering and 3Department of
Genome Sciences, University of Washington, Seattle, WA 98195, USA
*To whom correspondence should be addressed.
Associate Editor: Robinson Peter
Received on November 17, 2019; revised on July 28, 2020; editorial decision on September 6, 2020; accepted on September 9, 2020

Abstract
Motivation: Successful science often involves not only performing experiments well, but also choosing well among
many possible experiments. In a hypothesis generation setting, choosing an experiment well means choosing an ex-
periment whose results are interesting or novel. In this work, we formalize this selection procedure in the context of
genomics and epigenomics data generation. Specifically, we consider the task faced by a scientific consortium such
as the National Institutes of Health ENCODE Consortium, whose goal is to characterize all of the functional elements
in the human genome. Given a list of possible cell types or tissue types (‘biosamples’) and a list of possible high-
throughput sequencing assays, where at least one experiment has been performed in each biosample and for each
assay, we ask ‘Which experiments should ENCODE perform next?’
Results: We demonstrate how to represent this task as a submodular optimization problem, where the goal is to
choose a panel of experiments that maximize the facility location function. A key aspect of our approach is that we
use imputed data, rather than experimental data, to directly answer the posed question. We find that, across several
evaluations, our method chooses a panel of experiments that span a diversity of biochemical activity. Finally, we
propose two modifications of the facility location function, including a novel submodular–supermodular function,
that allow incorporation of domain knowledge or constraints into the optimization procedure.
Availability and implementation: Our method is available as a Python package at https://github.com/jmschrei/
kiwano and can be installed using the command pip install kiwano. The source code used here and the similarity
matrix can be found at http://doi.org/10.5281/zenodo.3708538.
Contact: jmschr@cs.washington.edu or william-noble@uw.edu
Supplementary information: Supplementary data are available at Bioinformatics online.

1 Introduction                                                                         completely fill in a smaller submatrix of preselected assays and bio-
                                                                                       samples. In contrast, other consortia, such as the Roadmap
Experimental characterization of the genomic and epigenomic land-                      Epigenomics Mapping Consortium (Kundaje et al., 2015) and
scape of a human cell line or tissue (‘biosample’) is expensive but                    ENCODE (ENCODE Project Consortium, 2012), adopted a rough-
can potentially yield valuable insights into the molecular basis for                   ly ‘L’-shaped strategy, in which consortium members focused on
development and disease. Fully measuring the epigenome involves,                       carrying out many assays in a small set of high-priority biosamples,
in principle, assaying chromatin accessibility, transcription, dozens                  and a smaller set of assays over a much larger set of biosamples.
of histone modifications and the binding of over a thousand DNA-                       Recently, computational approaches have been proposed that rely
binding proteins. Even after accounting for the decreasing cost of                     on using machine learning models to impute the experiments that
high-throughput sequencing, such an exhaustive analysis is expen-                      have not yet been performed (Durham et al., 2018; Ernst and Kellis,
sive, and systematically applying such techniques to diverse cell                      2015; Schreiber et al., 2020a,b). Although the imputation strategy
types and cell states is simply infeasible. Essentially, we cannot af-                 can relatively easily complete the entire matrix, a drawback is that
ford to fill in an experimental data matrix in which rows correspond                   the imputed data is potentially less trustworthy than actual experi-
to types of assays and columns correspond to biosamples.                               mental data.
    Several approaches have been proposed to address this challenge.                       In this work, we address a variant of the matrix completion
Some scientific consortia, such as GTEx and ENTEX, aim to                              problem where the goal is to identify a set of k values within the

C The Author(s) 2020. Published by Oxford University Press.
V                                                                                                                                                             439
This is an Open Access article distributed under the terms of the Creative Commons Attribution License (http://creativecommons.org/licenses/by/4.0/), which permits
unrestricted reuse, distribution, and reproduction in any medium, provided the original work is properly cited.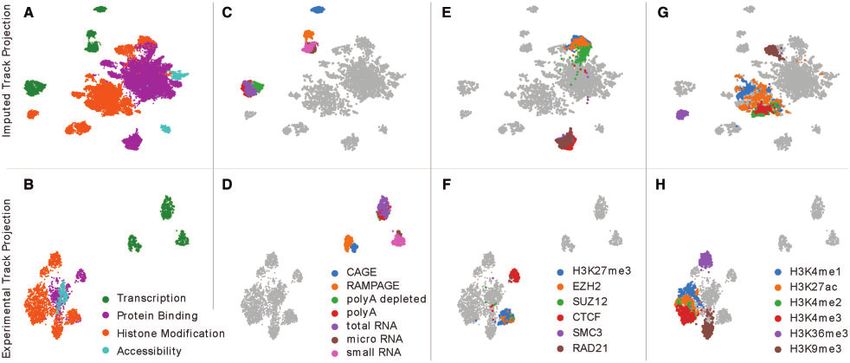
440                                                                                                                                J.Schreiber et al.

matrix that should be filled in. This problem corresponds to the           com/jmschrei/kiwano/ that can order experiments based on the pre-
scenario that we, as a field, find ourselves in currently, where we        calculated similarity matrix we use here.
have performed many assays in many biosamples and are trying to
figure out which of the remaining assay/biosample combinations
(‘experiments’) we should perform next. However, this problem is           2 Materials and methods
difficult because, by definition, we do not know how informative an
experiment will be before it is performed. As a result, the choice of      2.1 Submodular optimization and facility location
which experiments to perform is frequently driven by intuition and         Submodular optimization is the discrete analog of convex optimiza-
guesswork.                                                                 tion and operates on submodular set functions. A function is sub-
    A computational approach to this problem is to frame the selec-        modular if and only if it has the property of diminishing returns; i.e.
tion as a submodular optimization problem. In this formulation, a          the incremental gain in function value associated with adding an
submodular set function fðÞ quantifies the quality of a panel of          element s to a set A becomes smaller as the size of the set A becomes
assays relative to the full collection of potential experiments, and       larger. More formally, given a finite set S ¼ fs1 ; s2 ; . . . ; sn g, a dis-
maximization of this function involves identifying a panel of high         crete set function f : 2S ! R is submodular if and only if
quality. Framing the problem as a submodular optimization has sev-               f ðA [ sÞ  f ðAÞ  f ðB [ sÞ  f ðBÞ; 8A  B  S; s 62 B:

                                                                                                                                                           Downloaded from https://academic.oup.com/bioinformatics/article/37/4/439/5910545 by guest on 01 June 2021
eral advantages, including principled greedy approaches to opti-
mization, and the ability to seed these greedy algorithms with                 In this work, we use a submodular function whose value is in-
experiments that have already been performed. However, a chal-             versely related to the redundancy within a given set. Thus, optimiz-
lenge facing this optimization is that, generally, f relies on calculat-   ing such a function, subject to a cardinality constraint, involves
ing similarities between all pairs of input elements, and similarities     identifying the subset whose elements are minimally redundant with
cannot be calculated for experiments that have not been performed.         each other. For further reading on submodular optimization, we
    Wei et al. (2016) overcome this challenge by restricting panel se-     suggest Fujishige (2005), Krause and Golovin (2014) and Lovász
lection to one axis of the experimental matrix at a time. Although         (1983).
this restriction does not allow similarities to be calculated when             Our method relies on optimizing a particular submodular func-
assays are missing for the given biosample (or biosamples for a given      tion called facility location. Facility location takes the form
assay), these similarities can be inferred by calculating the average                                       X
similarity for each pair of assays across all other biosamples where                                f ðXÞ ¼      max /ðx; yÞ                (1)
                                                                                                                   x2X
                                                                                                             y2Y
both assays have been performed. After calculating this assay
assay similarity matrix, they choose a panel of assays by using stand-     such that Y is the full set of experiments, X is the selected subset of
ard methods to maximize a ‘facility location’ set function. An im-         experiments such that X  Y, x and y are individual experiments in
portant consequence of calculating similarities in this manner is that     X and Y respectively, and /ðx; yÞ is the squared correlation between
their method is ‘biosample-agnostic,’ in the sense that it yields a sin-   x and y. The facility location function is optimized using the acceler-
gle set of suggested assays, irrespective of biosample. Wei et al. ex-     ated greedy algorithm (Minoux, 1978), which iteratively selects the
plicitly consider the scenario in which a specified set of assays has      experiment that increases the gain by the largest amount. We use
already been performed in a given biosample, and the task is to se-        apricot v0.3.0 to perform this selection (Schreiber et al., 2019).
lect the next k assays to perform. However, even in this setting, the
proposed approach is cell-type agnostic: the method yields the same
answer for any biosample in which the specified set of assays has          2.2 Model training
been performed.                                                            We evaluated our selection process by training multi-task linear re-
    In this work, we overcome the challenge of calculating similar-        gression models using selected tracks as input and the full set of
ities for experiments that have not yet been performed by making           tracks as the output. These models were implemented using keras
use of imputed data. Because imputed data exists for every experi-         (v2.2.4) (Chollet et al., 2015) with a Theano (v1.0.4) (Theano
ment, there is no need to aggregate similarities across biosamples, as     Development Team, 2016) backend. The weight matrix that trans-
Wei et al. do. Rather, a panel of experiments can be chosen directly       formed inputs to outputs was optimized using the Adam optimizer
by maximizing the facility location function using the experiment         (Kingma and Ba, 2015) with a mean-squared-error loss. All hyper-
experiment similarity matrix. This approach has two advantages             parameters and the weight initializations are set to the keras defaults
over the work of Wei et al. First, rather than restricting our selection   with no explicit regularization.
to a single row or column of the data matrix, using imputed data               These models were trained and evaluated using different parti-
allows us to address the global question, ‘Among all possible experi-      tions of the ENCODE Pilot Regions. First, when the experiments to
ments within the experimental matrix, which one should I do next?’         use were selected using submodular optimization, they were selected
Second, even in the case where we want to choose a panel of assays         using the similarity matrix based on the first 600 000 25 bp bins
within a single given biosample, our imputation-based approach             used throughout this work. Second, the models were trained using
selects a set that is tailored to this particular biosample.               the next 500 000 25 bp bins. Finally, the models were evaluated on
    We use ENCODE data to validate our approach in several ways.           the remaining 99 362 25 bp bins. There is no overlap between these
First, we illustrate via visualization that the imputation-based simi-     three partitions.
larity matrix encodes meaningful biological relationships among
assay types and biosamples that are matched by the real data. We           2.3 Datasets
then apply the optimization procedure to this similarity matrix and        We generated our imputations using an Avocado model that had
show that the resulting subset of experiments is representative of the     previously been trained on the ENCODE2018-Core dataset
full set, both qualitatively and through simulation experiments. In        (Schreiber et al., 2020a). The model is available at https://noble.gs.
these simulation experiments, we find that our approach outper-            washington.edu/ jmschr/mango/models/. This model was trained on
forms the approach of Wei et al. in a setting similar to the one that      3814 experiments across 400 biosamples and 84 assays where the
they consider. Next, although many of our experiments involve opti-        signal was log10 P-values that had subsequently been arcsinh
mizing a plain facility location function, we show that one can in-        transformed to reduce the effect of outliers. The resulting imputa-
clude weights and a novel supermodular regularization term to              tions are in the same space. Due to the large size of the genome, we
incorporate domain knowledge that is important for choosing a              only imputed the ENCODE Pilot Regions, comprising 1% of the
practical set of experiments. Finally, we illustrate how to apply the      genome (ENCODE Project Consortium, 2007), for each of the
objective function used in our optimization to ascertain which bio-        33 600 potential experiments. This 1% is comprised of a handful of
samples are currently undercharacterized and which assays are              manually selected regions that were deemed of particular biological
underutilized. We have made a tool available at https://www.github.        interest, combined with a randomly selected set of 30 1-Mb regions
Prioritizing experiments using imputed data 441
that systematically vary in terms of gene density level of non-exonic measured by the assay. We observed that one cluster contained
conservation. mostly protein binding experiments, one contained mostly histone
An important detail is that, at the time of accession, experiments modification experiments, and several neighboring clusters were
measuring transcription had been divided into plus-strand signal composed exclusively of transcription-measuring experiments.
and minus-strand signal on the ENCODE portal. Consequently, Initially, one might expect that experiments in the same biosample
each strand was counted as a separate assay when training the where the assays measure the same underlying phenomena might
Avocado model. While the strand that transcription occurs on is im- cluster together. However, we observed that in some cases a pair of
portant for an imputation approach to capture, this distinction is experiments may exhibit low correlation when the shape of their sig-
not helpful for prioritizing experiments because one generally can- nals along the genome differ, even when the assays used in the
not perform an experiment measuring transcription on only one of experiments both measure the same underlying biological activity.
the strands. Thus, we combine the plus- and minus-strand experi- For example, the histone modification H3K36me3 is known to be
ments for both the imputed and the primary epigenomic data by associated with transcription but generally forms broad peaks across
simply adding the tracks together. This process reduced the total the entire gene body, whereas assays such as CAGE or RAMPAGE
number of assays from 84 to 77, the total number of performed form punctate peaks.
experiments from 3814 to 3510, and the total number of potential To confirm that the separation according to assay categorization
Downloaded from https://academic.oup.com/bioinformatics/article/37/4/439/5910545 by guest on 01 June 2021
experiments from 33 600 to 30 800. was not an artifact of the imputation process, we used the same pro-
cess to calculate a similarity matrix and subsequent UMAP projec-
tion for the 3150 tracks of the experimental (or ‘primary’) data
3 Results (Fig. 1B). The major trends present in the projection of imputed data
are consistent with those in the primary data. In particular, tran-
3.1 Imputations cluster according to known biological scription experiments form distinct clusters, protein binding experi-
patterns ments are mostly distinct from histone modification ones, and
Our approach for prioritizing experimental characterization relies chromatin accessibility experiments localize closer to protein bind-
on a similarity matrix that is calculated on imputed experiments. To ing experiments than to histone modification experiments. Note
produce this matrix, we first generated imputations of epigenomic that although the figure may appear to show that accessibility
and transcriptomic experiments using a recently developed imput- experiments overlap with protein binding experiments, a closer
ation approach based on deep tensor factorization, named Avocado. examination reveals that the protein binding experiments mostly
These imputations span 400 human biosamples and 77 assays of surround the accessibility experiments.
biological activity for a total of 30 800 imputed tracks. After acquir- Next, we more closely examined four sets of assays that, a priori,
ing these imputations, we calculated the squared Pearson correlation we expected to show distinctive patterns. The first set of experi-
between all pairs of imputed experiments for use as a similarity ments was those that measured transcription. When we highlighted
measure, resulting in a 30 800 by 30 800 matrix. For efficiency, experiments by assay type, we observed CAGE and RAMPAGE
these correlations were computed with respect to the ENCODE experiments forming distinct cluters, micro- and small-RNA-seq
Pilot Regions (ENCODE Project Consortium, 2007), comprising experiments forming a third cluster, and polyA-, polyA-depleted-
1% of the genome. and total-RNA-seq experiments forming a fourth (Fig. 1C and D).
After calculating the similarity matrix, we investigated whether The second and third sets of experiments involved triplets of assays
the similarity matrix was able to capture high level biological trends whose activity are usually associated, specifically, with CTCF and
that would be crucial for prioritization. We began by visually the cohesin subunits, SMC3 and RAD21, as well as H3K27me3 and
inspecting a two-dimensional UMAP projection (McInnes and two polycomb subunits, EZH2 and SUZ12 (Fig. 1E and F). In both
Healy, 2018) of the similarity matrix down to two dimensions cases we observe distinct clusters of experiments, which is particu-
(Fig. 1A). The clearest trend in this projection is a separation of larly interesting for H3K27me3 and the polycomb subunits because
experiments based on a broad categorization of the type of activity one assay measures a histone modification and the other two
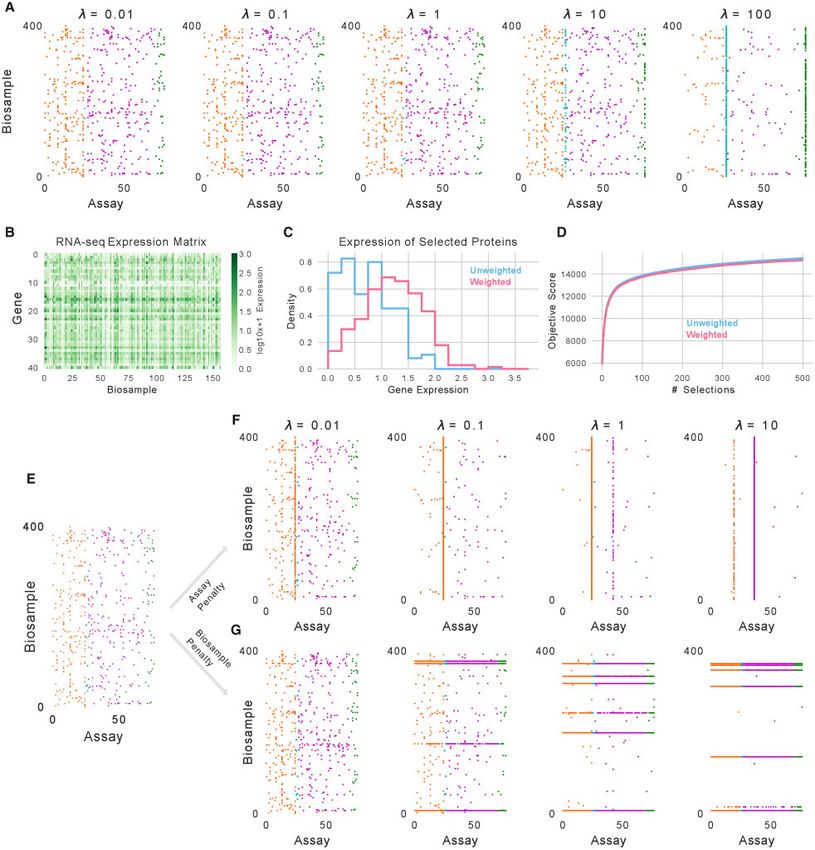
Fig. 1. A projection of imputed and experimental epigenomic tracks. Each panel shows a UMAP projection of 30 800 imputed experiments (top row) or of 3150 tracks of pri-
mary data (bottom row). In each column, a different set of experiments is highlighted based on their biological activity. (A/B) Experiments are highlighted based on broad cat-
egorization of the assayed activity. (C/D) Transcription-measuring experiments are colored according to different types of assays. (E/F) Experiments are highlighted that
measure H3K27me3 and two polycomb subunits, as well as CTCF and two cohesin subunits. (G/H) Experiments are highlighted showing several histone modifications that
are enhancer-associated, such as H3K4me1 (blue) and H3K27ac (orange), promoter-associated such as H3K4me2 (green) and H3K4me3 (red), transcription-associated such
as H3K36me3 (purple) or broadly repressive such as H3K9me3 (brown)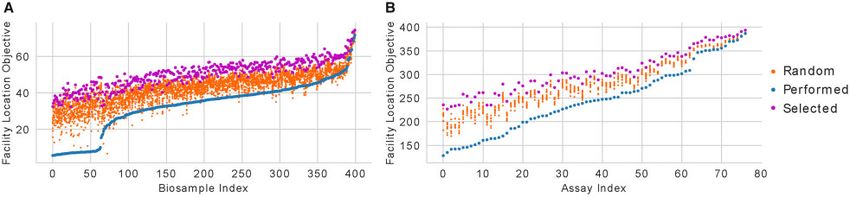
442                                                                                                                                                       J.Schreiber et al.

measure protein binding. The fourth set of experiments focused on                          applied to our similarity matrix, the submodular selection procedure
six well-studied histone modifications (Fig. 1G and H). The cluster-                       will yield an ordering over all experiments that attempts to minimize
ing of these six marks coincides with the genomic element in which                         redundancy among those experiments that are selected early in the
they are typically enriched. In particular, experiments measuring                          process.
H3K36me3 and H3K9me3 form their own clusters, with the two                                     To demonstrate that submodular selection results in a represen-
assays respectively measuring activity enriched in gene bodies and                         tative subset of assays, we applied it to our calculated similarity ma-
constitutive heterochromatin. Further, the primary cluster of histone                      trix. Visually, we observe that the first 50 selected experiments
modification experiments exhibited a separation between the                                appear to cover the space well and include selections from many of
promoter-associated marks, H3K4me2 and H3K4me3, and the                                    the small clusters of experiments (Fig. 2A, Supplementary Table S1).
enhancer-associated marks, H3K4me1 and H3K27ac. We observed                                When we count the number of assays selected for each type of bio-
similar patterns across both the imputed and primary data for each                         logical activity, we find that protein binding assays are the most
of these four sets of assays. Taken together, these observations sug-                      commonly selected with 23 experiments, followed by histone modi-
gest that a similarity matrix derived from imputed experiments is                          fication assays with 19 experiments, transcription assays with 6
successfully capturing important aspects of real biological activity.                      experiments, and, finally, accessibility assays with 2 experiments
                                                                                           (Fig. 2B). However, when we compare the number of selected

                                                                                                                                                                                    Downloaded from https://academic.oup.com/bioinformatics/article/37/4/439/5910545 by guest on 01 June 2021
                                                                                           experiments of each type to the number that one would expect by
3.2 Submodular selection of imputations flexibly                                           randomly selecting with replacement, we observe that protein bind-
prioritizes assays across cellular contexts                                                ing experiments are underrepresented, whereas histone modification
Having shown that the similarity matrix captures several high-level                        experiments are overrepresented. We note that the first 10 experi-
trends in the data, we turn to the task of experimental prioritization.                    ments are at the centers of large clusters of experiments and that the
Our strategy for prioritizing experiments relies on submodular selec-                      subsequent 40 experiments are selected from smaller clusters. This
tion, which is a technique for reducing a set of elements to a minim-                      finding corresponds with the gain in the facility location objective
ally redundant subset through the optimization of a submodular                             score from each successive experiment significantly diminishing by
function that captures the quality, or ‘representativeness,’ of a given                    the tenth experiment (Fig. 2C).
subset relative to the full set (see Section 2 for details). Submodular                        We then evaluated the stability of our procedure by applying it
selection has been used previously to select genomics assays (Wei                          to randomly selected sets of genomic loci drawn from the entire gen-
et al., 2016), to select representative sets of protein sequences                          ome, rather than a portion of the ENCODE Pilot Regions. As a
(Libbrecht et al., 2018) and to choose genomic loci for characteriza-                      practical matter, we could not select these positions from the impu-
tion by CRISPR-based screens (Gasperini et al., 2019). Specifically,                       tations themselves because it would involve storing > 30k genome-
we optimize a ‘facility location’ objective function, which operates                       wide tracks in memory. Furthermore, because each track took
on pairwise similarities between elements and so is well suited to le-                     roughly half a gigabyte to store in memory, we were restricted to
verage our similarity matrix (see Section 2). A critical property of                       using only a subset of 800 of the 3150 experimental tracks. When
submodular functions is that greedy optimization will yield a subset                       we applied our procedure to these 800 tracks to choose 50 experi-
whose objective value is within 1  e1 of the optimal subset, and                         ments, we found that a similar number of experiments were selected
that this is the best approximation one can make unless P¼NP                               across 100 runs for each type of biological activity (Supplementary
(Nemhauser et al., 1978). This greedy optimization algorithm itera-                        Fig. 1A). Likewise, we found a similar number of experiments
tively selects the single element whose inclusion in the representative                    selected per assay (Supplementary Fig. 1B). We also noted that these
set leads to the largest gain in the objective function. Thus, when                        numbers were similar to the number of experiments chosen when

Fig. 2. A selection of experiments before and after accounting for those that have already been performed. (A) The same projection of imputed experiments as shown in
Figure 1A, where the first 50 experiments selected using our method are colored by the type of activity that they measure. The first 10 experiments selected are marked using
an X, and the remaining 40 are marked with a dot. (B) A bar chart showing the frequency that experiments of each type of activity are selected in the first 50 experiments. (C)
The facility location objective score as the first 50 experiments are selected, with each point colored by the type of activity measured by that experiment. (D) The same as (A),
but with the selection procedure initialized with the experiments that have already been performed, and with those experiments displayed in dark gray. (E) The same as (B),
but with dark gray bars showing the frequency of experiments of each type that have already been performed. (F) The same as (C), but with the selection procedure initialized
with the experiments that have already been performed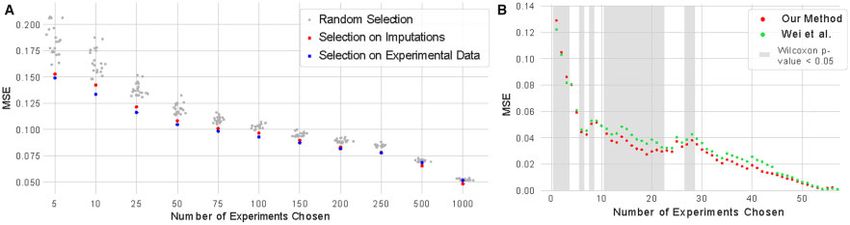
Prioritizing experiments using imputed data                                                                                                                                  443

using the ENCODE Pilot Regions. Together, these results indicate                            those forms of activity are already much better measured than pro-
that the selection is stable to small perturbations in the correlation                      tein binding. In this setting, the gain in the facility location objective
matrix, and that the ENCODE Pilot Regions are a reasonable ap-                              function of each successive experiment is much lower, due in large
proximation of a random sample of the entire genome.                                        part to the experiments that have already been performed (Fig. 2F).
     Next, we consider whether the selection process is influenced by
the number of available experiments for each biosample or assay.
                                                                                            3.3 Selection on imputed experiments identify diversity
Potentially, biosamples and assays with plentiful available data will
have more information-rich imputations that are consequently pri-                           in primary data
oritized highly by our method, whereas biosamples and assays with                           Our next step was to evaluate the quality of the selected experiments
little available data will have poor quality imputations that appear                        in a quantitative way. Following Wei et al., we reasoned that the sig-
similar to each other and are largely ignored by the method.                                nal contained in a representative subset of experiments would be
However, we did not find any evidence that this was the case. When                          well suited for reconstructing the signal in all experiments. We for-
we used our approach to choose a panel of 500 experiments, we                               mulated the problem of quantitatively measuring how representative
observed little correlation between the number of available experi-                         a subset is as a multi-task regression problem, with the input fea-
ments and the number of chosen experiments for each biosample                               tures being the signal from the selected subset of experiments and

                                                                                                                                                                                     Downloaded from https://academic.oup.com/bioinformatics/article/37/4/439/5910545 by guest on 01 June 2021
and assay (Supplementary Fig. 2). Further, we found that only 5.6%                          the outputs being the signal from the full set of experiments (see
(28) of the 500 chosen experiments corresponds to experiments that                          Section 2). Importantly, to ensure that this validation measured how
had actually been performed and were used to train the underlying                           representative a subset is of the primary data, despite subset selec-
imputation model, indicating that our method does not simply select                         tion having been performed on the imputations, we used the primary
experiments from the training set of the underlying imputation                              data as both the input and target for this task.
model.                                                                                          We selected a subset of experiments in three ways. The first was
     A weakness in simply applying submodular selection to the full                         through the submodular selection procedure described in Section
set of imputed experiments is that the procedure does not account                           3.2, applied to the 3150 imputed experiments for which primary
for the thousands of epigenomic and transcriptomic experiments                              data had already been collected. The second was by applying the
that have already been performed. Fortunately, there are two ways                           submodular selection procedure to the 3150 tracks of primary data
that one can account for these experiments. The first is to remove                          themselves. Naturally, selecting subsets based on the primary data
those experiments that have already been performed from the simi-                           cannot be extended to experiments that have not yet been per-
larity matrix and perform selection on the remaining experiments.                           formed, and so the purpose of evaluating models trained using this
While this approach is simple, it does not account for the content of                       subset is to measure the effect that the imputation process itself has
the experiments that have already been performed. For example, if                           on selecting a representative subset of experiments. The third was
transcription has already been measured in hundreds of biosamples,                          selecting subsets of the 3150 performed experiments at random.
then it may be beneficial to focus experimental efforts on character-                       This random process was repeated 20 times to obtain a distribution
izing other types of biological activity. A second approach takes ad-                       of scores.
vantage of the fact that the selection process is greedy by initializing                        We observed that the subsets of experiments selected using sub-
the set of selected experiments with those that have already been                           modular selection consistently outperform those selected at random
performed. This ensures that the selected experiments cover types of                        (Fig. 3A). Each comparison is statistically significant at a P-value
activity that are not already well characterized.                                           threshold of 0.01 according to a one sample t-test. Further, for
     Accordingly, we proceeded with the second approach. We ini-                            smaller subsets, applying submodular selection to the imputed tracks
tialized a facility location function with the 3150 experiments that                        performs nearly as well as the panels selected on the primary data it-
had already been performed and ranked the remaining 27 650                                  self, showing that the distortion introduced by the imputation pro-
experiments. We observed that the selected experiments lie primarily                        cess is small. Interestingly, when the subsets become much larger,
in areas of the UMAP projection that do not already have many                               those selected using imputed tracks appear to outperform those
experiments performed (Fig. 2D, Supplementary Table S2). When                               selected using the primary data. This trend may arise because
we counted the number of selected experiments of each type, we                              imputed tracks can serve as denoised versions of the primary data
found that the number of protein binding experiments increased                              (Ernst and Kellis, 2015). At the beginning of the selection process,
from 23, when not accounting for the experiments that had already                           this denoising is not necessary to select experiments that are very dif-
been performed, to 41, when accounting for them (Fig. 2E).                                  ferent from each other. However, once many experiments have been
Correspondingly, the number of histone modification experiments                             selected, the denoised experiments may be better at identifying real
decreased from 19 to 9. This change in coverage is likely because                           differences between experiments. We observed similar trends when
1726 experiments measuring histone modification have already                                the selection step was performed on a different set of experiments
been performed, whereas only 571 experiments measuring protein                              from those used to evaluate the regression model (Supplementary
binding have been performed. Further, none of the first 50 selected                         Fig. ??A), and when an entire form of biochemical activity, in this
experiments measure transcription or accessibility, likely because                          case protein binding assays, was held out from the selection step and

Fig. 3. Imputation performance using different panels of assays. (A) The performance of regression models (in terms of mean-squared-error, MSE) as a function of the number
of experiments chosen as the input. These panels range in size from 5 assays to 1000 assays, and are selected either randomly (gray), through a facility location function applied
to imputed experiments (red), or through a facility location function applied to primary data (blue). (B) The average performance of regression models across all biosamples as
a function of the number of experiments chosen as the input for that biosample. The panels are chosen either using our approach or the method of Wei et al. Gray shading indi-
cates differences that are significant at Wilcoxon P-value    0:05
444 J.Schreiber et al.
then used to evaluate the regression model (Supplementary Fig. consisted of these experiments, with 222 DNase-seq experiments
??B). and 137 total RNA-seq experiments. These results demonstrate not
Next, we compared our approach to the approach proposed by only that the weights influence the selection process but that the
Wei et al. in their restricted setting of choosing a subset of assays relative weights are important, with roughly half as many total
within a particular biosample. Specifically, for each biosample, we RNA-seq experiments selected as DNase-seq experiments.
derive similarity matrices from the imputed experiments for that We then considered a more sophisticated use of the weights by
biosample (our approach) or the average similarity over experiments setting them using biological measurements. A potential issue with
from every other biosample (their approach). It is worth mentioning our selection of protein binding experiments is that not all proteins
that, even though this evaluation setting is similar to the one consid- are expressed in every biosample (Fig. 4B). A protein that is not
ered by Wei et al., it is not identical: our approach is still restricted expressed cannot bind to the genome, and the corresponding ChIP-
to the set of biosamples where imputations are available. In a similar seq experiment measuring binding of that protein, although yielding
manner to the previous evaluations in this section, we then evaluate a flat signal that is likely very dissimilar to other protein binding
how well regression models can use varying sized subsets of assays experiments, would be uninformative. We can penalize the selection
from a particular biosample to predict the full set of assays within of such unwarranted experiments by weighting protein binding
the biosample. The errors are then averaged across biosamples for experiments using gene expression values from RNA-seq assays.
Downloaded from https://academic.oup.com/bioinformatics/article/37/4/439/5910545 by guest on 01 June 2021
each panel size. Specifically, we set the weight of each protein binding assay to
In this setting, our method outperformed the method of Wei log10 ðTPM þ 1Þ where TPM is the transcripts-per-million value
et al. for most subset sizes, and frequently by a large margin from a total RNA-seq experiment for the relevant gene and biosam-
(Fig. 3B). Although our method results in errors up to 5.6% higher ple. This weighting scheme downweights protein binding experi-
for subsets of sizes one through three, it achieves reductions in MSE ments when the protein is not expressed in that biosample and
of up to 27.4% for larger panel sizes. Further, our approach upweight those experiments where the protein is expressed highly.
achieves a lower error with a Wilcoxon P-value 0:05 for 16 panel Because some biosamples did not have a total RNA-seq experiment
sizes (Wei et al. outperforms our method with a Wilcoxon P-value performed in them, we excluded from this analysis all protein bind-
0:05 for panel sizes between one and three). We noted that most ing experiments from biosamples without a total RNA-seq experi-
panel sizes do not show a statistically significant difference between ment performed in it.
the two methods, mostly because there are few biosamples where a We find that weighting experiments in this manner results in
large number of assays have been performed. These results indicate choosing fewer unwarranted experiments. Overall, this procedure
that the use of imputed data leads to better panels of experiments raised the median TPM of the genes encoding the assayed proteins
than averaging similarities across other biosamples. from 4.1 to 16.2 and reduced the number of chosen experiments
with a corresponding TPM ofPrioritizing experiments using imputed data 445
Downloaded from https://academic.oup.com/bioinformatics/article/37/4/439/5910545 by guest on 01 June 2021
Fig. 4. Controlling selection with an extended objective function. (A) The 500 experiments selected as the weights for DNase and total RNA-seq experiments changes. (B) Log-
transformed gene expression values for the proteins whose binding is assayed in ENCODE2018-Core across 157 biosamples. (C) The expression values for selected protein
binding experiments in the original setting (blue) and when weighting experiments by the log-transformed expression values (pink). (D) The score from the facility location ob-
jective function without weighting from the experiment subsets when weighting or not weighting the objective. (E) A selection of 500 experiments performed normally. (F) A
selection of 500 experiments when mixing the submodular function with a supermodular assay penalty of varying weight. (G) A selection of 500 experiments when mixing the
submodular function with a supermodular biosample penalty of varying weight
entire biosamples or assays. We next considered a scenario where an A final component of our methodology is the ability to quantify
investigator is looking to either assay undercharacterized biosamples the extent to which each biosample has been characterized and each
or to run underperformed assays, but is unsure which biosamples or assay has been performed using the facility location objective func-
assays to focus on. A simple approach would be to count the number tion. Because the objective function takes in a set of experiments
of experiments that each biosample or assay is involved in and and returns a score corresponding to the diversity of the set, this
choose the ones with the fewest experiments. However, this ap- function can be used to assess the diversity obtained by an existing
proach does not account for the content of the performed experi- set of experiments, corresponding to a single biosample or a single
ments, which can be extremely similar in some cases. For example, type of assay. In our setting, where similarity is measured via
in the ENCODE data several biosamples have been assayed exten- squared correlation, this score ranges from zero up to the total num-
sively for transcription but not assayed at all for histone modifica- ber of experiments that have been performed. Thus, for each bio-
tions or protein binding. sample, the maximum value is 77 due to the 77 assays in the446 J.Schreiber et al.
dataset, and for each assay, the maximum value is 400 due to the use the resulting imputations to prioritize the remaining experi-
400 biosamples in the dataset. ments. Potentially, for such a system, it may be possible to identify
We applied this approach to score each of the biosamples and closely related experiments for which imputations have already been
assays in the ENCODE2018-Core dataset. Not surprisingly, we find generated. Although these imputations may not capture activity spe-
that the three ENCODE Tier 1 cell lines—H1-hESC, K562 and cific to an experiment, it is likely that the resulting similarity matrix
GM12878—are the three best scoring biosamples, with scores of would provide a reasonable approximation. However, in the setting
71.2, 70.2 and 68.6, respectively. These biosamples are followed by where one truly knows nothing about a biosample or assay, the
several ENCODE Tier 2 cell lines, such as HepG2, IMR90 and method proposed by Wei et al. provides a principled approach for
HeLa-S3. We found a rank correlation of 0.82 between the number choosing an initial panel of assays to comprehensively perform in
of assays performed in a biosample and the objective score, confirm- each biosample in the system before imputing the remaining missing
ing that while in general there is increase in coverage as more assays experiments.
are performed, the composition of those assays is also captured by Although the primary question we address is how to prioritize
the objective function. Next, we scored the assays and found that experiments across both biosamples and assays, we recognize that
the highest scoring ones were H3K4me3, H3K36me3 and CTCF, this approach may not always result in a practical set of experiments
whereas the lowest scoring assays are H2BK15ac and FOXK2. We to perform. In practice, it is generally more difficult to culture and
Downloaded from https://academic.oup.com/bioinformatics/article/37/4/439/5910545 by guest on 01 June 2021
found a weaker, but still very significant, rank correlation of 0.66 maintain a variety of biosamples than it is to maintain a large quan-
between the number of biosamples that an assay was performed in tity of a single biosample, making sets of experiments that span sev-
and the objective score. eral biosamples harder to perform than those in the same biosample.
We next sought to contextualize the scores we obtained for each This difficulty may cause investigators to prefer performing batches
biosample and assay by comparing them to scores obtained if one of experiments within a biosample. Accordingly, we have proposed
had used alternate methods to select experiments. For each element, weighting experiments to incorporate domain knowledge and a
i.e. a particular assay or biosample, we scored 10 randomly selected novel submodular–supermodular function that encourages the
panels of the same size as the number of experiments involving that chosen experiments to span a compact set of biosamples and assays.
element. In addition, we score the panel of experiments that would However, there are likely more aspects of performing experiments,
have been selected using submodular selection. We observe a strik- e.g. the predicted cost of each experiment and the anticipated diffi-
ing result, which is that the set of experiments that were actually culty, that could also be directly included in the optimization
performed not only underperforms the set selected through submod- procedure.
ular selection, but also generally underperform random selection When we scored the biosamples in the ENCODE2018-Core
(Fig. 5). This trend is consistent across both biosamples and assays. dataset using the facility location objective function, we noted that
We note that the 64 biosamples with the worst scores were assayed the actual set of assays performed in many biosamples performed
almost exclusively for transcription, supporting the notion that bio- worse than randomly selecting an equally sized panel of assays.
samples with more assays performed in them are not always better However, this trend is not entirely surprising. The experiments that
characterized. are included in our dataset were intentionally devised to investigate
specific research questions, and generally these questions do not aim
to broadly characterize the human epigenome. Thus, these results
4 Discussion serve primarily to demonstrate that the current strategy for selecting
In this work, we describe an approach for the prioritization of epige- experiments is not well suited for the goal of characterizing the over-
nomic and transcriptomic experiments that has the potential to in- all diversity of activity in the human epigenome.
crease the rate of scientific discovery by focusing characterization A potential weakness in our method is that mistakes in the im-
efforts on those experiments that are expected to yield the least re- putation process may be propagated to the selection process. These
dundant information. To our knowledge, this is the first approach mistakes can be simple errors in predicting certain peaks or can in-
that enables the global prioritization of experiments across both bio- volve more systematic trends. For example, REST is a transcription
samples and assays. We anticipate that, due to the time it takes to factor that is involved in suppressing neuronal genes in non-
perform experiments and the simplicity of our method, investigators neuronal tissues. However, the ENCODE2018-Core dataset does
may use our prioritization methods even when they plan eventually not have examples of REST in neuronal tissue, and so an imputation
to perform all potential experiments to begin analyses sooner. model trained on this dataset would likely be unaware of this prop-
An important consideration is that, due to the reliance on erty of REST. Consequently, the prioritization process is unlikely to
imputed experiments, our method cannot be applied directly to a capture that REST binding in neuronal tissues is significantly differ-
biosample or assay type when no experiments have yet been per- ent than in non-neuronal tissues. Another consideration is that our
formed. In particular, in the setting where a researcher aims to char- method may be unlikely to prioritize experiments in biosamples
acterize a distinct system for which essentially nothing is known with poor quality imputations because those imputations are usually
about the different biosamples and assays, then it would be neces- similar to the average signal, i.e. appear to be unsurprising. In gen-
sary to first perform a subset of experiments that include all assays eral, unexpected patterns in data that has not yet been collected will
and biosamples for use in training an imputation model, and then be difficult for any prioritization method to account for.
Fig. 5. Scoring biosamples and assays according to their captured diversity. (A) The facility location objective score for each biosample when applied to the set of experiments
that investigators have performed in that biosample (blue), the set of experiments identified by optimizing the objective function (magenta), and the sets of randomly selected
experiments (orange), ordered by the score of the performed experiments. (B) The same as (A), but for each assay instead of each biosamplePrioritizing experiments using imputed data 447
The flexibility of our method allows for several extensions that Durham,T.J. et al. (2018) PREDICTD: PaRallel Epigenomics Data
we did not consider here, but may nonetheless prove valuable to Imputation with Cloud-based Tensor Decomposition. Nat. Commun., 9.
those prioritizing experiments. The first is that, in the setting where ENCODE Project Consortium. (2007) Identification and analysis of functional
one is prioritizing experiments within a particular biosample, one elements in 1% of the human genome by the ENCODE pilot project.
Nature, 447, 799–816.
could measure the gain that each successive experiment adds to the
ENCODE Project Consortium. (2012) An integrated encyclopedia of DNA
objective function to determine when to stop performing experi-
elements in the human genome. Nature, 489, 57–74.
ments. This would serve as a data-driven indicator of when further Ernst,J. and Kellis,M. (2015) Large-scale imputation of epigenomic datasets
experimental efforts are mostly redundant. A second extension is for systematic annotation of diverse human tissues. Nat. Biotechnol., 33,
that one could calculate the similarity matrix using only a specific 364–376.
genomic locus or set of loci of interest. For example, if an investiga- Fujishige,S. (2005) Submodular Functions and Optimization, Vol. 58. Elsevier
tor was aiming to experimentally quantify the activity surrounding Science, Amsterdam.
an important gene across many biosamples, one could restrict the Gasperini,M. et al. (2019) A genome-wide framework for mapping gene regu-
similarity calculation to a window surrounding that gene. Overall, lation via cellular genetic screens. Cell, 176, 377–390.
our approach is a simple yet powerful way to prioritize experiments Kingma,D. and Ba,J. (2015) Adam: a method for stochastic optimization.
in a wide variety of contexts. In Proceedings of the 3rd International Conference on Learning
Downloaded from https://academic.oup.com/bioinformatics/article/37/4/439/5910545 by guest on 01 June 2021
Representations. https://arxiv.org/abs/1412.6980
Krause,A. and Golovin,D. (2014) Submodular function maximization. https://
Acknowledgements www.cambridge.org/core/books/tractability/submodular-function-maxi
mization/C1925D301CBF7D7BBC55E44644A1ABA1
The authors acknowledge Rick Myers, Bryan Moyers, Kim Newberry, Sarah
Kundaje,A. et al.; Roadmap Epigenomics Consortium. (2015) Integrative
Meadows Eric Mendenhall, Chris Partridge and Mark Mackiewicz for several
analysis of 111 reference human epigenomes. Nature, 518, 317–330.
helpful discussions.
Libbrecht,M.W. et al. (2018) Choosing non-redundant representative subsets
of protein sequence data sets using submodular optimization. Proteins, 86,
454–466.
Funding Lovász,L. (1983) Submodular functions and convexity. In: Bachem ,M.G.A.
and Korte,B. (eds.) Mathematical Programming – the State of the Art.
This work was supported by National Institutes of Health award U01
Springer-Verlag, Bonn, pp. 235–257.
HG009395.
McInnes,L. and Healy,J. (2018) UMAP: uniform manifold approximation and
Conflict of Interest: none declared. projection for dimension reduction. arXiv.
Minoux,M. (1978) Accelerated greedy algorithms for maximizing submodular
set functions. Optim. Techn., 7, 234–243.
Nemhauser,G.L. et al. (1978) An analysis of approximations for maximizing
Data availability
submodular set functions. Math. Program., 14, 265–294.
All data used in this study is publicly available at https:// Schreiber,J.M. et al. (2019) apricot: submodular selection for data summariza-
www.encodeproject.org. tion in python. arXiv. https://arxiv.org/abs/1906.03543.
Schreiber,J.M. et al. (2020a) Completing the ENCODE3 compendium yields
accurate imputations across a variety of assays and human biosamples.
Genome Biol., 21.
References
Schreiber,J.M. et al. (2020b) Multi-scale deep tensor factorization learns a la-
Bai,W. and Bilmes,J. (2018) Greed is still good: maximizing monotone tent representation of the human epigenome. Genome Biol., 21.
SubmodularþSupermodular (BP) functions. In Proceedings of the 35th Theano Development Team. (2016) Theano: a Python framework for fast
International Conference on Machine Learning, pp. 304–313. http://pro computation of mathematical expressions. arXiv e-prints, abs/1605.02688.
ceedings.mlr.press/v80/bai18a.html Wei,K. et al. (2016) Choosing panels of genomics assays using submodular
Chollet,F. et al. (2015) Keras. https://keras.io. optimization. Genome Biol., 17, 229.You can also read