PATTERNS AND TRENDS OF SUBSTANCE USE - MAY 2018 This product is supported by Florida Department of Children and Families' Office of Substance ...
←
→
Page content transcription
If your browser does not render page correctly, please read the page content below

PATTERNS AND TRENDS OF
                                SUBSTANCE USE
                                                                WITHIN AND ACROSS
                                                            THE REGIONS OF FLORIDA
                                                                           MAY
                                                                           2018
                     This product is supported by Florida Department of
                     Children and Families’ Office of Substance Abuse
                     and Mental Health funding.
Office of Substance Abuse
   and Mental Health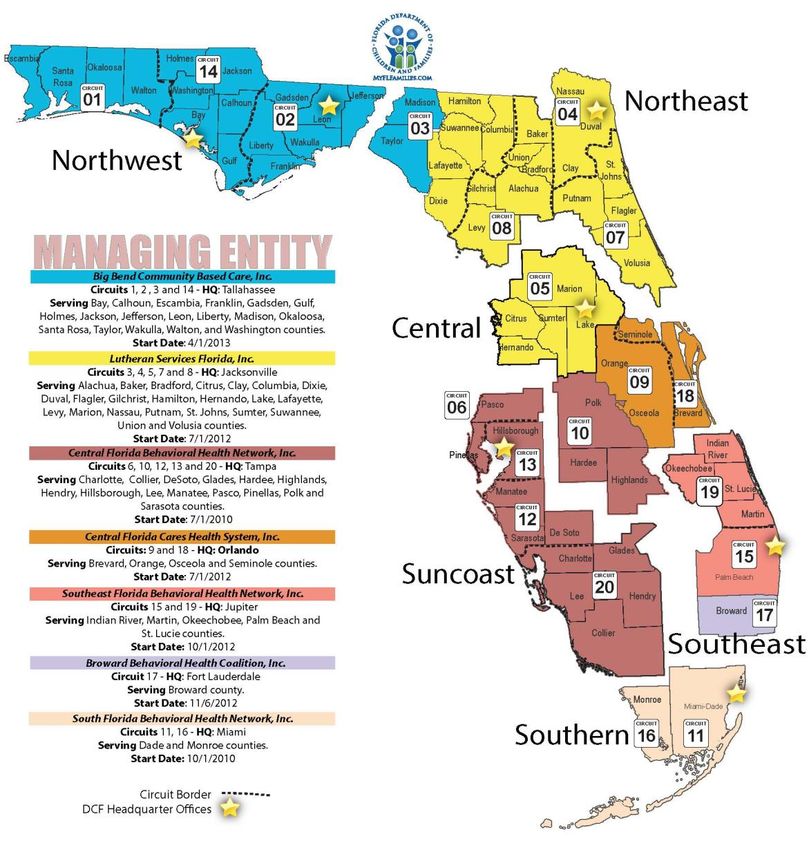
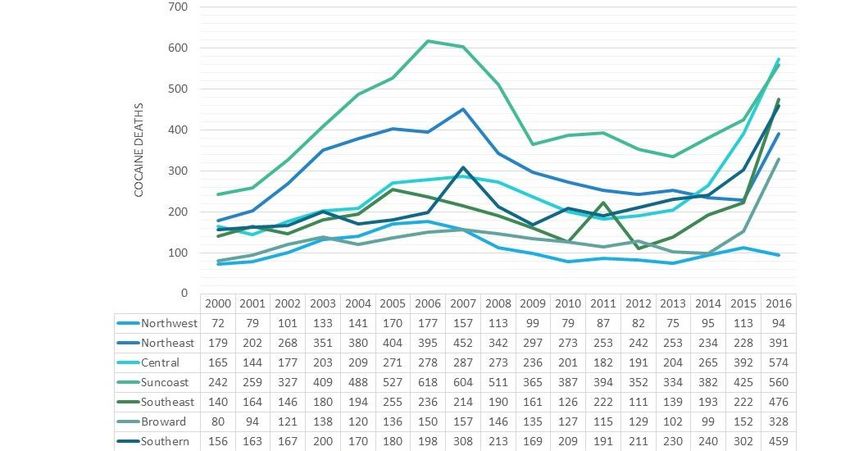
Table of Contents

SECTION I. Introduction ...........................................................................................................3
   Report Highlights ........................................................................................................................... 5
   Florida’s Managing Entity Regions ................................................................................................ 7
Section II. Patterns and Trends of Substance Use ....................................................................9
   Alcohol ........................................................................................................................................... 9
      Underage Alcohol Use ............................................................................................................... 9
      Adult Problematic Alcohol Use ................................................................................................ 13
   Tobacco ....................................................................................................................................... 15
   Electronic Vaporizers................................................................................................................... 17
   Marijuana .................................................................................................................................... 18
   Novel Psychoactive Substances .................................................................................................. 23
      Tryptamines ............................................................................................................................. 23
      Piperazines ............................................................................................................................... 23
      Synthetic Cathinones ............................................................................................................... 23
      Phenethylamines ..................................................................................................................... 24
      Synthetic Opioids – Fentanyl Analogs ..................................................................................... 25
   The Opioids.................................................................................................................................. 26
      Nonmedical Use of Prescription Opioids ................................................................................. 26
          Fentanyl Analogs .................................................................................................................. 27
      Heroin ...................................................................................................................................... 29
   Cocaine ........................................................................................................................................ 33
   Methamphetamine ..................................................................................................................... 36
   Nonmedical Use of Prescription Benzodiazepines...................................................................... 37
   Emerging issues: Kratom - Mitragyna ......................................................................................... 38
Section III. Data Sources, Appendices with Data Tables .......................................................... 41
   Data Sources................................................................................................................................ 41
   Appendix I – Judicial Circuit Crime Reports 2015-2016 ....................................................................43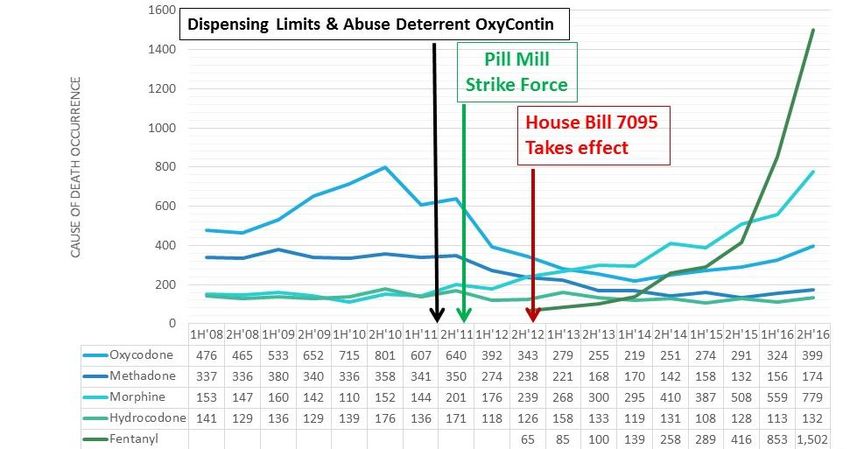
2
Patterns and Trends of Substance Use
             Within and Across the Managing Entity Regions of Florida

                                Lee A. Crandall, Ph.D.
                             Epidemiologist and Professor
                          Department of Public Health Sciences
                                  Clemson University

SECTION I. INTRODUCTION

This report provides a statewide and regional overview of substance abuse issues and
trends in Florida. The information provided is from multiple sources available as of
December 2017. Florida‘s 2017 population was estimated to be slightly more than
20,484,000 residents (20,363,867 when inmates are excluded), according to the Bureau
of Economic and Business Research (BEBR). This is an increase of nearly 9% since the
2010 census. Approximately 4.1 million Floridians were born in another country (20%)
and even more were born in another U.S. State, according to the U.S. Census Bureau.
Thus, Florida’s population is a cultural sample of the Americas and serves as a sentinel
site for observing emerging issues and changing patterns of substance abuse.

This report combines information from existing data sources that have been calculated to
provide an overview of recent patterns and trends of substance use in various regions of
the State and across all of Florida. The Florida Department of Children and Families
recognizes six multi-county regions and provides behavioral health services to Florida’s
diverse population through its seven Managing Entities. Where possible, data have been
broken down into geographical regions by Managing Entity.

In 2017, historic declines in alcohol use, binge drinking, and cigarette smoking among
Florida middle and high school students continued mirroring national trends (Florida Youth
Substance Abuse Survey, 2016). About one of every thirteen students reported “vaping”
(using electronic cigarettes or similar devices that produce an aerosol) during the past 30
days, three times the frequency of cigarette use, but a decline from 2016. The aerosol
produced by vaping devices is often mistaken for tobacco but contains fine particles, many
of which contain toxic chemicals.

The Florida Medical Examiners Commission 2017 report found that consequences of
Novel Psychoactive Substances (NPS) such as synthetic cathinones (e.g., “flakka” and
“Molly’s”) and fake marijuana synthetic cannabinoids significantly declined again from
2015 to 2016. There was a 42% decrease in deaths caused by cathinones.

Conversely, the opioid epidemic continued to worsen dramatically in Florida and across
the nation during 2016 and 2017. The most lethal component of this epidemic has been
the rapid spread of illicitly manufactured non-pharmaceutical opioids mostly from foreign
clandestine labs, especially fentanyl analogs that often are extraordinarily potent.

                                            3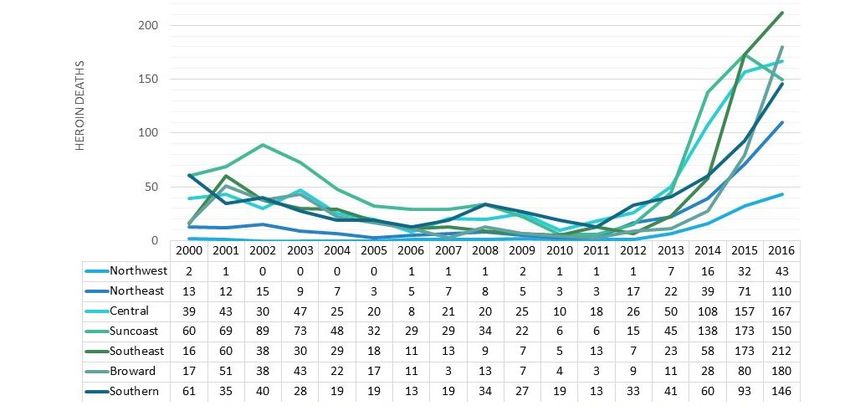
Carfentanil, sold as a large animal tranquilizer, has a potency approximately 10,000 times
that of morphine and 100 times that of fentanyl, with activity in humans starting at about 1
microgram. Even tiny amounts of these fentanyl analogs can be deadly. They are
increasingly detected as adulterants in street heroin or sold as heroin or counterfeit pills.
Fentanyl analogs more recently have been detected as adulterants in cocaine. The Drug
Enforcement Administration’s Intelligence Brief of August 2017 said, “Columbian coca
cultivation and cocaine production in 2016 reached the highest levels ever observed.” It
also said that national data showed “the most significant increase in domestic cocaine
usage since at least 2009” and that trend “is likely to amplify through at least 2018.” In
Florida, the Medical Examiners Report released in 2017 found that cocaine-caused deaths
increased by 83% in 2016, faster than in previous years.

                                             4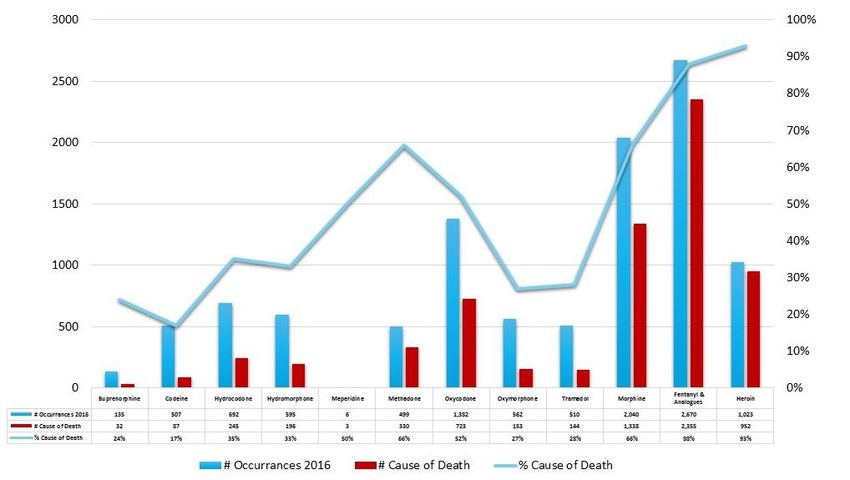
Report Highlights

   o Continuing declines in underage alcohol use are confirmed by multiple surveys
     across all regions of Florida over the past decade. (National Survey on Drug Use
     and Health, Youth Risk Behavior Surveillance System, Florida Youth Substance
     Abuse Survey).

   o One in five Florida high school students who reported any alcohol use in the past
     month also reported binge drinking in the past two weeks and roughly one of every
     8 high school students reported at least one occasion of drinking that led to blacking
     out. (Florida Youth Substance Abuse Survey)

   o More than twice as many Florida students report current use of e-cigarettes rather
     than smoking tobacco cigarettes. Use of tobacco cigarettes has reached historic
     low levels. (Florida Youth Substance Abuse Survey)

   o Alcohol was found to be present in 44% of all drug-related deaths in Florida in
     2016. It was determined to be a cause of death for 18% of the decedents in which
     it was detected. (Florida Medical Examiners Commission 2017 report)

   o Vaporizing devices such as e-cigarettes are increasingly reported for use of
     marijuana, methamphetamine, and novel psychoactive substances. (Varlet in
     Toxics, 2016)

   o There was an 80% increase in the number of fentanyl-related deaths between
     2015 (n=911) and 2016 (n=1,644). In 2016 the Medical Examiners began
     employing a separate category for fentanyl analogs. These mostly illicit analogs
     were involved in another 1,026 deaths. Fentanyl and its analogs fueled the
     dramatic escalation of deaths related to Florida’s opiate epidemic in 2016. (Florida
     Medical Examiners Commission 2017 report)

   o Heroin deaths escalated dramatically across Florida in 2016, totaling 1,023. That
     was more than five times as many as the 199 heroin deaths in 2013 when the rapid
     rise in such deaths began. The 2016 heroin death total was almost 18 times as that
     reported in 2011 (n=57). (Florida Medical Examiners Commission 2017 report)

   o Nearly half of Florida’s heroin decedents in 2016 were below the age of 35, but
     only two individuals were under the age of 18. (Florida Medical Examiners
     Commission 2017 report)

   o Cocaine deaths also increased at a faster rate in 2016 than in previous years.
     Among the 2,882 cocaine-related deaths, cocaine was identified as a cause of
     death in 61% (n=1,769). (Florida Medical Examiners Commission 2017 report)

   o Methamphetamine-related deaths increased dramatically in Florida in 2016.
     There were 305 such deaths in 2015. In 2016, there were 621 such deaths, more

                                            5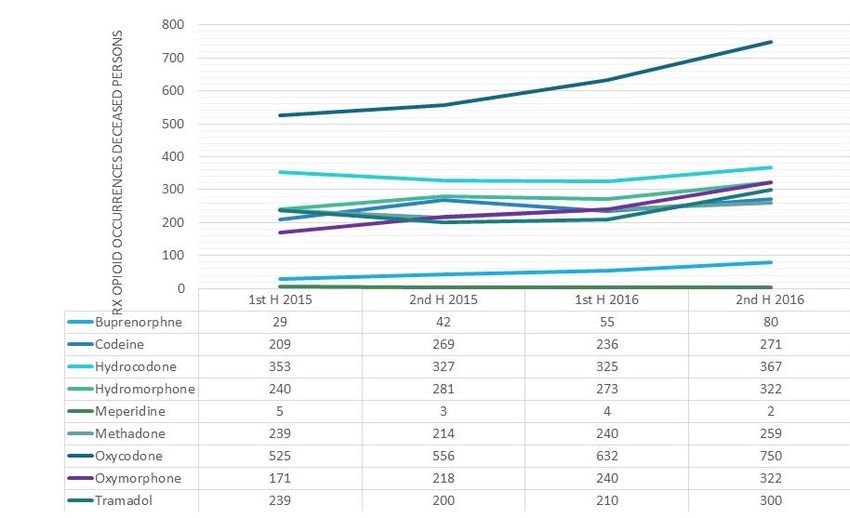
than five times as many deaths as occurred in 2011. (Florida Medical Examiners
   Commission 2017 report)

o While there are some variations, most patterns and trends of substance abuse
  continue to be relatively similar within and across the seven managing entity regions
  of Florida. (Florida Youth Substance Abuse Survey, Florida Medical Examiners
  Commission 2017 report)

                                         6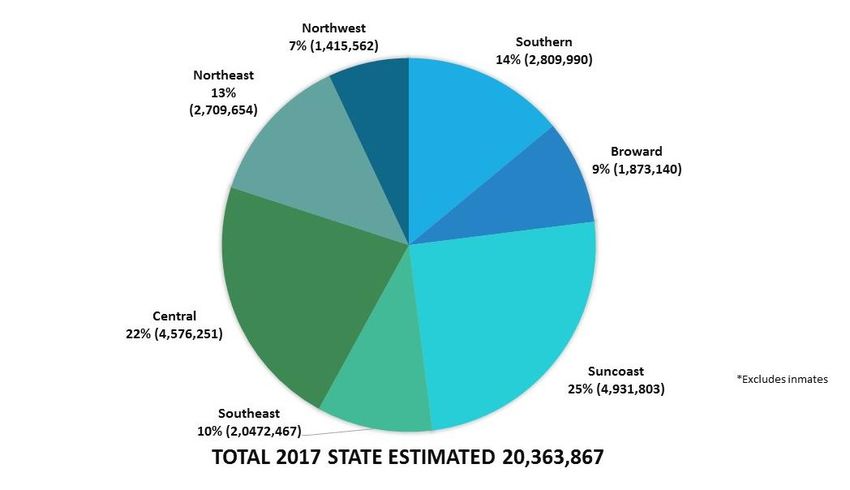
Florida’s Managing Entity Regions

The total population of Florida as of April 1, 2017 was estimated to be 20,484,142, an
increase of 1,682,810 from the 2010 census. Population estimates in this report are based
on the Bureau of Economic and Business Research (BEBR) estimates published in
December 2017.

The Department of Children and Families provides behavioral health services to Florida’s
diverse population through its seven Managing Entities shown on Figure 1 below. When
possible, data in this report have been broken down into these same seven geographical
regions. Some data is reported based on judicial circuits. There are 20 judicial circuits in
Florida.

      Figure 1 - Florida's managing entities by region

                                                   7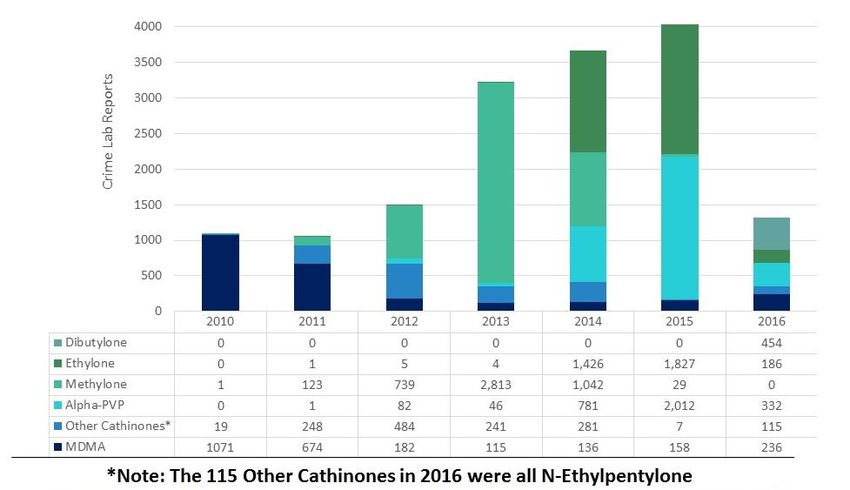
Florida’s Managing Entity Regions with counties and judicial circuits

Northwest Region: Bay, Calhoun, Escambia, Franklin, Gadsden, Gulf, Holmes, Jackson,
Jefferson, Leon, Liberty, Madison, Okaloosa, Santa Rosa, Taylor, Wakulla, Walton, and
Washington Counties

Northeast Region: Alachua, Baker, Bradford, Citrus, Clay, Columbia, Dixie, Duval,
Flagler, Gilchrist, Hamilton, Hernando, Lafayette, Lake, Levy, Marion, Nassau, Putnam,
St. Johns, Sumter, Suwannee, Union and Volusia Counties

Central Region: Brevard, Orange, Osceola, and Seminole Counties

Suncoast Region: Charlotte, Collier, DeSoto, Glades, Hardee, Hendry, Highlands,
Hillsborough, Lee, Manatee, Pasco, Pinellas, Polk, and Sarasota Counties

Southeast Region: Indian River, Martin, Okeechobee, Palm Beach, and St. Lucie
Counties

Broward Region: Broward County

Southern Region: Miami-Dade and Monroe Counties

        Figure 2 - 2017 Estimated Total Populations in Florida's DCF Regions
                   December 2017 - Bureau of Economic and Business Research

                                               8
SECTION II. PATTERNS AND TRENDS OF SUBSTANCE USE
Alcohol
The two areas of concern as it relates to alcohol consumption are underage drinking and
problematic adult drinking.
Underage Alcohol Use
As depicted in Figure 3, the National Survey on Drug Use and Health (NSDUH) reports
decrease in alcohol use in the past month between 2014-15 and 2015-16 for all age groups
but this change was statistically significant for the middle and high school age Floridians
(ages 12-17). Reported use in this age group dropped from 10.72% to 9.15% between
the two surveys.
Figure 3 - Florida alcohol use in the past month by age group for 2014-2015 and 2015-2016
National Survey on Drug Use and Health (NSDUH) Comparison of 2014-2015 and 2015-2016
Figure 4 depicts when the survey data specified the age group as 12-20. No significant
change was reported with one in five reporting past 30-day alcohol use.
Figure 4 - Florida alcohol use in the past month among individuals age 12 to 20
National Survey on Drug Use and Health (NSDUH) Comparison of 2014-2015 and 2015-2016
9Various years of the same survey revealed reductions in any current alcohol use and binge
drinking since 2002 among national and Florida youth. The declining trend lines of
underage drinking rates for both the state and nation parallel one another closely.
The continuing decline in the prevalence of underage alcohol use particularly among the
12-17 age group is among the most positive outcomes of this report. As reflected in Figure
5, the findings of the National Survey on Drug Use and Health are consistent with the
Youth Risk Behavior Surveillance System Survey (YRBSS) and the Florida Youth
Substance Abuse Survey (FYSAS).
Figure 5 compares findings from the YRBSS, conducted statewide among high school
students in odd-numbered years, with those of the FYSAS for Florida middle and high
school students. The most recent published YRBSS data are for 2015, with 2017 data
expected to be published in spring 2018.
Figure 5 - Comparison of alcohol use and binge drinking among Florida high school students
Youth Risk Behavioral Surveillance Survey (YRBSS) and Florida Youth Substance Abuse Survey (FYSAS)
The FYSAS data are collected to be representative at the county level in even-numbered
years. A smaller sample provides state-level estimates for middle school and for high
school in odd-numbered years. Statewide FYSAS data shows a continuing decline in both
current use and binge drinking from 2016 to 2017.
10The declining trends in any current underage alcohol use and binge drinking within the
past two weeks, are also observed in rates for middle school students in the FYSAS
(Figure 6).
Figure 6 - Any current alcohol use and binge drinking among Florida middle school students 2004-2017
Florida Youth Substance Abuse Surveys 2000-2017
As depicted in Figure 6, the 2017 FYSAS reveals the downward trends in alcohol
consumption for middle and high school students. Of the middle school students surveyed,
7.3% reported some current alcohol use. This is a decline of almost 12 percentage points
from 2006 when 19% of middle schoolers reported such use. The 2017 survey also
reflects a decrease in binge drinking reported by middle schoolers. In the 2017 survey,
2.7% of middle school students reported binge drinking while 8.4% of middle schoolers
reported such use in 2006.
The percentage of Florida high school students reporting in the FYSAS survey that daily
use of alcohol presents a “great risk of harm” has increased slightly from 38% in 2002 to
44% in 2017. In the same survey, the percentage of Florida high school students
disapproving of underage alcohol use who responded that it was “wrong” or “very wrong”
for someone their age to drink alcohol regularly increased from 51% in 2004 to 64% in
2017.
FYSAS 2016 data, the most recent for which county estimates were available, showed
underage alcohol prevalence rates were relatively consistent across the seven managing
entity regions of the state as shown in Figures 7 and 8. The Central Region has the lowest
rates for both middle and high school students reporting binge drinking on at least one
occasion in the past two weeks.
11Figure 7 - Current alcohol use in the past 30 days among Florida middle and high school students by
Managing Entity regions
2016 Florida Youth Substance Abuse Survey
Figure 8 - Percent of Florida middle and high school students reporting binge alcohol drinking on at least
one occasion in the past two weeks by Managing Entity regions
2016 Florida Youth Substance Abuse Survey
Excessive drinking by underaged Floridians remains a serious concern. In the 2017
FYSAS, about one in five Florida high school students who reported any alcohol use in
the past month also reported binge drinking in the past two weeks. About one in eight high
school students reported at least one occasion of drinking that led to their blacking out.
12Figure 9 shows the percentages of Florida middle and high school students who reported
having had their first drink of alcohol (defined as more than a sip or two) by age 13 or
younger according to 2016 FYSAS data. About one in five students admitted to early
initiation of alcohol across the seven managing entity regions of the state. This applies to
both middle and high school students.
Figure 9 - Percent of Florida middle and high school students reported having first drink of alcohol by 13 or
younger by Managing Entity regions
2016 Florida Youth Substance Abuse Survey
Most underage drinking appears to occur in homes. Of the students surveyed by FYSAS
in 2016, 78.2% said that they consumed the alcohol in their home or a friend’s home.
Adult Problematic Alcohol Use
As depicted in Figure 10, most (52.7%) surveyed adults in Florida reported in the 2016
BRFSS surveys that they had consumed one or more alcoholic drinks during the preceding
30 days. This included 59% of men and 46.9% of women.
Figure 10 - Florida adults who have had at least one drink of alcohol within the past 30 days
Behavior Risk Factor Surveillance System (BRFSS)
13Of these drinkers, a subset engages in binge drinking, a drinking behavior that is
problematic due to its association with many health problems including cancers, sexually
transmitted diseases and unintentional injuries such as car crashes (Centers for Disease
Control and Prevention). The 2014-15 Projections of the National Survey on Drug Use
and Health (NSDUH) estimated that 3,269,335 or 22.5% of adult Floridians age 21 and
over engaged in binge alcohol use. Such use was defined as having had five or more
drinks at the same time or within a couple of hours of each other on at least one day in the
past 30 days. Using a slightly different definition of binge drinking (four drinks in one sitting
for women), the Behavioral Risk Factor Surveillance System (BRFSS) implemented by the
Centers for Disease Control and Prevention estimated 2016 binge drinking for the age 18
and overpopulation of Florida at 15.5% (20.1% of men versus 11.3% of women). This is
illustrated in Figure 11.
Figure 11 - Florida adults who have engaged in binge drinking on at least one occasion in the last month
Behavior Risk Factor Surveillance System (BRFSS)
BRFSS also provides estimates of the economic cost to each state of this excessive
drinking. These costs result from losses in workplace productivity (72% of the total cost),
health care expenses (11%), and other costs due to a combination of criminal justice
expenses, motor vehicle crash costs, and property damage. The estimate for Florida is a
staggering $15.3 billion or $815 per capita. About 6% of Floridians age 18 and older were
classified by the 2016 NSDUH as having “Alcohol Use Disorder” as defined by the 4th
edition of the Diagnostic and Statistical Manual of Mental Disorders (DSM-IV).
The most recent substate data shows that the highest rate of past year alcohol
dependence or abuse in Florida was 7.48% in the area that includes Circuit Two
(Gadsden, Leon, Jefferson, Liberty, Wakulla, Franklin Counties, and Madison and Taylor
Counties of the Northwestern Management Region. The lowest Florida rate was 5.01% for
the Southern Managing Entity Region (Miami-Dade and Monroe Counties). In the same
data report, NSDUH estimated that 973,020 or 5.85% of Floridians age 12 and above
needed but did not receive treatment for alcohol problems in the past year. The highest
rate of alcohol treatment need was 7.18% in the Northwestern Managing Entity Region.
The lowest Florida rate was 5.02% in the Suncoast Managing Entity Region.
14The Florida Medical Examiners Commission reported that in 2016 there were 5,218
occurrences of ethanol alcohol detected among the 11,910 deaths in Florida in which a
drug was determined through postmortem toxicology tests to be present at the time of
death. In other words, alcohol was detected as being present in 44% of all drug-related
deaths in Florida. The number of alcohol occurrences in 2016 represented a 22.2%
increase over the 4,270 such occurrences in 2014 and an 11.7% increase over 2015. Of
the 2016 ethanol cases, 948 or 18% were deaths considered to be caused by alcohol.
This was an increase of 138 deaths caused by alcohol compared to 2015 and represented
376 more deaths than were reported caused by alcohol in 2010, an increase of 66% in
deaths classified as caused by alcohol during this time.
According to the Florida Uniform Crime Reports, there were 35,042 arrests in Florida for
Driving Under the Influence (DUI) during 2016 representing a 10.2% increase over the
31,784 arrests in 2015, but nevertheless lower than the 42,745 such arrests in 2014. The
substances involved in the DUI arrest are not specified but most are for alcohol
intoxication. The reports said the following: Judicial Circuit 13 (Hillsborough County) had
the most DUI arrests in 2016 with 4,196 up substantially from 3,103 in 2015. The fewest
number of 2015 DUI arrests was in Circuit 3 (Madison and Taylor Counties) with 351
arrests, up from 2015 but below their 2014 total of 397. Year to year changes in DUI
arrests are thought to be in part due to temporal changes in enforcement activity. The
number of DUI arrests in other Florida Judicial Circuits may be found in an Appendix to
this report from the Florida Department of Law Enforcement Uniform Crime Report
databank.
Tobacco
The most significant decline in adolescent drug use nationally and in Florida has been the
dramatic reduction in reporting of past 30-day use of cigarettes. National Institute on Drug
Abuse’s Monitoring the Future survey that was released in 2017 shows that nationally
each of the age groups that it follows has posted dramatic declines over the past two
decades. In Florida, past 30-day use of cigarettes has declined from 14.1% of high school
students in 2006 to 3.7% in 2017 according to the Florida Youth Substance Abuse Survey
(FYSAS) as shown in Figure 12. The 2017 FYSAS rate of 30-day cigarette use for middle
school students was 1.2%, down 68% from 6.0% in 2006. Data from the Florida
Department of Health’s 2016 Florida Youth Tobacco Survey show a slightly higher
percentage of use than the FYSAS with 6.2% of high school students and 2.3% of middle
school students reporting smoking one or more cigarettes in the past 30 days. Both
surveys show similar patterns of declining use.
15Figure 12 - Current cigarette use among Florida middle and high school students
2006-2017 Florida Youth Substance Abuse Surveys
For 2016, when county-level data were available, the prevalence rates of current cigarette
use varied across the seven managing entity regions as shown in Figure 13. The 2016
FYSAS highest rate of cigarette smoking was 7.46% among Northwest Region high school
students with the lowest rate reported by Central Region high school students at 2.87%.
The Northwest Region also had the highest middle school rate of cigarette use, 2.24% as
compared to a low of 0.75% among the Broward Region middle schoolers. When
reviewing the differences among the regions, it is important to consider the difference in
population among them. For example, the Northwest region is mostly rural while the
Broward region has high population density. The Northwest Region also is less populated
than other Florida regions.
Figure 13 - Current cigarette use among Florida middle and high school students by Managing Entity regions
2016 Florida Youth Substance Abuse Surveys
16Paralleling the reduction in youth tobacco use, the adult tobacco use reported in BRFSS
surveys has dropped from 19.3% in 2011 to 15.5% in 2016. The 2016 percentage reflects
tobacco use being reported by 17.8% of males and 13.3% of females. In 2016 the lowest
adult prevalence was in persons aged 65 and over (8.4%) followed closely by the 18-24
age group (11.2%) with other age groups roughly twice as likely to be current smokers.
Electronic Vaporizers
In 2016 new questions about the use of e-cigarettes and other vaporizing alternatives to
cigarette smoking were added to the FYSAS. Approximately one in four students surveyed
in 2017 reported lifetime use of these products. About one in eight Florida middle school
students and nearly one of three high school students reported one or more uses in their
lifetime. Thirty-day prevalence rates were lower with 4.3% of middle schoolers and 10.1%
of high school students reporting such use. Both rates of use were notably higher
proportions than those for cigarette smoking. Perhaps the most positive finding is that 30-
day use of electronic vaporizers among all students dropped from 9.6% in 2016 to 7.7%
in 2017. That reflects a reduction from 5.1% to 4.3% for middle schoolers and from 31.5%
to 10.1% for high schoolers. Figure 14 shows the proportion of Florida middle and high
school students in each managing entity region who reported past 30-day use of e-
cigarettes in the 2016 FYSAS. County-level estimates for regional comparisons will be
collected and updated in the 2018 FYSAS.
Figure 14 - Current E-cigarette or vaporizer use among Florida middle and high school students by
Managing Entity regions
2016 Florida Youth Substance Abuse Surveys
Adult use of e-cigarettes as reported in the 2016 BRFSS survey showed that use of e-
cigarettes decreased as the age of the adults surveyed increased. Of the 18-24 age group,
179.8% reported current e-cigarette use. By comparison, 1.4% of the 65 and over age group.
BRFSS reports age in six categories. Each ascending category reported a current use rate
that was lower than the next younger category. It will be important in the future to assess
whether this is an age effect or whether this represents a cohort effect in which a relatively
new product will continue to be used at a higher rate by the current young adult population
as they age.
Concerns have been expressed about the negative health effects of e-cigarettes and other
vaporizing products. Clinical studies about the safety and efficacy of these products have
not been submitted to the Food and Drug Administration (FDA) for the over 400 brands of
electronic smoking devices that are on the market. Consequently, consumers have no
way of knowing whether electronic smoking devices are safe or what potentially harmful
chemicals the products contain. While we await better data on the long-term effects of
“vaping” it is prudent to discourage use, especially among teens.
Marijuana
The FYSAS reveals that marijuana use among Florida high school students remained
relatively stable from 2004 to 2008 prior to increasing and peaking in 2010 – 2014. In the
past three years, marijuana use has declined to levels comparable to the pre-2010 period.
As shown in Figure 15, marijuana use among Florida middle school students peaked in
2010 and has since decreased to the lowest level measured in FYSAS surveys.
According to the 2017 FYSAS, 23.5% of high school students and 52.6% of middle school
students report that the regular use of marijuana presents a “great risk of harm”. These
percentages changed little since 2016. However, both are down markedly from FYSAS
data reported a decade ago, probably reflecting broader societal attitude changes.
Students responding that it was “wrong” or “very wrong” for someone their age to smoke
marijuana once or twice a week totaled 61.2% among high school students and 89.3% of
middle schoolers.
Figure 15 - Current marijuana use among Florida middle and high school students
2004-2017 Florida Youth Substance Abuse Surveys
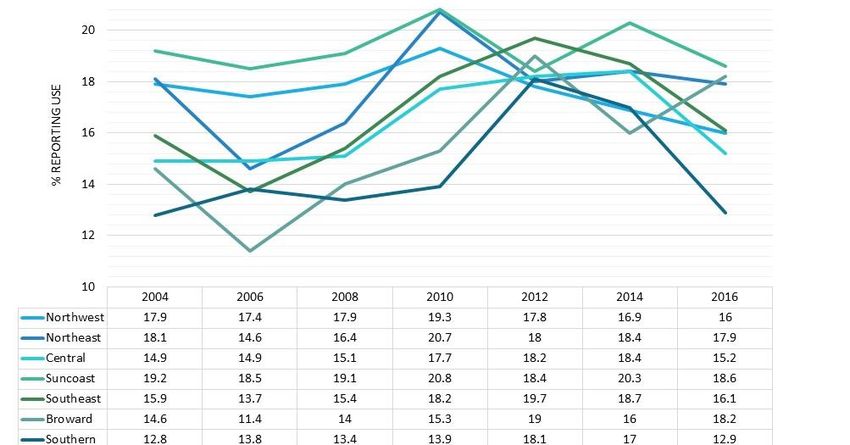
18Past decade trends in FYSAS marijuana prevalence rates based on the 2016 FYSAS are
shown in Figures 15 and 16 for each of the seven entity regions of the state. Increases in
marijuana prevalence rates among Florida students occurred in most managing entity
regions from 2006 to 2010 or 2012 before declining by 2016 across most all regions except
among Broward high school students who reported the lowest rate in 2014.
Figure 16 - Current marijuana use among Florida high school students by Managing Entity regions
2000-2016 Florida Youth Substance Abuse Surveys
Rates of current marijuana use by middle and high school students in 2016 across the
seven managing entity regions are displayed in Figure 17.
Figure 17 - Current marijuana use among Florida middle and high school students by Managing Entity regions
National Survey on Drug Use and Health NSDUH Substate Reports
19Figure 18 reports the percentage of Florida middle and high school students in 2016 who
acknowledged having first used marijuana by age 13 or younger with approximately one
(1) in eight (8) high school students and one (1) in 16 middle schoolers reporting early
initiation of marijuana in the five (5) managing entity regions of the State for which there is
data. Data from Broward and Southern regions was not available.
Figure 18 - Percent of Florida middle and high school students reported having first used marijuana by age 13 by
Managing Entity regions
2016 Florida Youth Substance Abuse Surveys
The trends shown in the FYSAS data are consistent with data from the Youth Risk
Behavior Surveillance System Survey (YRBSS) among Florida high school students from
2003 until 20017. Figure 19 compares findings from the YRBSS which is conducted
statewide among high school students in odd-numbered years with those of the FYSAS
for Florida high school students that is conducted in even-numbered years. While the
prevalence rates are consistently higher in the YRBS findings, both surveys identified the
rise in adolescent marijuana use around 2009 and 2010 with a relatively stable use or
even a slight decline in reported use since then.
20Figure 19 - Comparison of current marijuana use among Florida high school students
Youth Risk Behavioral Surveillance Survey (YRBSS) and Florida Youth Substance Abuse Survey (FYSAS)
The most recent NSDUH substate report showed an estimated 1,204,216 Floridians aged
12 and above (or 7.24%) who were current users of marijuana had used the drug at least
one time in the 30-days prior to taking the Survey (Figure 17). From 2012 to 2014, when
NSDUH collected data on marijuana use by persons aged 12 or over, 7.73% of people
surveyed said they were current users of marijuana. Figure 20 shows statewide national
and Florida trend lines for 30-day marijuana use based on past substate data and recently
published state-level estimates for 2015-16. The slight increase probably reflects a larger
proportion of mid-life and older adults who have begun using marijuana in recent years.
Figure 20 - Percent of any marijuana use in the past 30 days among persons age 12 and above
2015-2016 National Survey on Drug Use and Health (NSDUH) Substate Data – Model-Based Prevalence
21Figure 21 reflects the FYSAS’s findings of synthetic cannabinoid lifetime and past 30-day
prevalence among Florida High School Students from 2011-2017. Lifetime use peaked at
13% in 2012 and declined to 3.5% in 2017. Past 30-day use peaked at 4.3% in 2012 and
declined to .8% in 2017.
Figure 21 - Synthetic cannabinoid prevalence among Florida high school students
2011-2016 Florida Youth Substance Abuse Surveys
The Florida Medical Examiners Commission reported there were 2,292 occurrences of
cannabinoids detected among the 11,910 deaths in Florida during 2016 in which a drug
was determined through postmortem toxicology tests to be present at the time of death.
Thus, cannabinoids were detected as being present in 19.2% of all drug-related deaths in
Florida. The number of occurrences in 2016 represented a 33% increase over the 1,720
cases in 2015 and was more than double the reported figure of 1,092 such occurrences
in 2014. However, the Commission notes that this increase in positive cannabinoid findings
is, at least in part, due to increased surveillance by medical examiner offices and not a
direct reflection of the increased use of cannabis. The Medical Examiners Commission
said that cannabinoids were the cause of death of 8 of the people who died in whom a
drug was determined to be present at the time of death.
While the most prevalent use of vaporizing devices is for liquid nicotine, illicit drugs are
increasingly being vaped including marijuana, methamphetamine, novel psychoactive
substances, as well as crushed and liquefied pharmaceuticals (Varlet in Toxics, 2016). An
advanced vaping delivery system for marijuana wax, (aka, butane hash oil (BHO) or
“budder”) is called dabbing and uses a special water pipe with a metal plate on which the
drug is smeared that can withstand extreme temperatures from a propane torch.
Marijuana wax is produced by soaking leftover marijuana leaves and stems of plants in a
solvent such as butane which extracts various components of the plant including any
number of cannabinoids that are the active drugs in the marijuana. This process extracts
THC from the marijuana in a highly concentrated form that produces a substance that is
highly hallucinogenic. This residue is then allowed to dry, resulting in a sticky paste ranging
in color from brown to dark green or yellow. It can be smeared onto a marijuana joint or
22tobacco cigarette, placed in a water pipe, or most often melted in a vaporizer or electronic
cigarette device. The inhaled wax vapors have a much higher dose level of not only THC
but other cannabis ingredients. Several risks have been identified related to this
substance. Preparation of the wax inherently risks fire and explosion and preparations are
often adulterated with contaminants. Of course, the extreme hallucinogenic nature of the
substance poses a risk to users.
Novel Psychoactive Substances
A critical issue impacting substance abuse in Florida and the U.S. over the past several
years has been the emergence of new synthetic drugs of abuse. These are laboratory
derived chemicals typically designed to mimic drugs of abuse derived from natural
substances such as mushrooms, opium, coca, or the khat plant. They were first detected
in Australia or New Zealand followed by Eastern and then Western Europe around 2006
before arriving in North America about 2010. By 2016 these drugs are reported globally
and found on every continent.
The United Nations and major national government agencies have adopted the term,
“Novel Psychoactive Substances” or NPS, to describe these drugs. Some of these
substances are new. Some may have been around for 20-30 or more years but not used
as drugs of abuse until recently. The term “emerging” is not always appropriate to describe
the problem as these substances often arrive in various locations in different years. Thus,
what may be an emerging drug problem in Florida may have already come and gone in
Great Britain. The classes of Novel Psychoactive Substances include:
Tryptamines
These are typically serotonin-affecting psychedelics/hallucinogens such as LSD, DMT,
and Psilocybin (the active ingredient of psychedelic mushrooms), or 5-MeO-DiPT (“foxy
methoxy”).
Piperazines
These drugs are stimulants such as BZP or TFMPP that were frequently sold as “ecstasy”
up until 2013 and just prior to the appearance of cathinones that were sold as “Molly’s.”
Synthetic Cathinones
These are chemically designed to mimic, but be more potent than, the stimulant in the khat
plant found in East Africa and the Middle East. The first substitute cathinones to appear
were often referred to as “bath salts” and have been banned in the US and many other
nations. The most prevalent substitute cathinones in Florida have been: (1) methylone,
(2) ethylone, and (3) di-butylone which have been sold as “Molly’s” for several years and
(4) alpha-PVP (“flakka”).
The 2016 report, Patterns and Trends of Substance Abuse within and across the Regions
of Florida, said that an epidemic of the synthetic cathinone, alpha-PVP, or “flakka”, erupted
in Southeastern Florida (particularly Broward County) in September of 2014.
23Consequences of its abuse rapidly escalated in 2015 when the drug was linked to 63
deaths in Florida and thousands of hospital emergency cases - many related to excited
delirium syndrome. The 2016 report also indicated the following: Broward County had
more crime lab cases of alpha-PVP than any other county in the nation; Palm Beach
County also experienced “flakka” problems but fewer than Broward County; Miami-Dade
had less alpha-PVP consequences than the two counties to its north but higher levels of
ethylone, sold as “Molly, cases. Sold in quantities as small as 1/10th of a gram and for as
little as $3.00 to $5.00, “flakka” was highly profitable for the dealers whose actual cost was
very low. With a retail price of $5.00, most anyone could afford it, and with it being a highly
addictive drug, repeat business was assured. Thus, low-income communities, the
homeless population, and crack cocaine users were targeted as customers.
On October 1, 2015, the Chinese government banned the production and sale of alpha-
PVP. Since that ban, there appears to have been a reduction in the overall use and harmful
consequences of this substance and of synthetic cathinones statewide.
As Figure 22 depicts, there were 102 cathinone deaths in Florida in 2016 according to the
Medical Examiners Commission Report for that year. This number is down markedly from
the 223 cathinone deaths reported during 2015 and the lowest number since the Medical
Examiners began reporting on these drugs in 2013. Among the 2015 cases, in 49 cases,
or 48%, the Florida Medical Examiners Commission considered the cathinone a cause of
death according to the Florida Medical Examiners Commission Report for that year.
Figure 22 - Synthetic cathinone deaths in Florida
2016 Florida Medical Examiners Commission Final Report
Phenethylamines
This category includes methamphetamine and the drug that is most often called “ecstacy”:
3,4-methylenedioxymethamphetamine (MDMA). Both drugs have been around for
decades. Phenethylamines are also sometimes considered to include substitute
24cathinones which are potent stimulants with varying degrees of hallucinogenic properties
and are discussed separately above.
Across all of Florida, there were 172 Poison Information Center exposure calls for
hallucinogenic amphetamines during 2016 compared to 199 in 2015 and 321 in 2014.
Hallucinogenic amphetamines include drugs sold as “ecstasy” (Substance Use Trends
Data Report Update, 2017)
While apparent reductions in use and harm are encouraging, data from the National
Forensic Laboratory Information System’s Florida crime lab reports that were included in
the Substance Use Trends Data Report Update, 2017 show that street drugs are being
reformulated. This is illustrated in Figure 23. Dibutylone, now sold as “Molly,” is a stimulant
drug of the amphetamine, phenethylamine, and cathinone drug classes. Manufactured in
China, it is structurally related to butylone, a Schedule 1 Controlled Substance, that has
been sold as “bath salts.” Dibutylone is currently marketed on the internet as a “research
chemical.” Continued evolution of drug scheduling by the Drug Enforcement
Administration (DEA) may be necessary to prevent the growth of the use of this drug.
Figure 23 - Breakdown of Synthetic cathinones in Florida crime lab reports 2010 – Mid 2016
2017 Substance Use Trends Data Report Update – US DEA National Forensic Laboratory
System Data Queried May 22, 2017
Synthetic Opioids – Fentanyl Analogs
Fentanyl analogs such as carfentanil are also considered to fit the NPS category. These
drugs, far more powerful and lethal than heroin, have no medical use. Because of their
lethality and prevalence, they are discussed in detail in the opioids section that follows.
25The Opioids
This category of drugs includes those derived directly from opium, often called opiates, (e.g.
morphine, codeine) as well as semi-synthetic drugs such as oxycodone and hydrocodone,
and completely synthetic drugs like fentanyl and its analogs.
According to the Florida Medical Examiners Commission reports, from 2000 to 2010 there
was a dramatic increase in deaths linked to the nonmedical misuse of opioids. As a result,
new laws and regulations took effect beginning in 2010 along with the tamper-resistant
reformulation of high dose extended-release opioids. Actions taken by the State of Florida
to reduce the prescription drug abuse problem included:
• July 2010 - Senate Bill 2272 is passed providing legal authority to close “pill mills”
and limit practitioner direct dispensing of Schedule II opioids to a 3-day supply
• August 2010 - Replacement of crushable high dose OxyContin® with the tamper-
resistant formulation preventing methods to consume the full dose all at once or
inject the drug for a rapid onset of its effects
• March 2011 - Law Enforcement Strike Force created to close “pill mills”
• July 2011 - House Bill 7095 goes into effect banning direct dispensing by
practitioners of Schedule II medications and establishing new regulations for pain
management clinics and pharmacies. It also provided for the startup operation of
the State’s first Prescription Drug Monitoring Program.
The collective impacts of these efforts are reflected in declining prescription opioid deaths
beginning in 2011. At the same time, Florida Medical Examiners Commission reports
show that heroin deaths began to increase sharply from 2012 to 2016 across Florida, rising
nearly 18 times (1,795%) from 57 in 2011 to 1,023 in 2015.
Nonmedical Use of Prescription Opioids
The Florida Medical Examiners Commission reported that in 2010 there were 6,608
opioids (excluding heroin) detected in deceased persons in Florida. Subsequently, the
Florida Medical Examiners Commission indicated that toll steadily declined 23% to 5,085
by 2013, but then increased to 5,624 opioid occurrences in 2014 and 8,572 in 2016 (Figure
24).
26Figure 24 - Number of nonmedical Rx Opioids (excluding fentanyl analogs) occurrences detected among Florida
decedents
2005-2016 FDLE Drugs Identified in Deceased Persons by Florida Medical Examiners Annual Reports
Table 1 shows the number of prescription opioid medical examiner occurrences by
managing entity region for 2016. About three-quarters of occurrences were for traditional
prescription opioids and a quarter for fentanyl. However, the proportion of fentanyl
occurrences was higher in the Northeast Region (one-third) and in the coastal areas of the
Southeastern Region.
Table 1 - Rx Opioid medical examiner occurrences by Florida Managing Entity regions
2016 Florida Medical Examiners Commission Annual Report
Fentanyl Analogs
Among the most lethal opioids currently available are recently introduced analogs of the
pharmaceutical opioid, fentanyl, which are classified as novel psychoactive substances
(NPS). Carfentanil, the best known of these analogs, was originally marketed as a
27tranquilizer for large animals like elephants. It is 100 times as potent as the same amount
of fentanyl, 5,000 times as potent as a unit of heroin and 10,000 times as potent as a unit
of morphine (DEA, 2016). Consequently, exposure to very small amounts is a hazard to
users, but also to first responders and drug detection dogs.
Other fentanyl analogs are now being seen in various formulations from clandestine
laboratories in China, Mexico, Canada and perhaps the United States. The NPS fentanyl
analogs are often used as a booster narcotic adulterant to street heroin or are merely sold
as heroin or found in counterfeit pills and recently have been reported as detected in street
cocaine in Florida. These illicitly manufactured, non-pharmaceutical opiate analogs are
specifically linked to the increasing number of heroin-related deaths in Florida and across
the nation beginning in 2014 and significantly escalating in 2016 and 2017. Toxicology
screening for the presence of these analogs has continued to improve and in 2016 the
Florida Medical Examiners Commission Report added a separate category for fentanyl
analogs, which appeared more frequently than heroin. Nevertheless, some experts have
expressed concern that occasionally these analogs may not be recognized as the cause
of death when mixed with heroin because the lethal dose is so minute and toxicology
screens may not always detect them.
According to the Florida Medical Examiners Commission, every category of opioids
showed an increased presence in occurrences in deaths from 2015 to 2016. The 2016
Florida Medical Examiners Commission Report added a new category for fentanyl analogs
- accounting for 1,026 additional occurrences of deaths. Because they have no medical
use, these NPS fentanyl analogs, to some extent, occupy a status closer to heroin than to
prescription opioids. When added to the 8,572 cases of prescription opioid occurrences,
the number jumps to 9,598 as shown in Figure 25. Finally, heroin accounted for 1,023
death occurrences in 2016 bringing total opioid/opiate death occurrences to 10,621 for
that year (Florida Medical Examiners Commission Report released in 2017). Excluding
deaths and occurrences from heroin and fentanyl analogs, over half or 4,641 of the 8,572
prescription opioid occurrences among decedents in 2016 were considered by the Florida
Medical Examiners Commission to be “a cause of death.”
28Figure 25 - Nonmedical Rx Opioids (including fentanyl analogs) occurrences detected among decedents in Florida
2005-2016 FDLE Drugs Identified in Deceased Persons by Florida Medical Examiners Annual Reports
Heroin
The Florida Medical Examiners Commission reported that there were 1,023 heroin-related
deaths across Florida in 2016 representing a 31% increase over the 779 such deaths in
2015 and a 228% increase over the 447 such deaths in 2014. This reflects nearly 18 times
as many heroin-related deaths compared to 57 heroin deaths statewide in 2011. This
dramatic rate of increase began in 2014 and showed no sign of abating as of the end of
2016. (Figure 26). Heroin was considered the cause of death in 93% of the 2016 heroin
deaths (n=952), and at least one other drug was detected in all but 13 (or 98.7%) of the
heroin decedents.
Figure 26 - Heroin related deaths in Florida
2016 Florida Medical Examiners Commission Annual Report
29Nearly half (47%) of the heroin deaths occurred among those below the age of 35 but only
two such deaths occurred among persons under the age of 18. National studies reveal
the rapid growth of new heroin users is occurring among young adults 18-34 years of age
with most being addicted to a prescription opioid prior to initiation of heroin use (National
Institute on Drug Abuse, 2018).
Heroin has been a statewide issue since 2013, according to the Florida Medical Examiners
Commission. Deaths in the seven managing entity regions, as tracked in Figure 27 and
Table 2, parallel the overall state trend with a rapid increase in every region since that
time. Only Florida’s Suncoast region showed a decrease between 2015 and 2016.
Figure 27 - Heroin related deaths by Florida Managing Entity regions
2016 FDLE Drugs Identified in Deceased Persons by Florida Medical Examiners Annual Report
Table 2 - Number of heroin-related deaths by Florida Managing Entity regions
2016 FDLE – Drugs Identified in Deceased Persons by Florida Medical Examiners Annual Report
30The Florida Medical Examiners Commission notes that heroin rapidly metabolizes to
morphine in the body and that it is possible that some or even many of the 1,338 morphine
deaths in 2016 may be related to heroin abuse. The numbers of deaths attributed to
morphine rose steadily in recent years but have declined while heroin, fentanyl, and
fentanyl analog deaths have escalated. It is not known how many of the heroin deaths
also had a fentanyl analog present.
Figure 28 shows the number of lethal opioid occurrences over time from 2008 to 2016.
Particularly striking is the advent and rapid rise of fentanyl as a cause of death starting in
2014. While there has been some increase in deaths caused by morphine or oxycodone
in the last three years, the rapid emergence of fentanyl clearly is the major story. This is
mirrored in Table 3 which shows the increase in numbers of deaths for various opioids
during 2015 and 2016 (Florida Medical Examiners Commission).
Figure 28 - Number of selected lethal opioid occurrences among deceased persons in Florida
Jan 2008 -Dec 2016 FDLE – Drugs Identified in Deceased Persons by Florida Medical Examiners
Annual Reports
31Table 3 - Increase in deaths with occurrences of various opiates
2016 FDLE Florida Medical Examiners Commission
In contrast to this rapid rise in deaths from fentanyl, Figure 29 shows only modest changes
in opioid occurrences among deceased persons for most common prescription opiates
during 2015-2016. Only oxycodone shows a substantial increase in occurrences during
this time.
Figure 29 Selected Rx opioid occurrences among deceased persons in Florida 2015-2016
2016 FDLE Florida Medical Examiners Commission
32Finally, Figure 30 shows the varying lethality of common opioids. While heroin is most
likely to be a cause of death when it is present, the most lethal drugs are fentanyl and its
analogs which combine wide exposure to the drugs with a high likelihood of being the
cause of death.
Figure 30 - Opioid occurrences, number and percent as cause of death among deceased persons in Florida
2016 FDLE Florida Medical Examiners Commission
The sharp escalation in heroin deaths in Florida, the rapid rise of deaths from fentanyl
analogs, and a rebound in the levels of prescription opioid indicators in the past two years
point to the presence of an ongoing opioid problem in the state.
Cocaine
The NSDUH reports a statistically significant decrease in yearly cocaine use among
Floridians from 2014-15 (1.90%) to 2015-16 (1.63%) as compared to a moderate increase
of 1.76% in 2014-15 and 1.84% in 2015-16 nationally. The 2017 FYSAS reported that
0.3% of middle school students and 0.6% of high school students reported current cocaine
or crack use within the last 30-days. Despite these relatively low estimates of the
prevalence of use, this drug causes great harm to many of its users.
As reflected in Figure 31’s representation of Florida Medical Examiners Commission data
reported in 2017, the relatively steady decline in Florida cocaine deaths from 2007 to 2010
stabilized through 2012 and has increased since then with a particularly abrupt increase
from 2015 to 2016. Cocaine-related deaths increased from 2015 to 2016 in all managing
entity regions of Florida except for the Northwest Region. This increase may be linked to
33poly-drug use particularly with opioids. Cocaine laced with deadly fentanyl analogs was
identified in Florida in 2016 and has become more prevalent in the past year. There were
2,882 cocaine-related deaths in Florida in 2016, an increase of over 1,000 deaths from the
preceding year. (Figure 31).
Figure 31 - Number of cocaine deaths in Florida
2016 Florida Medical Examiners Commission Annual Report
According to the Florida Medical Examiners Commission 2016 Report, cocaine was
considered the cause of death in 39% of the 2016 cocaine deaths (n=1,113), and at least
one other drug was detected in 87% of the cocaine decedents. Nearly two-thirds of the
cocaine deaths (62%) occurred among those aged 35 and older; less than 1% (n=19) of
the 2016 cocaine decedents were under 18 years of age; 11% were aged 18-25; 26%
were 26-34; 37% were 35-50; and 25% were over 50 years of age (Florida Medical
Examiners Commission).
Cocaine deaths in the seven managing entity regions, as tracked in Figure 32 and Table
4, parallel the overall state trend (Figure 31 above) with only the Northwest Managing
Entity Region currently showing a downward trend since 2007.
34Table 4 - Number of cocaine-related deaths by Florida Managing Entity regions
2016 Florida Medical Examiners Commission Annual Report
Figure 32 - Cocaine deaths in Florida by Managing Entity regions
2016 Florida Medical Examiners Commission Annual Report
According to the 2017 Substance Use Trends Data Report Update, primary addiction
treatment admissions for cocaine totaled 6,640 patients in Florida during 2016 - accounting
for 7% of all admissions. Of those admissions, males accounted for 52% of these clients
with crack cocaine specified by 59% of all the cocaine patients. Fifty-two or 1% of the
admissions were for someone under 18 years of age, 13% were 18-25, 30% were 26-34
and 57% were age 35 or older. Smoking cocaine was the route of administration reported
by 52% of the cocaine clients with intranasal sniffing cited by 34% and 4% reported
injecting cocaine. The remaining 10% reported oral or other or unknown routes of
administration.
35There were 17,960 cocaine Crime Laboratory reports or 33% of the 53,777-total primary,
secondary, and tertiary National Forensic Laboratory Information System (NFLIS) reports
for Florida in 2016 (2017 Substance Use Trends Data Report Update). Cocaine ranked
first among all substances analyzed by the NFLIS.
Methamphetamine
It is suspected that most methamphetamine is now produced in Mexico. In Florida, the
Florida Medical Examiners Commission has found that indicators of methamphetamine
have been steadily increasing since 2011 with deaths related to the drug escalating 540%
over the past six years (Figure 33). Indeed, the Commission found that methamphetamine-
related deaths increased more rapidly than expected between 2015 and 2016, more than
doubling from 305 in 2015 to 621 in 2016. Florida Medical Examiners considered
methamphetamine the cause of death in 53% (n=327) of the 621 cases in 2016. A breakout
of methamphetamine-related deaths by counties or state managing entity regions is not
available (Florida Medical Examiners Commission Report released in 2017).
Figure 33 - Number of methamphetamine-related deaths in Florida
Jan 2004 – Jun 2016 Florida Medical Examiners Commission Reports
The Florida Medical Examiners Commission said there were also 640 reports of
amphetamines detected among decedents across Florida in 2016 which was a 65% increase
from the 387 such occurrences in 2015. Amphetamine was considered the cause of death
in 199 (or 31%) of the cases in 2016 (Florida Medical Examiners Commission Report
released in 2017).
36Nonmedical Use of Prescription Benzodiazepines
Benzodiazepines, in general, and specifically alprazolam (Xanax®), continues as a
substantial problem across Florida, particularly when used non-medically in combination
with other pharmaceuticals, alcohol, and illicit drugs. Figure 34, which contains data from
Florida Medical Examiners Commission reports from January 2004 to June 2016, illustrates
this growth. There were 5,167 reports of a benzodiazepine present in deceased persons
across Florida in 2016 - a 12% increase above the 4,604 benzodiazepine occurrences in
2015. Benzodiazepine-related deaths peaked at 6,188 in 2010 and then declined as the
State’s efforts to reduce diversion of controlled medications took effect but appear to be on
the increase based on reports over the past two years.
In addition to prescription drugs, nonmedical use includes an unregulated benzodiazepine,
etizolam. This drug is not from a pharmaceutical manufacturer but from clandestine
laboratory production, which first appeared as a drug sold on the internet beginning in 2015.
Of the benzodiazepine occurrences in 2016 reported by Florida Medical Examiners, 27.5%
were considered “a cause of death.” The five benzodiazepines causing the most deaths
were alprazolam (813), diazepam (183), nordiazepam (124), temazepam. (101) and
clonazepam (95). Among these five drugs, alprazolam was much more likely to be listed as
a cause of death (813 deaths of 1851 cases or 43.9%). Among the other four listed above,
the percentage of cases where the drug was listed as a cause of death was much lower.
(diazepam 27.5%, nordiazepam 17.5%, temazepam (19.8%) and clonazepam 17.4%).
(Florida Medical Examiners Commission Report released in 2017)
Figure 34 - Number of nonmedical Rx benzodiazepine reports detected among deceased persons in Florida
2005-2016 FDLE Florida Medical Examiners Commission Annual Reports
Table 5 displays Florida’s death occurrences for alprazolam and diazepam cases for 2016
and the 2015-2016 percentage change in the seven managing entity regions based on
Florida Medical Examiners Commission 2016 Report. Statewide increases in alprazolam
cases seem to be primarily driven by increases in three regions, the Northeast, Southeast,
37You can also read