Long-term records of glacier surface velocities in the Ötztal Alps (Austria)
←
→
Page content transcription
If your browser does not render page correctly, please read the page content below
Earth Syst. Sci. Data, 11, 705–715, 2019
https://doi.org/10.5194/essd-11-705-2019
© Author(s) 2019. This work is distributed under
the Creative Commons Attribution 4.0 License.

           Long-term records of glacier surface velocities in the
                          Ötztal Alps (Austria)
                   Martin Stocker-Waldhuber1,2 , Andrea Fischer1 , Kay Helfricht1 , and Michael Kuhn3
         1 Institute for Interdisciplinary Mountain Research, Austrian Academy of Sciences, 6020 Innsbruck, Austria
        2 Department    of Geography, Physical Geography, Catholic University of Eichstätt-Ingolstadt, 85072 Eichstätt,
                                                           Germany
            3 Institute of Atmospheric and Cryospheric Sciences, University of Innsbruck, 6020 Innsbruck, Austria

                       Correspondence: Martin Stocker-Waldhuber (martin.stocker-waldhuber@oeaw.ac.at)

                                   Received: 4 December 2018 – Discussion started: 8 January 2019
                               Revised: 26 April 2019 – Accepted: 6 May 2019 – Published: 22 May 2019

       Abstract. Climatic forcing affects glacier mass balance, which causes changes in ice flow dynamics and glacier
       length changes on different timescales. Mass balance and length changes are operationally used for glacier
       monitoring, whereas only a few time series of glacier dynamics have been recorded. Here we present a unique
       dataset of yearly averaged ice flow velocity measurements at stakes and stone lines covering more than 100 years
       on Hintereisferner and more than 50 years on Kesselwandferner. Moreover, the dataset contains sub-seasonal
       variations in ice flow from Gepatschferner and Taschachferner covering almost 10 years. The ice flow velocities
       on Hintereisferner and (especially) on Kesselwandferner show great variation between advancing and retreating
       periods, with magnitudes increasing from the stakes at higher elevations to the lower-elevated stakes, making
       ice flow records at ablation stakes a very sensitive indicator of glacier state. Since the end of the latest glacier
       advances from the 1970s to the 1980s, the ice flow velocities have decreased continuously, a strong indicator
       of the negative mass balances of the glaciers in recent decades. The velocity datasets of the four glaciers are
       available at https://doi.org/10.1594/PANGAEA.896741.

1   Introduction                                                    monitoring techniques, the monitoring of horizontal ice flow
                                                                    velocities was already well established for Alpine glaciers.
The fluctuation of glaciers has become an icon of climate           Stone line velocities were recorded at 5 glaciers among 20
change, after Agassiz (1847) hypothesized the theory of             glaciers regularly monitored for length changes in the East-
ice ages, which was then confirmed by Penck and Brück-              ern Alps, for example, at the glaciers of Pasterze (Nico-
ner (1909) and further substantiated with isotope analy-            lussi and Patzelt, 2001), Vernagtferner (Braun et al., 2012)
sis on deep sea sediment and polar ice cores (Hays et               or Hintereisferner (Span et al., 1997), or in the Western
al., 1976; Shackleton, 2000) and the theoretical work by            Alps at Rhône Glacier (Mercanton, 1916; Roethlisberger,
Milankovitch (1920). First monitoring efforts focused on            1963) or Mer de Glace (Berthier and Vincent, 2012). At the
recording the changing positions of glacier termini, start-         glaciers Unteraargletscher and Mer de Glace, ice flow was al-
ing in the 17th century and systematically organized in the         ready being measured during the 1840s (Forbes, 1846; Agas-
late 19th century, for example by the German and Austrian           siz, 1847).
Alpine Club (Fritzsch, 1898; Groß, 2018). In the case of               For Alpine glaciers, monitoring of velocity records re-
catastrophic glacier advances, as reported several times dur-       ceived less attention after the turbulent decades of the First
ing the Little Ice Age, for instance, for Vernagtferner in          and Second World Wars. Development of glaciological pro-
the Ötztal Alps (Nicolussi, 2012), local observers often re-        grammes focused on hydrological programmes and mass
ported the velocity of terminus advances over short peri-           balance programmes, as the understanding of glacier flow
ods. At that stage of development, glaciological theory and

Published by Copernicus Publications.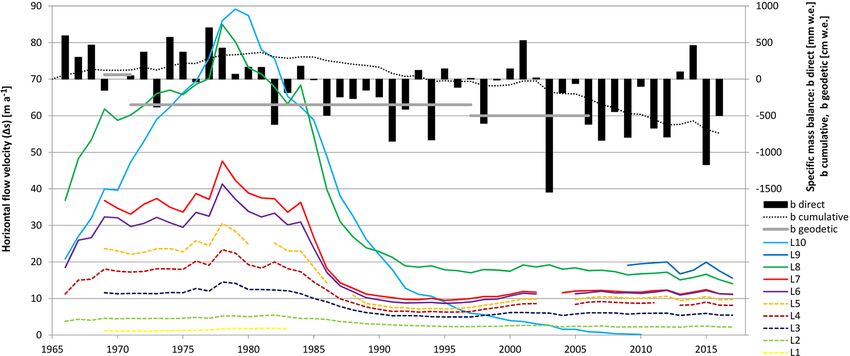
706 M. Stocker-Waldhuber et al.: Glacier surface velocities in the Ötztal Alps
was advanced by deformation measurements on Hintereis-
ferner and in the theoretical work of Finsterwalder (1907)
and Hess (1924).
Estimates of the global glaciers’ contribution to sea level
rise is one of the urgent topics of research (e.g. Jacob et al.,
2012; Zemp et al., 2019), and estimates of the state of re-
gional glacier inventories are needed. Glacier flow veloci-
ties that can be derived from remote-sensing data are an im-
portant parameter that provides essential information on dy-
namic response, which is part of the mass balance evolution
of a glacier. For example, ELA (equilibrium line altitude),
which played a major role in large-scale data collections for
global climate change, has been observed to be above sum-
mits and thus undefined for Eastern Alpine glaciers for much
of the last decade (WGMS, 2017).
In this paper, two long-term series and two series of about
a decade of ice flow velocities are revisited and compared
with classical in situ mass balance measurements (Hoinkes,
1970) and ALS (airborne laser scanning) data (Abermann
et al., 2010). On these four glaciers, ice flow velocities are
measured in situ at stone lines (horizontal velocities) or at
stakes (3-D velocities). The stones and stakes are annually
relocated to their original position. Long-term velocity data
are recorded annually, shorter time series also reveal seasonal
variabilities. The four glaciers are also part of a network
of long-term measurements of glacier fluctuations (Groß,
2018); area and volume change have been recorded in in-
ventories from the LIA (Little Ice Age) maximum onwards
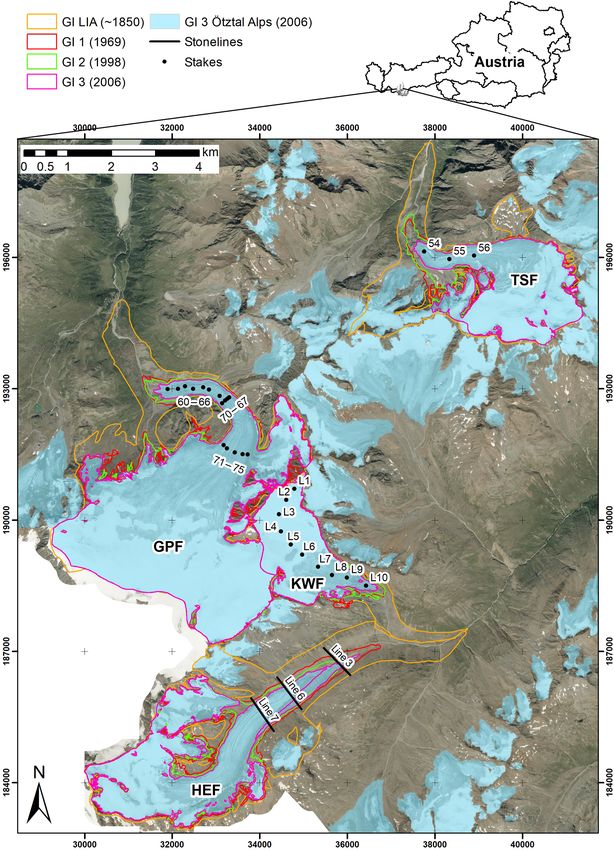
(Patzelt, 1980; Groß, 1987; Kuhn et al., 2012; Fischer et Figure 1. Location of the stone lines (3, 6 and 7) on Hintereisferner
al., 2015). (HEF) and stakes on Kesselwandferner (KWF), Taschachferner
This paper presents ice flow velocity records on well- (TSF) and Gepatschferner (GPF). On Gepatschferner, stakes 60 to
investigated mountain glaciers and their relation to other in 66 are longitudinal stakes from the glacier snout upwards to the
situ monitoring parameters. These data can be used for val- first cross-profile including the stakes 67 to 70 (from the orographic
idation of numerical ice flow models and further research right to the left). Stakes 71 to 75 are located in a cross-profile at the
on ice flow velocity as a monitoring parameter and climate root zone of the tongue. The glacier area was taken from the Aus-
proxy on various scales. trian Glacier Inventories (GI) from the LIA (Little Ice Age) around
1850, GI1 from 1969, GI2 from 1998 and GI3 from 2006 (Fischer
et al., 2015). Background: orthophoto from 2015; data source: Land
Tirol – https://www.tirol.gv.at/data/.
2 Glacier sites and data
The ice flow velocities have been recorded on four of the
largest glaciers in the Ötztal Alps (Austria). Hintereisferner Records at Line 6 were started in 1932/33 and at Line 7 in
(HEF), Kesselwandferner (KWF), Gepatschferner (GPF) and 2013/14. In situ mass balances have been measured since
Taschachferner (TSF) are neighbouring glaciers (Fig. 1) dif- 1952 (Hoinkes, 1970; Fischer, 2010; Fischer et al., 2013;
fering in size, aspect and elevation range (Table 1). Strasser et al., 2018).
HEF, a typical valley glacier, has a long tradition of hydro- The investigations on KWF are historically linked to those
logical, meteorological, geophysical and glaciological inves- on HEF (e.g. Kuhn et al., 1985) with the same long-term in-
tigations (e.g. Blümcke und Hess, 1899; Förtsch and Vidal, vestigations of length variations since 1884 and mass bal-
1956; Hoinkes and Steinacker, 1975; Kuhn et al., 1999; Fis- ances since 1952 (Fischer et al., 2014). The terminus of KWF
cher, 2010; Helfricht et al., 2014; Strasser et al., 2018). Ice detached from the tongue of HEF in 1914. KWF is a plateau
flow velocities on HEF have been sporadically but almost an- glacier and covers a small elevation range compared to HEF,
nually measured at ablation stakes for more than 100 years GPF and TSF, especially since the terminus retreated to the
at stone lines (Span et al., 1997). Line 3 on HEF is the old- top of a steep terrain level and detached from the dead ice
est stone line, started in 1895 and lasted until 1985 when the body at the front of this step in 2012. Velocity measure-
glacier retreated upstream from the location of the profile. ments were started in 1965 by Schneider (1970) at ablation
Earth Syst. Sci. Data, 11, 705–715, 2019 www.earth-syst-sci-data.net/11/705/2019/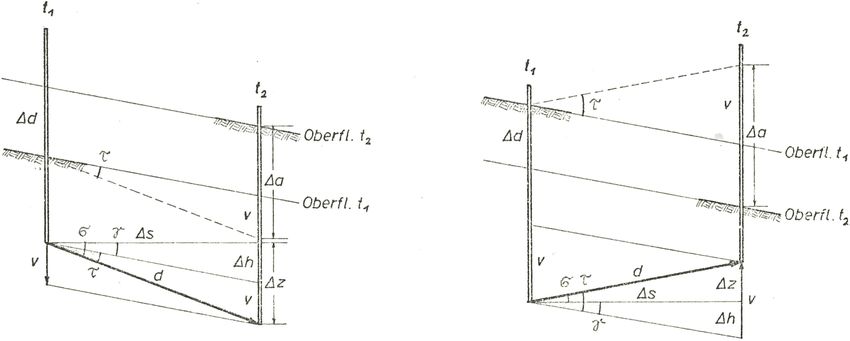
M. Stocker-Waldhuber et al.: Glacier surface velocities in the Ötztal Alps                                                                   707

Table 1. Geographic location and characteristic numbers of GPF, HEF, KWF and TSF from Austrian Glacier Inventory 3 of 2006 (Fischer
et al., 2015) and the year of the start of velocity measurements (meas. since). exp: exposition; sc: accumulation area; sa: ablation area.

                     name     location               exp. sc    exp. sa   altitude range [m]    area [km2 ]    meas. since
                     GPF      46.85◦ N, 10.75◦ E         NE        N             2116–3501           16.62        2009/10
                     HEF      46.79◦ N, 10.75◦ E          E       NE             2436–3715            7.49        1894/95
                     KWF      46.84◦ N, 10.79◦ E         SE        E             2754–3496            3.82        1965/66
                     TSF      46.90◦ N, 10.86◦ E          N       NW             2424–3756            5.71        2009/10

stakes and at accumulation stakes along the centre flow line                 The velocity records are compared to direct glacio-
of the glacier. A comparison between direct glaciological and             logical and geodetic mass balance measurements from
geodetic measurements on KWF, as well as on HEF, was                      Hoinkes (1970), Schneider (1970), Fischer (2010), Fischer
presented by Fischer (2011). The main outcome of the com-                 et al. (2013), Stocker-Waldhuber et al. (2017) and Strasser
parison was that both mass balance datasets generally agree               et al. (2018) on HEF, KWF and GPF. In these publications,
within measurement uncertainties.                                         the surface mass balances were derived from stakes and
   GPF is the second largest glacier of the Austrian Alps. The            snow pits by using the direct glaciological method (Hoinkes,
main glacier rests on a wide but hilly plateau and the tongue             1970). Additionally, DEMs (digital elevation models) and
descends through a narrow valley. After these early map-                  DODs (DEMs of difference) from photogrammetric or high-
pings (Sonklar, 1860; Finsterwalder, 1928), GPF was sub-                  resolution ALS data came into operation to determine vol-
ject to geophysical investigations (Giese, 1963), photogram-              ume and elevation changes (Abermann et al., 2010).
metric analyses (Keutterling and Thomas, 2006) and is still
one of the Eastern Alpine key research sites and has exten-
sive knowledge on its Holocene fluctuations (Nicolussi and
Patzelt, 2001). Recently, Gepatschferner became part of a de-             3.1    Velocity measurements at stone lines
tailed study on geomorphodynamics (Heckmann et al., 2012;
Heckmann and Morche, 2019). In this study, the stake net-                 The method of stone lines (Heim, 1885; Hess, 1904) was
work at the glacier tongue was extended from 3 stakes, where              only used on HEF at three cross-profiles. The position of sev-
velocities have been measured since 2009, to 16 stakes in                 eral stones and their distance to each other is fixed within
2012. TSF is similar to GPF a plateau and valley glacier                  a defined cross-profile. The number of stones depends on
with a wide accumulation area and a narrow glacier tongue.                the glacier width and thus varies in time with any expansion
The stake velocity records on TSF were started together with              or reduction of the glacier. The position of the stones was
those on GPF in 2009 at three positions at the glacier tongue.            measured initially with tachymetric systems and with DGPS
   On both glaciers, GPF and TSF, the positions of the stakes             since 2009. The stones are flat, with a diameter ranging from
are measured several times during the summer months, al-                  0.15 m to a maximum of 0.3 m. The distance between the
lowing a discussion of the sub-seasonal variability. In con-              original defined position of the stone within the profile and
trast, the velocity records at HEF and KWF were performed                 the position in the subsequent year is measured using a mea-
once a year and can be discussed in relation to their long-term           suring tape. The horizontal displacement is calculated in con-
mass balance records.                                                     sideration of the elevation change or the slope of the surface
                                                                          at each stone. The stones are then moved to their original
                                                                          position. From 2009, the displacement was calculated from
3   Methods                                                               the measured DGPS positions, but the measuring tape is still
                                                                          used for control. The annual velocities at the stone lines are
Based on the historical development of geodetic techniques,               given as the mean annual values of the stones in the profile
different methods came into operation on these glaciers dur-              and thus depend on the number of stones.
ing the past century. Trigonometric networks were installed                  Velocity records from ablation stakes complemented ear-
in 1894 on HEF (Blümcke and Hess, 1899) and in 1965/66                    lier data for Line 6 (before 1932/33) and Line 7 (before
on KWF (Schneider, 1970) to determine glacier surface ve-                 2013/14) for periods when the stakes were reinstalled at their
locities with a theodolite at stone lines on HEF and ablation             original position. The stakes are located at the central flow
stakes on both glaciers (Fig. 1). On HEF and KWF, stake                   line of the glacier, thus representing the maximum flow ve-
velocities were measured using a theodolite and tachymeter                locity at the profile. A ratio of 80 % between the mean veloc-
until 2009. Since then DGPS (differential global position-                ity from the stone line and the maximum velocity at stakes
ing system) has been used. On GPF and TSF, the full series                located at the centre of profile (Span and Kuhn, 2003) was
was measured by DGPS (system: Topcon; antennas: Hiper V;                  taken to compare the stake values with the mean values from
software: Magnet Tools).                                                  the stone lines.

www.earth-syst-sci-data.net/11/705/2019/                                                       Earth Syst. Sci. Data, 11, 705–715, 2019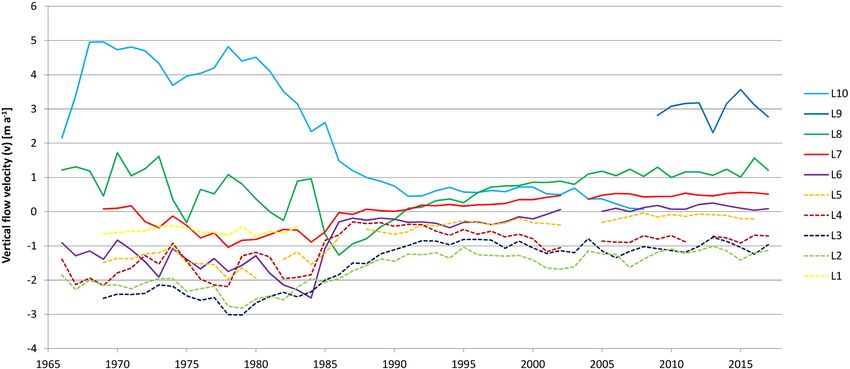
708                                                   M. Stocker-Waldhuber et al.: Glacier surface velocities in the Ötztal Alps

3.2    Velocity measurements at stakes                              DGPS measurements with a RTK (real time kinematic) pro-
                                                                    cedure came into operation. During these measurements, the
Velocity measurements are performed at ablation stakes and          base-station is located in close proximity to the glacier at
at accumulation stakes on KWF, GPF, and TSF and comple-             fixed points of the trigonometric network (Schneider, 1970;
ment the stone lines on HEF. The position of the stakes and         Niederwald, 2009; Weide, 2009; Zauner, 2010), allowing a
their motion on KWF is measured at the top of the stake and         staking out of the stake position with a comparable accuracy
calculated to the lower end of the stake, its base point. This      in the low centimetre level. The overall accuracies depend on
has the advantage that the measured velocity is not affected        a proper implementation of the measurement methods. The
by surface changes of accumulation or ablation. Figure 2,           precision requirements on KWF are in the range of ±0.05 m
taken from Schneider (1970), shows the components of the            per single measurement or at least ±0.1 m for the period be-
velocity vector (d) at the base point of the stake within the ac-   tween the two readings for the horizontal and the vertical dis-
cumulation area (left side) and the ablation area (right side)      placement.
between two points in time (t1, t2) depending on submer-               In contrast to the stakes on KWF, ice flow velocities at
gence (negative value of v) and emergence (positive value of        GPF and TSF are measured at wooden ablation stakes with
v). This definition coincides with the definition of submer-        DGPS and a post-processing procedure, the measured posi-
gence and emergence in Cogley et al. (2011). The vertical           tions refer to the glacier surface. The minimum occupation
motion can be calculated as the remainder of the absolute el-       time for DGPS with post-processing is 10 min but is mostly
evation change of the surface (1d) and the accumulation or          in the range of 30 to 60 min. The nearest base station, which
ablation (1a) from the elevation change due to the sloping          provides basic data within the GPS and GLONASS satellite
surface (1h) and the vertical component (1z) of the velocity        system, is located in Malles (STPOS-MABZ, 46◦ 410 9.5500 N,
vector (d) (Schneider, 1970). The difference between the ac-        10◦ 330 3.7300 E, South Tyrol, Italy). The baseline to the stakes
tual flow path (d), which is the length of the velocity vector,     on GPF is about 26 km and about 32 km to the stakes on
and the horizontal motion (1s), which is the projected veloc-       TSF. The accuracies from the post-processing procedure on
ity, results from the vertical component (1z). Annual values        these glaciers are ±0.1 m per single measurement or ±0.2 m
of the horizontal flow velocity (1s/a), as well as the verti-       for the period between two readings at best. Additionally,
cal motion values of submergence and emergence, were cal-           the distance to the base station and shading effects of the
culated for 365 d and on the basis of a fixed coordinate sys-       surrounding topography lead to higher uncertainties for the
tem. The horizontal velocity component (1s) and the vertical        DGPS measurements in the low decimetre to metre level.
component (v) in Schneider (1970) correspond to the defini-            The uncertainty of the stone line measurements on HEF,
tions of (u) and (w) in Cuffey and Paterson (2010). Upward          determined with a measuring tape, can only be estimated.
motion is positive.                                                 They depend on the measuring distance, surface roughness
   The stakes on KWF are reinstalled annually at their initial      and possible slipping of stones on the ice surface. The num-
(xy) position. Redrilling and measurements are conducted            ber of stones in the profile varies in time, which leads to a
with a level rod for exact perpendicular conditions. The re-        systematic error in the mean velocity of the lines. The num-
flector or the DGPS antenna is directly mounted to the top of       ber of stones at Line 7 decreased from 19 stones initially to
the stake. Therefore, duraluminium stakes with a rigid con-         17 stones and at Line 6 to 4 stones in 2017. The velocities
nection are used on KWF as ablation stakes (Ø = 2 cm) as            of the stone lines refer to the horizontal component of the
well as thicker accumulation stakes with a diameter of 5 cm         velocity vector (1s) and are calculated from theodolite and
for the necessary resistance against snow pressure. Tipping         tachymeter measurements until 2009 and with RTK-DGPS
over and melting in may lead to errors in measuring the ver-        since then with an absolute error of ±0.05 m per single
tical motion. On KWF, tipping over of the stakes is avoided         measurement. An estimated uncertainty of the mean stone
by the use of duraluminium stakes. Wood wool underneath             line velocity of 5 % of the annual displacement is higher in
the stake and at the downhill side of the stake protects against    contrast to the measurements on KWF due to the possible
melting.                                                            slipping motion of stones in the profile. The slipping error
                                                                    mainly depends more on the surface slope and the annual
4     Accuracies and uncertainties                                  surface ablation than on the surface velocity. This means
                                                                    that the higher the ablation rate and the steeper the surface
The investigations on KWF are accurate to the low centime-          slope, the higher the slipping error. Consequently, this error
tre level (0.05 to 0.1 m) for the horizontal and the vertical       becomes more important at low velocities (Blümcke and Fin-
stake position determined with theodolite and tachymeter.           sterwalder, 1905).
This is possible because of statistical adjustment of the mea-
sured positions using resection and intersection techniques
and especially the statistical adjustment of the trigonomet-
ric network. Further details of the derived errors for this
specific dataset can be found in Schneider (1970). In 2009,

Earth Syst. Sci. Data, 11, 705–715, 2019                                             www.earth-syst-sci-data.net/11/705/2019/
M. Stocker-Waldhuber et al.: Glacier surface velocities in the Ötztal Alps                                                               709

Figure 2. Drawings by Schneider (1970) of the motion of a stake and changes at the glacier surface (Oberfl.) between two time steps (t1,
t2) within the accumulation area (left) and the ablation area (right). d: flow path (length of the velocity vector); v: vertical velocity; 1s:
horizontal velocity (projected velocity); 1d: absolute surface elevation change; 1a: point mass balance (relative surface elevation change
from accumulation or ablation).

5     Results                                                            glaciers in Austria and Switzerland advanced due to posi-
                                                                         tive mass balances as a result of decreasing summer tempera-
5.1    Hintereisferner                                                   tures and increasing annual precipitation (Patzelt, 1985). The
                                                                         surface velocity of the glacier increased but with decreasing
Three stone line records on HEF display the variation in
                                                                         magnitudes from the terminus (L10) to the uppermost stake
glacier surface velocities for different periods, for more than
                                                                         (L1) within the accumulation area. This means an increased
100 years in total (Fig. 3). Three periods with increasing sur-
                                                                         velocity gradient along the glacier, with maximum of about
face velocities were recorded on HEF. The first and most
                                                                         90 m per year at the terminus declining to a few metres per
extensive acceleration of surface velocity happened before
                                                                         year at the highest elevations. The gradient of the vertical
1920, with a maximum mean stone line velocity of 125 m
                                                                         velocities was also large, with a submergence of up to 3 m
per year at Line 3 in 1919 (Hess, 1924). This is 112 m per
                                                                         per year within the accumulation zone to an emergence of
year above the mean flow velocity of 13 m per year of the
                                                                         up to 5 m per year at the lowermost stake. During that time
long-term average (1895–1985) at this location. The velocity
                                                                         the ELA (equilibrium line altitude) shifted to lower eleva-
increased to this maximum within a few years and decreased
                                                                         tions, which can be seen as the transition from submergence
very quickly until 1922, resulting in a small advance of the
                                                                         to emergence from stake to stake.
glacier terminus in subsequent years of around 60 m (Span et
                                                                            The advancing state of the glacier ended in 1985, followed
al., 1997). The second period was recorded from 1935 to the
                                                                         by a sharp decrease in the surface velocities and a reduction
early 1940s and the most recent one during the 1970s. Dur-
                                                                         of the velocity gradients along the flow line. The terminus ve-
ing that time, the mass balance of the glacier was positive
                                                                         locity response was large due to the positive mass balances.
for several years (Fig. 3). Since 1980, surface velocities on
                                                                         A significant change in velocity near the ELA at L6 did not
HEF have continuously decreased at the stone lines to about
                                                                         occur until negative mass balances occurred around 1985.
4 m per year in recent years at Line 6 and to about 7–8 m per
                                                                         Submergence transitioned gradually to emergence around
year at Line 7. This continuous decrease is accompanied by
                                                                         1990 at stakes L8 and L7 and in 2005 at L6, representing
strong negative mass balances in recent decades.
                                                                         a shift of the ELA to higher elevations. During that time,
                                                                         ELA shifted from 3130 m (mean value from 1985 to 1990)
5.2    Kesselwandferner
                                                                         to 3214 m during the period 2005–2010, and even above the
On KWF, measurements were started in the hydrological                    crest level in 2003 for the first time since the beginning of the
year 1965/66, including horizontal and vertical ice flow ve-             mass balance measurements (Fischer et al., 2014; Strasser et
locities (Fig. 4 and Fig. 5). These long-term investigations             al., 2018). At the lowermost stake L10, velocity decreased
document different glacier states at a longitudinal profile of           rapidly to almost zero because of the decreasing mass supply
up to 10 accumulation and ablation stakes. There are two                 to the terminus. This area became ice free in 2010 (Figs. 4
main contrasting periods, the first period from the start of             and 5). The latest positive mass balance occurred in 2015,
the measurements to 1985 and the second period since then.               with an immediate response in the horizontal and vertical ve-
During the first period, the glacier advanced because of pos-            locities.
itive mass balances. During that time 75 % of the measured

www.earth-syst-sci-data.net/11/705/2019/                                                     Earth Syst. Sci. Data, 11, 705–715, 2019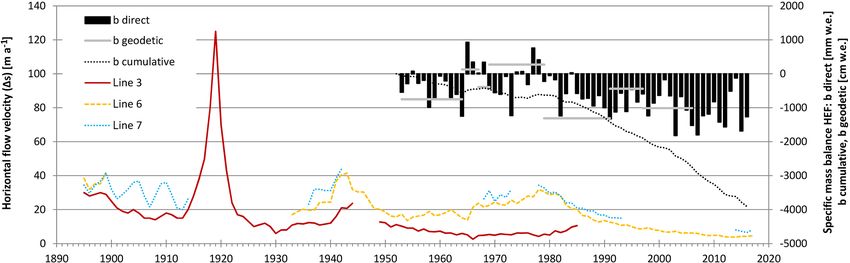
710                                                    M. Stocker-Waldhuber et al.: Glacier surface velocities in the Ötztal Alps

Figure 3. The mean annual velocities of the stones at lines 3, 6 and 7 on Hintereisferner since 1894/95 (= 1895). The data series has been
extended since Span et al. (1997) and annual specific surface mass balance (b direct) (Strasser et al., 2018; WGMS, 2017; original data:
Hess, 1924), as well as the geodetic balances from DODs (b geodetic) by Fischer (2011) since 1953. Locations of the stone lines are shown
in Fig. 1.

Figure 4. Annual horizontal flow velocities (1s/a) at the accumulation and ablation stakes on Kesselwandferner (e.g. the year 2015 refers
to the hydrological year 2014/2015) and the specific surface mass balance (b direct) (Strasser et al., 2018; WGMS, 2017), as well as the
geodetic balances from DODs (b geodetic) by Fischer (2011). Locations of the stakes are shown in Fig. 1.

5.3   Gepatschferner and Taschachferner                                area and a later decrease to almost zero (Stocker-Waldhuber
                                                                       et al., 2017). In total, a general slowdown of velocities at the
The measurements of ice flow velocities and ablation on GPF            tongue of GPF was found since the beginning of the mea-
and TSF were started in 2009/10. The stake network on GPF              surements.
was extended in 2012. During these measurements, interan-                 An example of sub-seasonal fluctuations in surface veloc-
nual velocity fluctuations were small, especially at the three         ity is given in Fig. 7 for Stake 65 at GPF, which has been
stakes on TSF (54, 55 and 56). At the lowermost Stake 54,              measured from 2009 with the least data gaps since then. The
the horizontal velocities were less than 10 m per year during          velocities are given as mean values per day to make the dif-
the whole period. The two higher-altitude points 55 and 56             ferent time periods of the stake readings comparable. During
returned velocities of 30 to around 40 m per year. The higher          the winter seasons velocities generally decrease. Maximum
values at 55 compared to 56 are caused by topographic ef-              values were typically found in August each year, except for
fects, with a steepening of the glacier tongue and a narrowing         the years 2013 and 2014, which had earlier peaks in July.
of the cross section from Stake 56 towards Stake 55 (Fig. 6).          During winter months the elevation change of the surface
   On GPF, a general trend of decreasing surface velocities            from geodetic measurements is close to zero or even positive
was found at all stakes, with a larger decline in velocity at the      while surface velocity is decreasing. The opposite process is
terminus than at the upper cross-profile (71–75). At Stake 62,         found during the summer season, when the highest surface
a funnel-shaped surface depression, caused by an evacuation            velocities go along with the most negative elevation change.
of subglacial sediments due to a heavy precipitation event,
led to a spatially limited increase in surface velocity in that

Earth Syst. Sci. Data, 11, 705–715, 2019                                                  www.earth-syst-sci-data.net/11/705/2019/
M. Stocker-Waldhuber et al.: Glacier surface velocities in the Ötztal Alps 711
Figure 5. Annual vertical velocities (1v/a) at the accumulation and ablation stakes on Kesselwandferner (e.g. the year 2015 refers to the
hydrological year 2014/2015). Positive values represent emergence flow, negative ones represent submergence flow. Locations of the stakes
are shown in Fig. 1.
Figure 6. Annual horizontal flow velocities (1s/a) on Gepatschferner and Taschachferner and L9 at Kesselwandferner for comparison
(e.g. the year 2015 refers to the hydrological year 2014/2015). GPF (a): selection of the longitudinal stakes at the tongue of Gepatschferner.
GPF (b): three stakes at the cross-profile. Locations of the stakes are shown in Fig. 1: Stake 71 – orogr. left side; Stake 73 – centre; Stake 75
– orogr. right side.
6 Discussion On GPF and TSF these measurements were conducted ex-
clusively at stakes at the tongue where the decreasing ve-
The investigations show that the magnitude of the fluctua- locity rates represent the retreating state of the glacier. The
tions of the surface velocities is higher at the ablation stakes decreasing velocities were found especially on GPF, in con-
compared to those within the accumulation area and high- trast to TSF, where the flow rates remained almost constant
est at the lowermost stakes. This means that changes in ob- during these investigations. This is caused by the specific
served velocity, especially at ablation stakes, are very well topographic conditions of the TSF glacier tongue, which is
suited for documenting the glacier state, even more so at a steeper and shorter, and the terminus is located at a higher
fast reacting glacier like KWF. This is supported by a linear altitude compared to the tongue of GPF.
regression of annual mean specific balance (b) of the total The sub-seasonal fluctuations on GPF (Fig. 7) represent
glacier area of HEF and KWF versus the mean specific bal- the typical acceleration of the glacier during summer months,
ance of their accumulation areas (bc) for the period 1965/66– which is well known and was, for example, already measured
1999/00 by Span and Kuhn (2003). They found nearly iden- on HEF between the end of July and mid-September from
tical correlation coefficients for the two balances, while the 1900 to 1904 by Blümcke and Finsterwalder (1905). The
standard deviation σ (b) was twice as high as σ (bc), docu- summer peaks on GPF and TSF were found mainly during
menting the higher sensitivity of the ablation areas to mass August each year. These sub-seasonal fluctuations depend
balance changes of the two glaciers. on the drainage network, which is driven by the amount of
www.earth-syst-sci-data.net/11/705/2019/ Earth Syst. Sci. Data, 11, 705–715, 2019712 M. Stocker-Waldhuber et al.: Glacier surface velocities in the Ötztal Alps
Figure 7. Mean daily horizontal velocities (1s d−1 ) at Stake 65 on Gepatschferner between the measurements, as an example of the sub-
seasonal fluctuation of surface velocity. The peak in July 2013 shows the highest uncertainty, very likely because of few satellites due to
shading effects of the surrounding topography, which depend on the time of the measurements. Additional information is given by the mean
elevation change per day from ALS DODs at the position of the stake (data extended from Stocker-Waldhuber et al., 2017).
melt water, seasonal and extreme weather conditions (Iken, cher et al., 2018). KWF presents an immediate response at
1977; Gudmundsson, 2002). The accuracy of the measure- all profiles concurrently, which means that a mass gain or in-
ments on GPF varies over time and depends on shading ef- crease in the thickness within the accumulation area causes
fects of the surrounding topography. For example, the peak in an increase in the emergence at the lowermost stakes within
2013 shows the greatest uncertainty due to topographic shad- 1 year.
ing effects and is thus not representative of the actual surface During glacier retreat, the transition from submergence to
velocity. emergence shifts to higher elevations, as was found on KWF
Generally, the glacier surface velocities will be overes- from 1986 to the present. As a consequence, the magnitude
timated by stone velocity measurements, especially at low of the vertical velocities decreases, which leads to increas-
velocities and high ablation rates. This difference is shown ing retreat rates of the terminus but, at the same time, to an
by Hess (1924) for the period between 1913/14 and 1921/22 increase in the thickness at higher elevations in case of a pos-
with measured surface velocities at neighbouring stones and itive mass balance. Apart from the effect of the mass balance,
boreholes. according to the continuity equation, local thickness changes
can also be caused by convergent or divergent glacier flow.
For the investigated temperate mountain glaciers, ice flow
7 Data availability velocity is a glaciological parameter that reacts very quickly
to changes in the forcing such as the glacier mass balance
Velocity data of the four glaciers Hintereisferner, Kessel-
variability (Huss, 2012). As conventional parameters like
wandferner, Gepatscherner and Taschachferner are avail-
ELA tend to be above the summit for the investigated glaciers
able at https://doi.org/10.1594/PANGAEA.896741 (Stocker-
under current conditions and specific mass balance is af-
Waldhuber et al., 2018). New data will be added every year.
fected by rapid changes in area, long-term monitoring of ice
flow provides valuable additional information on the glacier
8 Conclusions state. Our dataset allows for the development and validation
of perspectives on ice flow velocity as monitoring tool.
The long-term investigations of the surface velocities at these
glaciers document the state of each glacier and its response
to a climate signal. Three periods with accelerating veloc- Author contributions. MSW is responsible for the velocity mea-
ities caused by positive mass balances were found in the surements and data analyses of Hintereisferner, Kesselwandferner
longest time series on HEF. A time shift of the maximum and Gepatschferner, prepared the figures and wrote the manuscript.
AF is leading the working group, accounts for the maintenance of
values from higher to lower stone line profiles indicates the
the long-term monitoring programs and contributed in writing the
response time of the tongue. Despite the increase in surface manuscript. KH is responsible for the velocity measurements and
velocities during these three periods, mass gain on HEF was data analyses of Taschachferner. MK initiated the measurements on
insufficient for the terminus to advance, except for a small Gepatschferner and Taschachferner. All co-authors were involved in
advance during the 1920s. The 1920s peak velocity at Line corrections and additions to the manuscript during the whole review
3 was also confirmed by measurements at boreholes, stakes process.
and additional stones within the ablation area (Hess, 1924).
In contrast to HEF, the terminus of KWF advanced by more
than 250 m from the 1970s to the 1980s (Patzelt, 1985; Fis-
Earth Syst. Sci. Data, 11, 705–715, 2019 www.earth-syst-sci-data.net/11/705/2019/M. Stocker-Waldhuber et al.: Glacier surface velocities in the Ötztal Alps 713
Competing interests. The authors declare that they have no con- Braun, L., Reinwarth, O., and Weber, M.: Der Vernagtferner als Ob-
flict of interest. jekt der Gletscherforschung, Z. Gletscherk. Glazialgeol., 45/46,
85–104, 2012
Cogley, J. G., Hock, R., Rasmussen, L. A., Arendt, A. A., Bauder,
Acknowledgements. Maintaining long-term monitoring is al- A., Braithwaite, R. J., Jansson, P., Kaser, G., Möller, M., Nichol-
ways a challenging task and requires financial support and the son, L., and Zemp, M.: Glossary of Glacier Mass Balance and
help of numerous people, to whom we would like to gratefully ex- Related Terms, IHP-VII Technicl Documents in Hydrology, No.
press our thanks. Terminus variations of the glaciers and the ve- 86, IACS Contribution No. 2, UNESCO-IHP, Paris, 2011.
locity records on HEF relate to the annual measurements of the Cuffey, K. M. and Paterson, W. S. B.: The Physics of Glaciers, Aca-
Austrian Alpine Club. Mass balance terms are provided by the demic Press, Amsterdam, 4th Ed., 704 pp., 2010.
World Glacier Monitoring Service (WGMS) and the Institute of At- Finsterwalder, S.: Die Theorie der Gletscherschwankungen, Z.
mospheric and Cryospheric Sciences (ACINN). Research (project Gletscherk. Glazialgeol., 1, 81–103, 1907.
PROSA) on GPF was funded by DFG (SCHM 472/16-1, SCHM Finsterwalder, S.: Begleitworte zur Karte des Gepatschferners, Z.
472/17-2 and BE 1118/33-3) and FWF (I 894-N24 and I 1646- Gletscherk., 16, 20–41, 1928.
N19) and funding continues from the glacier ski resort Kaunertaler Fischer, A.: Glaciers and climate change: Interpretation of 50 years
Gletscher GmbH and Tiroler Wasserkraft AG (TIWAG), which also of direct mass balance of Hintereisferner, Global Planet. Change,
support the measurements on TSF. We want to thank Heralt Schnei- 71, 13–26, https://doi.org/10.1016/j.gloplacha.2009.11.014,
der who started the velocity records on KWF and continued them 2010.
for more than 50 years. These records are now supported by the non- Fischer, A.: Comparison of direct and geodetic mass balances
profit organization Glacier and Climate. We want to thank Brigitte on a multi-annual time scale, The Cryosphere, 5, 107–124,
Scott for editing the English. We thank Reinhard Drews (Ed.) and https://doi.org/10.5194/tc-5-107-2011, 2011.
the reviewers Mauri Pelto and Andreas Bauder, who gave us useful Fischer, A., Markl, G., and Kuhn, M.: Glacier mass bal-
comments that helped us to improve this paper. ance and elevation zones of Hintereisferner, Ötztal
Alps, Austria, 1952/1953 to 2010/2011, PANGAEA,
https://doi.org/10.1594/PANGAEA.818898, 2013.
Financial support. This research has been supported by the Fischer, A., Markl, G., Schneider, H., Abermann, J., and Kuhn,
Deutsche Forschungsgemeinschaft (grant no. BE 1118/33-3) and M.: Glacier mass balances and elevation zones of Kesselwand-
the Österreichische Forschungsförderungsgesellschaft (grant no. I ferner, Ötztal Alps, Austria, 1952/1953 to 2012/2013, PAN-
1646-N19). GAEA, https://doi.org/10.1594/PANGAEA.818757, 2014.
Fischer, A., Patzelt, G., Achrainer, M., Groß, G., Lieb, G., and
Keller-Pirkelbauer-Eulenstein, A.: Gletscher im Wandel, 125
Jahre Gletschermessdienst des Alpenvereins. Springer Spektrum,
Review statement. This paper was edited by Reinhard Drews and
135 pp., 2018.
reviewed by Mauri Pelto and Andreas Bauder.
Fischer, A., Seiser, B., Stocker-Waldhuber, M., Mitterer, C., and
Abermann, J.: Tracing glacier changes in Austria from the Lit-
tle Ice Age to the present using a lidar-based high-resolution
glacier inventory in Austria, The Cryosphere, 9, 753–766,
https://doi.org/10.5194/tc-9-753-2015, 2015.
References Forbes, J. D.: Illustrations of the viscous theory of glacier motion,
Philos. Trans. Roy. Soc., 136, 143–210, 1846.
Abermann, J., Fischer, A., Lambrecht, A., and Geist, T.: On Förtsch, O. and Vidal, H.: Die Ergebnisse seismischer Messungen
the potential of very high-resolution repeat DEMs in glacial auf dem Hintereisferner in den Ötztaler Alpen 1954, Gerlands
and periglacial environments, The Cryosphere, 4, 53–65, Beiträge zur Geophysik, 65, 131–156, 1956.
https://doi.org/10.5194/tc-4-53-2010, 2010. Fritzsch, M.: Verzeichnis der bis Sommer 1896 in den Ostalpen
Agassiz, L.: Système glaciaire ou recherches sur les glaciers, leur gesetzten Gletschermarken, Verlag des Deutschen und Österre-
mécanisme, leur ancienne extension et le rôle qu’ils ont joué dans ichischen Alpenvereins, Wien, 1898
l’histoire de la terre. Première partie: Nouvelles études et expéri- Giese, P.: Some results of seismic refraction work at Gepatsch
ences sur les glaciers actuels, leur structure, leur progression et Glacier in the Ötztal Alps, IAHS Publications, 61, 154–161,
leur action physique sur le sol, V. Masson, Paris, 1847. 1963.
Berthier, E. and Vincent, C.: Relative contribution of surface mass- Groß, G.: Der Flächenverlust der Gletscher in Österreich 1850–
balance and ice-flux changes to the accelerated thinning of Mer 1920–1969, Z. Gletscherk. Glazialgeol., 23/2, 131–141, 1987.
de Glace, French Alps, over 1979–2008, J. Glaciol., 58/209, 501– Groß, G.: Die Geschichte der Gletscherbeobachtungen und -
512, https://doi.org/10.3189/2012JoG11J083, 2012. messungen in den Österreichischen Alpen, Kapitel 5, in:
Blümcke, A. and Finsterwalder, S.: Zeitliche Änderung der Gletscher im Wandel, 125 Jahre Gletschermessdienst des Alpen-
Geschwindigkeit in der Gletscherbewegung, Sitzungsbericht der vereins, edited by: Fischer, A., Patzelt, G., Achrainer, M., Groß,
math.-phys. Kl. der Kgl. Bayer, Akademie der Wissenschaften, G., Lieb, G., Kellerer-Pirklbauer-Eulenstein, A., and Bendler, G.,
Bd.35/1, 109-131, in: Z. Gletscherk., 1, 73–75, 1905. Springer Spektrum, 53–93, 2018.
Blümcke, A. and Hess, H.: Untersuchungen am Hintereisferner. Gudmundsson, H.: Observations of a reversal in vertical and hor-
Wissenschaftliche Ergänzungshefte zur Zeitschrift des Deutsch- izontal strain-rate regime during a motion event on Unteraar-
Österreichischen Alpenvereins, 1, 1–87, 1899.
www.earth-syst-sci-data.net/11/705/2019/ Earth Syst. Sci. Data, 11, 705–715, 2019714 M. Stocker-Waldhuber et al.: Glacier surface velocities in the Ötztal Alps gletscher, Bernese Alps, Switzerland, J. Glaciol., 48, 566–574, Vol. LII, Kommissions-Verlag Georg & Co, Basel, Genf, Lyon, 2002. 191 pp., 1916. Hays, J. D., Imbrie, J., and Shackleton, N. J.: Variations in the Milankovitch, M.: Théorie Mathématique des Phénomènes Produits Earth’s Orbit: Pacemaker of the Ice Ages, Science, 194, 1121– par la Radiation Solaire, Gauthier-Villars, Paris, 1920. 1132, 1976. Nicolussi, K.: Die historischen Vorstöße und Hochstände des Ver- Heckmann, T. and Morche, D. (Eds): Geomorphology of Proglacial nagtferners 1600–1850 AD, Z. Gletscherk. Glazialgeol., 45/46, Systems – Landform and Sediment Dynamics in Recently 9–23, 2012. Deglaciated Alpine Landscapes, Springer International Publish- Nicolussi, K. and Patzelt, G.: Untersuchungen zur holozänen ing, Basel, 2019. Gletscherentwickung von Pasterze und Gepatschferner (Os- Heckmann, T., Haas, F., Morche, D., Schmidt, K. H., Rohn, J., talpen), Z. Gletscherk. Glazialgeol., 36, 1–87, 2001. Moser, M., Leopold, M., Kuhn, M., Briese, C., Pfeiffer, N., and Niederwald, T.: Festpunktbestimmung mit GPS für Gletscher- Becht, M.: Investigating an Alpine proglacial sediment budget Monitoring-Projekte in den Ötztaler Alpen (Tirol), Master the- using field measurements, airborne and terrestrial LiDAR data, sis, Hochschule für Angewandte Wissenschaften FH München, IAHS Press, Wallingfort IAHS Publication 356, 438–447, 2012. Fakultät für Geoinformation, 2009. Heim, A.: Handbuch der Gletscherkunde, Verlag von J. Engelhorn, Patzelt, G.: The Austrian Glacier Inventory: Status and First Re- Stuttgard, 560 pp., 1885. sults, IAHS Publication, 126, 181–183, 1980. Helfricht, K., Kuhn, M., Keuschnig, M., and Heilig, A.: Lidar snow Patzelt, G.: The period of glacier advances in the Alps, 1965 to cover studies on glaciers in the Ötztal Alps (Austria): com- 1980, Z. Gletscherk. Glazialgeol., 21, 403–407, 1985. parison with snow depths calculated from GPR measurements, Penck, A. and Brückner, E.: Die Alpen im Eiszeitalter, Tauchnitz, The Cryosphere, 8, 41–57, https://doi.org/10.5194/tc-8-41-2014, Leipzig, 1909. 2014. Roethlisberger, H.: The Rhone glacier surveys, Hydrol. Sci. J., 8, Hess, H.: Die Gletscher, F. Vieweg und Sohn, Braunschweig, 426 119–121, https://doi.org/10.1080/02626666309493319, 1963. pp., 1904. Schneider, H.: Die Grundlagen der Vermessung am Kesselwand- Hess, H.: Der Hintereisferner 1893 bis 1922, Ein Beitrag zur Lö- ferner (Ötztaler Alpen) und die Bewegung dieses Gletschers in sung des Problems der Gletscherbewegung, Z. Gletscherk., 13, den Haushaltsjahren 1965/66, 1966/67 und 1967/68, Disserta- 145–203, 1924. tion an der philosophischen Fakultät der Universität Innsbruck, Hoinkes, H.: Methoden und Möglichkeiten von Massen- 186 pp., 1970. haushaltsstudien auf Gletschern, Z. Gletscherk. Glazialgeol., 6, Shackleton, N. J.: The 100,000-Year Ice-Age Cycle Identified and 37–90, 1970. Found to Lag Temperature, Carbon Dioxide, and Oribtal Eccen- Hoinkes, H. and Steinacker, R.: Hydrometeorological implications tricity, Science, 289, 1897–1902, 2000. of the mass balance of Hintereisferner, 1952–53 to 1968–69, Sonklar, K.: Die Oetzthaler Gebirgsgruppe mit besonderer Rück- Snow and Ice Symposium-Neiges et Glaces (Proceedings of the sicht auf Orographie und Gletscherkunde, Justus Perthes, Gotha, Moscow Symposium, August 1971), IAHS-AISH Publ., 104, 1860. 1975. Span, N. and Kuhn, M.: Simulating annual glacier flow with Huss, M.: Extrapolating glacier mass balance to the mountain-range a linear reservoir model, J. Geophys. Res., 108, 4313, scale: the European Alps 1900–2100, The Cryosphere, 6, 713– https://doi.org/10.1029/2002JD002828, 2003. 727, https://doi.org/10.5194/tc-6-713-2012, 2012. Span, N., Kuhn, M., and Schneider, H.: 100 years Iken, A.: Variations of surface velocities of some Aline glaciers of ice dynamics of Hintereisferner, Central Alps, measured at intervals of a few hours. Comparison with Arctic Austria, 1884–1994, Ann. Glaciol., 24, 297–302, glaciers, Z. Gletscherk. Glazialgeol., 13, 23–35, 1977. https://doi.org/10.1017/S0260305500012349, 1997. Jacob, T., Wahr, J., Pfeffer, W. T., and Swenson, S.: Recent con- Stocker-Waldhuber, M., Fischer, A., Keller, L., Morche, D., tributions of glaciers and ice caps to sea level rise, Nature, 482, and Kuhn, M.: Funnel-shaped surface depressions – Indi- 514, https://doi.org/10.1038/nature10847, 2012. cator or accelerant of rapid glacier disintegration? A case Keutterling, A. and Thomas, A.: Monitoring glacier elevation study in the Tyrolean Alps, Geomorphology, 287, 58–72, and volume change with digital photogrammetry and GIS at https://doi.org/10.1016/j.geomorph.2016.11.006, 2017. Gepatschferner glacier, Austria, Int. J. Remote Sens., 27/19, Stocker-Waldhuber, M., Fischer, A., Helfricht, K., Kuhn, 4371–4380. https://doi.org/10.1080/01431160600851819, 2006. M., Schneider, H., and Span, N.: Glacier surface ve- Kuhn, M., Kaser, G., Markl, G., Nickus, U., and Pellet, F.: Fluctua- locities in the Ötztal Alps (Austria), PANGAEA, tions of climate and mass balance: Different responses of two ad- https://doi.org/10.1594/PANGAEA.896741, 2018. jacent glaciers, Z. Gletscherk. Glazialgeol., 21, 409–416, 1985. Strasser, U., Marke, T., Braun, L., Escher-Vetter, H., Juen, I., Kuhn, Kuhn, M., Dreiseitl, E., Hofinger, S., Markl, G., Span, N., and M., Maussion, F., Mayer, C., Nicholson, L., Niedertscheider, K., Kaser, G.: Measurements and Models of the Mass Balance of Sailer, R., Stötter, J., Weber, M., and Kaser, G.: The Rofental: Hintereisferner, Geograf. Annal., 81, 659–670, 1999. a high Alpine research basin (1890–3770 m a.s.l.) in the Ötztal Kuhn, M., Lambrecht, A., Abermann, J., Patzelt, G., and Groß, G.: Alps (Austria) with over 150 years of hydrometeorological and The Austrian glaciers 1998 and 1969, area and volume changes, glaciological observations, Earth Syst. Sci. Data, 10, 151–171, Z. Gletscherk. Glazialgeol., 43, 3–107, 2012. https://doi.org/10.5194/essd-10-151-2018, 2018. Mercanton, P. L.: Vermessungen am Rhonegletscher. Mensura- Weide, S.: Estimating the Height Accuracy of Airborne Laser Scan- tions au glacier du Rhone 1874–1915, Gletscher-Kommission ning with GPS and Calculation of Glacier Movement at Hin- der Schweizerischen Naturforschenden Gesellschaft, Band LII, Earth Syst. Sci. Data, 11, 705–715, 2019 www.earth-syst-sci-data.net/11/705/2019/
M. Stocker-Waldhuber et al.: Glacier surface velocities in the Ötztal Alps                                                        715

  tereisferner, Master thesis, Hochschule für Angewandte Wis-        Zemp, M., Huss, M., Thibert, E., Eckert, N., McNabb, R., Hu-
  senschaften FH München, Fakultät für Geoinformation, 2009.           ber, J., Barandun, M., Machguth, H., Nussbaumer, S.U., Gärtner
WGMS: Global Glacier Change Bulletin No. 2 (2014–2015),                Roer, I., Thomson, L., Paul, F., Maussion, F., Kutuzov, S., and
  edited by: Zemp, M., Nussbaumer, S. U., Gärtner-Roer,                Cogley, J. G.: Global glacier mass changes and their contribu-
  I., Huber, J., Machguth, H., Paul, F., and Hoelzle, M.,              tions to sea-level rise from 1961 to 2016, Nature, 568, 382–386,
  ICSU(WDS)/IUGG(IACS)/UNEP/UNESCO/WMO,                     World      https://doi.org/10.1038/s41586-019-1071-0, 2019.
  Glacier Monitoring Service, Zurich, Switzerland, 244 pp., publi-
  cation based on database version: https://doi.org/10.5904/wgms-
  fog-2017-10, 2017.
Zauner, R.: Glaziologische Analyse der Gletscheroberfläche am
  Blockgletscher Äußeres Hochebenkar, Hintereisferner und am
  Kesselwandferner (Ötztaler Alpen), Bachelor thesis, Hochschule
  für Angewandte Wissenschaften FH München, Fakultät für
  Geoinformation, 2010.

www.earth-syst-sci-data.net/11/705/2019/                                               Earth Syst. Sci. Data, 11, 705–715, 2019
You can also read