Macro-Nutrient Stoichiometry of Glacier Algae From the Southwestern Margin of the Greenland Ice Sheet - Frontiers
←
→
Page content transcription
If your browser does not render page correctly, please read the page content below
ORIGINAL RESEARCH
                                                                                                                                                 published: 28 June 2021
                                                                                                                                          doi: 10.3389/fpls.2021.673614

                                             Macro-Nutrient Stoichiometry of
                                             Glacier Algae From the Southwestern
                                             Margin of the Greenland Ice Sheet
                                             Christopher J. Williamson 1* , Thomas Turpin-Jelfs 1 , Miranda J. Nicholes 1 ,
                                             Marian L. Yallop 2 , Alexandre M. Anesio 3 and Martyn Tranter 1,3
                                             1
                                              Bristol Glaciology Centre, School of Geographical Sciences, University of Bristol, Bristol, United Kingdom, 2 School
                                             of Biological Sciences, University of Bristol, Bristol, United Kingdom, 3 Department of Environmental Science, Aarhus
                                             University, Aarhus, Denmark

                                             Glacier algae residing within the surface ice of glaciers and ice sheets play globally
                                             significant roles in biogeochemical cycling, albedo feedbacks, and melt of the world’s
                                             cryosphere. Here, we present an assessment of the macro-nutrient stoichiometry of
                                             glacier algal assemblages from the southwestern Greenland Ice Sheet (GrIS) margin,
                                             where widespread glacier algal blooms proliferate during summer melt seasons.
                                             Samples taken during the mid-2019 ablation season revealed overall lower cellular
                                             carbon (C), nitrogen (N), and phosphorus (P) content than predicted by standard
                                             microalgal cellular content:biovolume relationships, and elevated C:N and C:P ratios
                                             in all cases, with an overall estimated C:N:P of 1,997:73:1. We interpret lower cellular
                          Edited by:
                    Linda Nedbalová,
                                             macro-nutrient content and elevated C:N and C:P ratios to reflect adaptation of glacier
           Charles University, Czechia       algal assemblages to their characteristic oligotrophic surface ice environment. Such
                        Reviewed by:         lower macro-nutrient requirements would aid the proliferation of blooms across the
                       Elly Spijkerman,
                                             nutrient poor cryosphere in a warming world. Up-scaling of our observations indicated
     University of Potsdam, Germany
                        Daniel Remias,       the potential for glacier algal assemblages to accumulate ∼ 29 kg C km2 and ∼
 University of Applied Sciences Upper        1.2 kg N km2 within our marginal surface ice location by the mid-ablation period
                        Austria, Austria
                                             (early August), confirming previous modeling estimates. While the long-term fate of
                    *Correspondence:
            Christopher J. Williamson
                                             glacier algal autochthonous production within surface ice remains unconstrained, data
            c.williamson@bristol.ac.uk       presented here provide insight into the possible quality of dissolved organic matter that
                                             may be released by assemblages into the surface ice environment.
                  Specialty section:
        This article was submitted to        Keywords: glacier algae, C:N:P, Greenland Ice Sheet, stoichiometry, supraglacial
       Marine and Freshwater Plants,
               a section of the journal
            Frontiers in Plant Science      INTRODUCTION
         Received: 27 February 2021
            Accepted: 23 April 2021         Microbial communities that reside on the surfaces of glaciers and ice sheets play globally significant
           Published: 28 June 2021          roles in carbon (C) and nutrient cycling and surface ice melt (Hodson et al., 2008; Stibal et al.,
                              Citation:     2012; Anesio et al., 2017; Williamson et al., 2018, 2020). Of particular importance are Streptophyte
         Williamson CJ, Turpin-Jelfs T,     “glacier algae” (Williamson et al., 2019), whose presence in surface ice lowers the bare ice albedo,
  Nicholes MJ, Yallop ML, Anesio AM         enhances solar energy absorption, and drives surface melt through the process of “biologically
 and Tranter M (2021) Macro-Nutrient
                                            driven albedo reduction” (Yallop et al., 2012; Stibal et al., 2017; Williamson et al., 2018, 2020; Cook
  Stoichiometry of Glacier Algae From
      the Southwestern Margin of the
                                            et al., 2020). On the surface of the Greenland Ice Sheet (GrIS), summer blooms of glacier algae are
                 Greenland Ice Sheet.       responsible for widespread albedo decline that has paralleled accelerating surface melt since the
          Front. Plant Sci. 12:673614.      early 1990s (Yallop et al., 2012; Tedesco et al., 2016; Stibal et al., 2017; van den Broeke et al., 2017;
       doi: 10.3389/fpls.2021.673614        Cook et al., 2020; Tedstone et al., 2020; Williamson et al., 2020), with recent estimates attributing

Frontiers in Plant Science | www.frontiersin.org                                    1                                             June 2021 | Volume 12 | Article 673614
Williamson et al. Glacier Algal Cellular Stoichiometry
an additional 5.5–8.0 Gt of runoff to glacier algal growth along imply inefficient remineralization of inorganic nutrient resources
the western ice sheet margin; 6–9% of the total runoff (Cook et al., within GrIS surface ice, and a potential mechanism of bottom-up
2020). Given that melt of the GrIS is the single largest cryospheric control (Nicholes et al., 2019). Recently, McCutcheon et al. (2021)
contributor to global eustatic sea level rise (Bamber et al., provided the first evidence for such bottom-up control of glacier
2018), constraining bloom dynamics into the future remains a algal blooms on the GrIS, highlighting inorganic phosphorus (Pi )
significant research priority (Williamson et al., 2019, 2020; Cook limitation and the importance of locally sourced hydroxylapatite
et al., 2020; Tedstone et al., 2020). in supporting bloom proliferation, and likely important roles for
Glacier algal blooms initiate following snow line retreat heterotrophic bacterial and fungal communities in accelerating
(Williamson et al., 2018), with population doubling times on apatite weathering and thus P availability to glacier algal
the GrIS ranging 3.75–5.5 days, and maximal cell densities communities. This study did not, however, directly quantify
approaching 105 cells mL−1 of melt water during major bloom glacier algal abundance within samples, precluding direct
years (Yallop et al., 2012; Stibal et al., 2017; Williamson et al., calculation of cellular elemental quotas. The importance of
2018, 2020). At these cell densities, widespread albedo decline is this information is illustrated by the findings of Holland
driven by significant secondary phenolic pigmentation produced et al. (2019) for the same bloom and sampling sites, who
by glacier algae to protect their low-light adapted chloroplasts concluded that there was sufficient inorganic macro-nutrient
(Williamson et al., 2020). By dissipating the intercepted incident availability within surface ice to support the magnitude of glacier
irradiance as heat, this secondary pigmentation also generates algal bloom apparent during the 2016 ablation season when
liquid water proximal to the cells, driving surface ice ablation assuming Redfield stoichiometry for glacier algal C, nitrogen (N),
while providing access to nutrient and other resources required and P requirements.
to promote algal growth (Dial et al., 2018; Williamson et al., Fundamental to deciphering the importance of bottom-up
2020). Accordingly, growth proceeds as a function of bare- controls on glacier algal blooms is therefore knowledge of
ice melt duration, such that strong patterning in accumulated the macronutrient cellular requirements of glacier algal cells.
biomass is apparent across the ablation zone, with maximal While Redfield stoichiometry provides an important framework
cell densities accumulated within the most marginal regions against which ambient nutrient concentrations can be contrasted
that experience the longest ablation periods, and a decreasing (Redfield, 1958), deviations from this ratio are well documented
trend toward the equilibrium line (Williamson et al., 2020). across several algal lineages (Hecky et al., 1993; Geider and
As the ablation period progresses into polar winter, the fate La Roche, 2002; Quigg et al., 2003), with individual cell
of accumulated biomass remains unknown, although glacier stoichiometry shown to be dynamic relative to a plethora of
algal species have been shown to overwinter in alpine locations drivers (Geider and La Roche, 2002; Quigg et al., 2003; Dickman
(Remias et al., 2012b), and active glacier algal assemblages have et al., 2006; Finkel et al., 2016). Here, we provide an estimate of
been observed in GrIS shallow surface ice prior to snow line glacier algal macro-nutrient (C, N, and P) cellular stoichiometry
retreat (Nicholes et al., 2019). in assemblages sampled from the surface of the GrIS. A snapshot
One of the biggest questions remaining about glacier algal of glacier algae stoichiometry was determined for assemblages
blooms asks, What factors limit the distribution and magnitude residing within surface ice sampled from the south western ice
of blooms in space and time? While physical conditions such as sheet margin during the 2019 ablation season in order to provide
snow-pack height, light availability, and temperature produce a a first order approximation of the elemental requirements of
first order control on the ability of blooms to form and proliferate glacier algal assemblages and to investigate the potential for
in any given year (Tedstone et al., 2017; Williamson et al., 2020), divergence from Redfield dynamics. This data is important for
little information currently exists on potential “bottom-up” or efforts to project the occurrence of blooms into the future and to
“top-down” regulation of blooms in supraglacial environments, constrain bloom impacts to cycles of C and macro-nutrients.
restricting abilities to project bloom occurrence into the future
(Williamson et al., 2019; McCutcheon et al., 2021). Within
the marine environment, for example, top-down pressures MATERIALS AND METHODS
such as zooplankton grazing and/or bottom-up availability of
nutrients represent fundamental controls on phytoplankton Study Area and Sampling Details
biomass (Huppert et al., 2002). Supraglacial environments Surface ice containing glacier algal assemblages was sampled
are characterized by truncated, microbially dominated trophic across August 8–10 (total number of samples = 28) from the
structures (Anesio and Laybourn-Parry, 2012; Anesio et al., marginal ablation zone in the south western GrIS proximal to
2017) and highly oligotrophic conditions (Hawkings et al., 2016; Point 660. For all samples, the top 2 cm of surface ice was
Wadham et al., 2016), indicating that large potential exists for sampled using a pre-cleaned ice saw, transferred into sterile
bottom-up limitation of glacier algal blooms. Whirl-Pak bags (Madison, WI, United States), and melted
R
To date, field observations of ambient hydrochemistry during slowly in the dark over 24 h at 4◦ C. The melted surface ice was
bloom progression have demonstrated a bulk phase shift toward subsequently homogenized and sub-sampled for further analyses
organic over inorganic nutrient resources within surface ice including 1 mL sub-sampled into 15 mL centrifuge tubes and
(Holland et al., 2019), which coupled with 28-times lower fixed immediately with 2% glutaraldehyde final concentration
secondary production relative to primary production (Yallop for subsequent algal cell enumeration; triplicate 100–200 mL
et al., 2012; Nicholes et al., 2019) has been interpreted to subsamples filtered onto pre-combusted 25 mm diameter glass
Frontiers in Plant Science | www.frontiersin.org 2 June 2021 | Volume 12 | Article 673614Williamson et al. Glacier Algal Cellular Stoichiometry
microfiber filters (0.7 µm retention; Thermo Fisher Scientific, retained sample:extractant) of 1 M magnesium chloride (MgCl2 ;
Pittsburgh, PA, United States), frozen immediately at −20◦ C Thermo Fisher Scientific), agitated at 200 rpm on a reciprocal
for subsequent determination of glacier algal C, N content; and shaker for 16 h and centrifuged at 1,217 × g at 0◦ C for 12 min.
duplicate 100–200 mL subsamples filtered onto pre-combusted An aliquot of 1.5 mL from the resulting extracts was transferred
47 mm diameter glass microfiber filters (0.7 µm retention; to a 9 mL muffled digest tube, mixed with 0.5 mL of an oxidizing
Thermo Fisher Scientific, Pittsburgh, PA, United States), frozen agent comprised of 9 g of NaOH and 40 g of potassium persulfate
immediately at −20◦ C for subsequent determination of glacier (K2 S2 O8 ; Thermo Fisher Scientific) in 1 L of Milli-Q water,R
algal P content. All samples were transported back to the and autoclaved for 60 min at 121◦ C (digested). The undigested
University of Bristol for subsequent processing. and digested MgCl2 extracts pertaining to both the unfumigated
and CHCl3 -fumigated filters were then filtered to 0.45 µm
Algal Cell Enumeration and Cell using mixed cellulose ester membranes (Whatman , Maidstone,
R
United Kingdom). Concentrations of Pi and Pt were determined
Biovolume Estimation
in the undigested and digested MgCl2 extracts, respectively,
Algal abundance (cells mL−1 ) was determined using methods
using a standard orthophosphate colorimetric technique on a
described by Williamson et al. (2018) on 1 mL aliquots of melted
photometric meter (GalleryTM Plus Discrete Analyzer, Thermo
surface ice using a modified Fuchs-Rosenthal hemocytometer
Fisher Scientific, Waltham, MA, United States). The CV (six
(0.2 mm by 1/16 mm2 ; Hawksley, Lancing, United Kingdom)
replicate mid-range standards) for Pi and Pt were ≤0.20%. In
on a Leica M205 C stereomicroscope (Wetzlar, DE) with
addition, the limits of detection (LoD; three times the standard
attached GXCAM HiChrome-Met HD microscope camera (GT
deviation of six replicate method blanks) for Pi and Pt were
Vision Ltd., Stansfield, United Kingdom). Glacier algal cellular
4.73 µg L−1 and 1.93 µg L−1 , respectively. Samples were blank
biovolume (µm3 ) was determined from measurements of cell
corrected when blank concentrations exceeded the detection
length and diameter taken using ImageJ software (version 1.52n),
limits. All reagents used were of analytical grade. Algal Pi and
for which glacier algal cells were considered to be regular
Pt were calculated, respectively, as the differences between P
cylinders (Hillebrand et al., 1999).
concentrations in the undigested and digested MgCl2 extracts for
the CHCl3 -fumigated and unfumigated filters within each pair.
Algal Carbon and Nitrogen
Using methods outlined by Lorrain et al. (2003), the C (after Ambient Chemistry
the removal of carbonates by acid fumigation) and N content Concentrations of dissolved organic C (DOC) and dissolved
of glacier algae retained on 25 mm diameter glass microfiber total N (DTN) in filtered ice samples were determined on a
filters (0.7 µm retention; Thermo Fisher Scientific, Pittsburgh, total organic C analyzer (Shimadzu TOC-LCPH , Kyoto, Japan)
PA, United States), which had been freeze-dried over 24 h, coupled with a total N measuring unit (Shimadzu TNM-L). The
were determined using an elemental analyzer (Elementar vario ammonium-N (NH4 + -N), nitrate-N (NO3 − -N), and phosphate-
PYRO cube , Langenselbold, Hesse, DE). The detection limits
R
P (PO4 3− -P) contents of the same samples were quantified
of elemental concentrations were 0.001% for both elements on a photometric meter (GalleryTM Plus Discrete Analyzer).
measured, and the coefficient of variation (CV) for C and N According to six replicate standards, the CV for the DOC,
according to six replicates of an organic analytical standard (NC DTN, NH4 + -N, NO3 − -N, and PO4 3− -P analyses were 3.71%,
Soil Standard 338 40025, cert. 133317, C = 2.29%, N = 0.21%; 7.38%, 0.20%, 0.26%, and 0.35%, respectively. The corresponding
Elemental Microanalysis Ltd., United Kingdom) were 5.60% detection limits for the same analyses were 51.40 µg L−1 ,
and 2.74%, respectively. To determine the quantity of C and 39.12 µg L−1 , 1.19 µg L−1 , 3.13 µg L−1 , and 4.95 µg L−1 .
N associated with algal biomass (µg mL−1 of surface ice), the Dissolved organic N (DON) was calculated for each sample as
bulk glacier algal abundance (cells mL−1 ) was multiplied by the the difference between concentrations of DTN and dissolved
quantity of cellular C and N (µg cell−1 ). inorganic N (DIN; sum of NH4 + -N and NO3 − -N).
Algal Phosphorus Data Analyses
Concentrations of total P (Pt ) and Pi associated with glacier All plots and statistical analyses were performed using R version
algae were determined using methods adapted from Hedley and 3.4.1 in accordance with methods outlined by Crawley (2005).
Stewart (1982) and Stibal et al. (2008). Paired 47 mm diameter
glass microfiber filters (0.7 µm retention) were added to separate
pre-cleaned 15 mL polypropylene centrifuge tubes (Thermo RESULTS
Fisher Scientific), frozen at −80◦ C and subsequently freeze-dried
for 24 h. After freeze-drying, 1 mL of ethanol-free chloroform Ambient Chemistry of Surface Ice
(CHCl3 ; Thermo Fisher Scientific) was added to one from each Major C and macro-nutrient phases were determined for GrIS
pair of centrifuge tubes. These tubes were then agitated three surface ice from which glacier algal assemblages were sampled
times for 10 s using a vortex mixer at 15 min intervals before to provide contextual hydrochemistry information to contrast
being placed under a fume hood for 24 h to allow the CHCl3 with glacier algal cellular stoichiometries. Dissolved nutrient
to evaporate. Both the unfumigated and CHCl3 -fumigated filters phases measured from melted surface ice were dominated by
from each pair were then amended with 6 mL (∼ 1:60 w/v organic phases (Table 1), with the majority comprised of DOC,
Frontiers in Plant Science | www.frontiersin.org 3 June 2021 | Volume 12 | Article 673614Williamson et al. Glacier Algal Cellular Stoichiometry
TABLE 1 | Concentrations of dissolved organic carbon (DOC), total dissolved nitrogen (DTN), organic nitrogen (DON), ammonium-nitrogen (NH4 + -N), nitrate-nitrogen
(NO3 − -N), and phosphate-phosphorus (PO4 3− -P) in surface ice from the south western margin of the Greenland Ice Sheet (GrIS) during the 2019 ablation season
(mean ± standard error, n = 12).
DOC (µg L−1 ) DTN (µg L−1 ) DON (µg L−1 ) NH4 + -N (µg L−1 ) NO3 − -N (µg L−1 ) PO4 3− -P (µg L−1 )
1,964 ± 162 113 ± 27 108 ± 27 2.8 ± 1.4 1.6 ± 1.1* 0.9 ± 0.4*
*Below limit of detection (three times the standard deviation of six replicate method blanks).
which exhibited concentrations ∼ 18 times greater than DON. In classic Redfield stoichiometry, and we are able to estimate glacier-
contrast, the concentrations of dissolved inorganic nutrients fell algal-associated macro-nutrient reservoirs within this highly
at or below the LoD. Dissolved inorganic N was only measurable oligotrophic environment.
in the form of NH4 + and accounted for ∼ 4% of the DTN, while The absolute cellular macronutrient content of glacier algal
PO4 3− -P concentrations were below the LoD in all cases. assemblages fell within the range of values reported across a
diversity of algal lineages (Montagnes et al., 1994), though they
Assemblage Characteristics deviated from cell-constituent:volume relationships established
Glacier algal assemblages ranged in abundance from 0 to across microalgal taxa. For example, glacier algal cellular C and
8.97 × 10⁵ cells mL−1 and were comprised predominantly N content averaged 106 ± 35 pg C cell−1 and 4.5 ± 1.3 pg
of Ancylonema cf. nordenskiöldii (67.9%) and cf. Mesotaenium N cell−1 for cell volumes that ranged ∼ 2,000–3,000 µm3 .
berggrenii (31.7%; Figure 1A). Mean cellular biovolumes for A. While absolute cellular contents were within the range reported
cf. nordenskiöldii and cf. M. berggrenii were 2,788 ± 121 µm3 across a host of microalgae (Montagnes et al., 1994; Finkel
cell−1 and 2,197 ± 131 µm3 cell−1 , respectively (Figure 1B). In et al., 2016), values were conspicuously lower than would be
contrast, fewer than 1% of cells were identified as Cylindrocystis predicted using established cell-constituent:volume ratios for
brebissonii, though mean cellular biovolumes of these cells were cells of their size, whereby 2,000–3,000 µm3 cells would be
an order of magnitude larger than A. cf. nordenskiöldii and cf. expected to contain 203–304 pg C cell−1 and 40–62 pg N cell−1 ,
M. berggrenii (Figure 1B). respectively (Montagnes et al., 1994). Glacier algal cellular C was
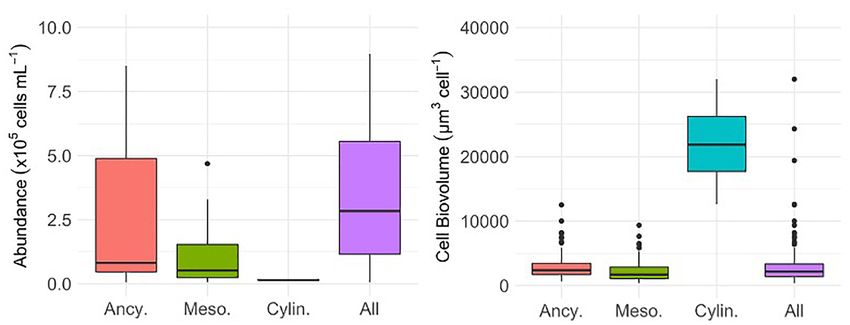
Cellular C and N contents of glacier algal assemblages thus approximately half that expected based on cell volume, with
averaged 106 ± 35 pg C cell−1 and 4.5 ± 1.3 pg N cell−1 , cellular N an order of magnitude lower.
respectively (Figures 2A,B), with cellular atomic C:N ratios Laboratory and field studies have consistently identified
ranging from 15.6 to 40.8. Using measured values of cellular species-level differences in microalgal elemental requirements
C and N, we estimate an average of 27.4 ± 6.0 µg C mL−1 that reflect evolutionary histories and acclimation to
and 1.2 ± 0.25 µg N mL−1 to be contained within glacier environmental conditions (Geider and La Roche, 2002; Finkel
algal biomass within the surface ice environment during our et al., 2016; Garcia et al., 2018). Such differences are a product
sampling period. In contrast to cellular C and N, quantifying of the adaptations of cellular architecture and biochemistry
algal P presented challenges as concentrations fell below the that correspond to changes in macromolecular composition,
limit of detection (LoD), with Pt and Pi only detectable in seven with protein the primary reservoir of cellular N, phospholipids,
and four of 28 samples, respectively. Across these, mean Pt is polyphosphates, and nucleic acids the reservoirs of cellular P,
0.14 ± 0.09 pg cell−1 (Figure 2C). If organic P is defined as and cellular C largely determined by the combination of protein,
the difference between mean concentrations of Pt and Pi , we lipid, and carbohydrate (Geider and La Roche, 2002; Finkel
determined that up to 86% of algal P may be contained within the et al., 2016; Barcyte et al., 2020). In this respect, lower cellular
organic phase (∼ 0.12 pg cell−1 ). Using the mean Pt , we estimate requirements for C and N may reflect adaptation of Streptophyte
the atomic C:N:P stoichiometry of glacier algal assemblages to glacier algae to their oligotrophic surface ice environment;
be 1,997:73:1; however, given the difficulty in detecting cellular documented here and in numerous previous works to be highly
P, this ratio should be considered with caution. deficient in inorganic nutrient supplies (Table 1; Hawkings
et al., 2016; Wadham et al., 2016; Holland et al., 2019). It may
also reflect the lower growth rates of glacier algal communities
DISCUSSION from icy environments (∼ 5 days doubling time; Stibal et al.,
2017; Williamson et al., 2018) compared to more temperate
Understanding the macronutrient requirements of glacier algal microalgal taxa (e.g., Garcia et al., 2018), whereby species with
cells is an important first step on the way to constraining lower growth rates have associated lower protein, and thus N,
potential bottom-up controls, which may ultimately restrict content (Finkel et al., 2016). Finally, divergence from typical
bloom magnitude and extent (McCutcheon et al., 2021). The cell volume:constituent relationships may also reflect the highly
present study examined the C, N, and P content of glacier vacuolized nature of glacier algal cells, which results in an overall
algal assemblages sampled during the mid-2019 ablation season higher water content compared to many other algae (Remias
(early August) from the southwestern margin of the GrIS, et al., 2009, 2012a). Separating the phylogenetic signature of
providing a direct measurement of glacier algal cellular macro- microalgal elemental requirements from e.g., dynamic responses
nutrient content and stoichiometry. Through this we identify to in situ nutrient regimes (see below) is ideally achieved
deviation from standard cell-constituent:volume ratios and through the assessment of actively growing microalgal cells
Frontiers in Plant Science | www.frontiersin.org 4 June 2021 | Volume 12 | Article 673614Williamson et al. Glacier Algal Cellular Stoichiometry
FIGURE 1 | The abundance (A) and cellular biovolume (B) of Ancylonema cf. nordenskiöldii (Ancy., n = 19 abundance, n = 215 biovolume), cf. Mesotaenium
berggrenii (Meso., n = 20 abundance and n = 140 biovolume), Cylindrocystis brebissonii (Cylin., n = 2 abundance, n = 5 biovolume), and the total glacier algal
assemblage (All, n = 21 abundance n = 360 biovolume) sampled in surface ice from the south western margin of the Greenland Ice Sheet (GrIS) during the mid-2019
ablation season. Plots show median ± interquartile range.
FIGURE 2 | Cellular concentrations of (A) carbon (C, n = 28), (B) nitrogen (N, n = 28), (C) total phosphorus (Pt , n = 4), and (C) inorganic phosphorus (Pi , n = 4) of
glacier algal assemblages comprised of Ancylonema cf. nordenskiöldii, cf. Mesotaenium berggrenii, and Cylindrocystis brebissonii in surface ice from the south
western margin of the Greenland Ice Sheet (GrIS) during the mid-2019 ablation season. Plots show median ± interquartile range.
cultured under nutrient replete conditions (Geider and La for 15 marine eukaryote species (∼ 9.1–250 mmol P L−1 cell
Roche, 2002; Finkel et al., 2016). To date, however, an inability volume; see Table 2 in Ho et al., 2003), though likely reflects the
to culture glacier algal taxa ex situ has hindered advances in our nutrient deplete conditions under which glacier algal assemblages
understanding of their physiology and interactions with key grow. For example, the cyanobacterium Microcystis aeruginosa
environmental stressors (Williamson et al., 2019), necessitating demonstrated much lower cellular P content ranging from 0.2
field-based approaches as here. to 1.2 pg P cell−1 when cultured under ambient P conditions
In contrast to C and N contents, measurement of cellular that ranged 0–256 µg P L−1 , with lower intracellular content
P from glacier algal assemblages proved challenging, with few associated with lower ambient P availability (Ghaffar et al.,
samples yielding detectable concentrations. This was consistent 2017). Similarly, for more closely related planktonic desmid
with our aqueous hydrochemistry data whereby all dissolved species (Zygnematophyceae), Spijkerman and Coesel (1996)
PO4 3− -P concentrations from melted surface ice samples fell demonstrated how Cosmarium abbreviatum var. planctonicum
below the LoD (LoD = 4.95 µg L−1 ). For glacier algae, just four originating from an oligo-meso-trophic lake was consistently
of 28 samples yielded quantifiable P, with a mean Pt content capable of greater biomass production for a given amount of P
of 0.14 ± 0.09 pg P cell−1 across samples. To compare to (across the range 0.5–10 µmol P l−1 ) than Staurastrum pingue,
published values for major marine phyla (Ho et al., 2003), a which originated from a eutrophic lake. Cellular P content ranged
glacier algal cell volume of 2,500 µm3 was applied to convert to 0.2–2.17 pg P cell−1 , comparable to values reported here for
units of mmol P per liter cell volume (mmol L−1 cell volume), glacier algae, with C. planctonicum shown to be an affinity species,
yielding ∼ 1.50 mmol P L−1 cell volume for our glacier algal possessing a competitive advantage in an environment where
assemblages. This is substantially lower than values reported growth is permanently P limited (Spijkerman and Coesel, 1996).
Frontiers in Plant Science | www.frontiersin.org 5 June 2021 | Volume 12 | Article 673614Williamson et al. Glacier Algal Cellular Stoichiometry
While limited in sample size, our data demonstrate how glacier and C:P ratios than predicted by Redfield stoichiometry, and
algal macro-nutrient content broadly reflects ambient inorganic typically conclusion that the community under study is nutrient
nutrient availability within surface ice habitats of the GrIS, and limited (Berman-Frank, 1999; Dickman et al., 2006). For glacier
suggests an overall lower cellular macro-nutrient requirement algae residing within the high-light surface ice environment, it
likely advantageous in the ultra-oligotrophic supraglacial. These is likely that their abundant secondary phenolic pigmentation
findings are consistent with recent advances in understanding contributes to the elevated C:N and C:P ratios recorded here.
potential bottom-up controls on glacier algal bloom proliferation This C-rich pigmentation is required to protect the cells against
(McCutcheon et al., 2021). excess irradiance and provide a mechanism to convert abundant
Assessment of glacier algal cellular macro-nutrient quotients light energy into heat in order to liberate meltwater adjacent
allowed for a first order approximation of organic C and N stocks to the cell (Remias et al., 2012b; Dial et al., 2018; Williamson
within assemblages inhabiting our sampling location on the et al., 2018, 2020), likely also acting as an effective sink for excess
marginal southwestern GrIS. Based on cellular C and N contents photosynthate. However, given the characteristic oligotrophy
and abundances recorded across our samples, we calculated an of surface ice environments (Holland et al., 2019), and the
average of 27.4 ± 6.0 µg C mL−1 and 1.2 ± 0.25 µg N mL−1 contrasting ability of glacier algae to form widespread blooms
to be contained within glacier algal cells within our marginal under such conditions cryosphere wide (Williamson et al., 2019),
sampling location. Upscaling from these point observations to we argue that our low absolute macro-nutrient content and
the km2 scale (i.e., µg C or N mL−1 × 1.061 = kg C or N elevated C:N and C:P ratios also likely signify overall reduced
km2 , after Williamson et al., 2018) provides an estimate of ∼ requirements for N and P resources by glacier algal communities,
29.0 kg C km2 and ∼ 1.2 kg N km2 stored within glacier algal a potentially key adaptation to life in oligotrophic surface ice.
assemblages inhabiting surface ice at the mid-ablation season This assertion is consistent with the findings of McCutcheon
(early August). Previously, Williamson et al. (2018) modeled et al. (2021), who though concluding mineral phosphorus to be a
glacier algal net production in southwestern Greenland forced first order control on glacier algal bloom presence, demonstrated
by the number of days since snowline retreat. They estimated that responses to nutrient addition (specifically phosphorous)
an overall average of 15.82 ± 8.14 kg C km2 produced by were only evident in incubated field assemblages after 5 days
glacier algal assemblages across their 8.24 × 10⁴ km2 model of incubation, suggesting sufficient nutrient resources for glacier
region during the 2016 ablation period, with spatial variability algal growth under ambient conditions. For context, this study
ranging fromWilliamson et al. Glacier Algal Cellular Stoichiometry
by a glacier algal bloom further into the southwestern GrIS, was amassed by glacier algal assemblages by the middle of
with DOC:DON ranging 16–17 and DOC:DOP ranging 800– the 2019 ablation season. While the long-term fate of these
2,000. For that same 2016 glacier algal bloom, Nicholes et al. nutrient reservoirs remains unconstrained, our findings indicate
(2019) further demonstrated how bacterial secondary production the potential for comparatively low quality (i.e., low N and P
was on average 28 times lower than rates of glacier algal content) dissolved organic matter release into the surface ice
primary production, indicating an inefficient microbial loop by glacier algal assemblages, with consequences for associated
potentially limited by N and P resources (Holland et al., 2019; heterotrophic activity.
Nicholes et al., 2019). It is thus likely that glacier algal cellular
stoichiometry is reflected in the quality of dissolved organic
matter available within surface ice environments during blooms DATA AVAILABILITY STATEMENT
and may potentially limit the activity of associated communities.
Constraining the short-term (within season) and long-term The raw data supporting the conclusions of this article will be
(inter-annual) fate of glacier algal autochthonous organic carbon made available by the authors, without undue reservation.
and macro-nutrient production within surface ice will be the next
step toward understanding their role as the dominant primary
producer within supraglacial systems, and their wider impacts to AUTHOR CONTRIBUTIONS
biogeochemical cycling.
CW led the design of the study and completed all fieldwork. TT-J
carried out all laboratory work. TT-J and MN performed the data
analysis. All authors contributed to the manuscript.
CONCLUSION
We provide here a snapshot of glacier algal cellular macro- FUNDING
nutrient content and stoichiometry from assemblages sampled
during the mid-ablation season at the ice margin of the This work was funded as part of the UK Natural
southwestern GrIS. Our findings highlight comparatively lower Environment Research Council Consortium Grant “Black
cellular C, N, and P absolute content in glacier algal cells that and Bloom” (NE/M021025/1). CW acknowledges support
deviates from standard cellular content:biovolume relationships, from The Leverhulme Trust Research Project Grant
and high C:N and C:P ratios that likely reflect adaptation to “iDAPT” (RPG-2020-199).
this highly oligotrophic surface ice environment as well as the
dominance of abundant secondary phenolic pigmentation within
glacier algal cells. Based on these observations, we confirm the ACKNOWLEDGMENTS
role of glacier algal blooms in the most marginal region of the
ice sheet in driving autochthonous macro-nutrient accumulation, We would like to recognize Dr. Fotis Sgouridis for providing
estimating that approximately 29 kg C km2 and 1.2 kg N km2 guidance relating to elemental concentrations.
REFERENCES Dickman, E. M., Vanni, M. J., and Horgan, M. J. (2006). Interactive effects of
light and nutrients on phytoplankton stoichiometry. Oecologia 149, 676–689.
Anesio, A. M., and Laybourn-Parry, J. (2012). Glaciers and ice sheets as a biome. doi: 10.1007/s00442-006-0473-5
Trends Ecol. Evol. 27, 219–225. Finkel, Z. V., Follows, M. J., Liefer, J. D., Brown, C. M., Benner, I., and Irwin,
Anesio, A. M., Lutz, S., Chrismas, N. A. M., and Benning, L. G. (2017). The A. J. (2016). Phylogenetic diversity in the macromolecular composition of
microbiome of glaciers and ice sheets. Npj Biofilms Microbiomes 3:10. microalgae. PLoS One 11:e0155977. doi: 10.1371/journal.pone.0155977
Bamber, J. L., Westaway, R. M., Marzeion, B., and Wouters, B. (2018). The land ice Garcia, N. S., Sexton, J., Riggins, T., Brown, J., Lomas, M. W., and Martiny,
contribution to sea level during the satellite Era. Environ. Res. Lett. 13:063008. A. C. (2018). High Variability In Cellular Stoichiometry Of Carbon, Nitrogen,
doi: 10.1088/1748-9326/aac2f0 And Phosphorous Within Classes Of Marine Eukaryotic Phytoplankton Under
Barcyte, D., Pilátová, J., Mojzeš, P., and Nedbalová, L. (2020). The arctic Sufficient Nutrient Conditions. Front. Microbiol. 9:543.
Cylindrocystis (Zygnematophyceae, Streptophyta) green algae are genetically Geider, R. J., and La Roche, J. (2002). Redfield revisited: variability of C:N:P in
and morphologically diverse and exhibit effective accumulation of marine microalgae and its biochemical basis. Eur. J. Phycol. 37, 1–17. doi:
polyphosphate. J. Phycol. 56, 217–232. doi: 10.1111/jpy.12931 10.1017/s0967026201003456
Berman-Frank, I. (1999). Balanced growth in aquatic plants: myth or reality? Ghaffar, S., Stevenson, R. J., and Khan, Z. (2017). Effect of phosphorous stress on
phytoplankton use the imbalance between carbon assimilation and biomass Microcystis aeruginosa growth and phosphorous uptake. PLoS One 12:e0174349.
production to their strategic advantage. BioScience 49, 29–37. doi: 10.2307/ doi: 10.1371/journal.pone.0174349
1313491 Hawkings, J., Wadham, J., Tranter, M., Telling, J., and Bagshaw, E. (2016). The
Cook, J. M., Tedstone, A. J., Williamson, C. J., McCutcheon, J., Hodson, A., greenland ice sheet as a hot spot of phosphorus weathering and export in the
Dayal, A., et al. (2020). Glacier algae accelerate melt rates on the south-western arctic. Global Biogeochem. Cycles 30, 191–210. doi: 10.1002/2015gb005237
greenland ice sheet. Cryosphere 14, 309–330. doi: 10.5194/tc-14-309-2020 Hecky, R. E., Campbell, P., and Hendzel, L. L. (1993). The stoichiometry of carbon,
Crawley, M. J. (2005). Statistics: an Introduction Using R. Chichester, UK: John nitrogen, and phosphorus in particulate matter of lakes and oceans. Limnol.
Wiley & Sons, Ltd. Oceanogr. 38, 709–724. doi: 10.4319/lo.1993.38.4.0709
Dial, R. J., Ganey, G. Q., and Skiles, M. (2018). What color should glacier algae Hedley, M. J., and Stewart, J. W. B. (1982). Method to measure microbial
be? an ecological role for red carbon in the cryosphere. FEMS Microbiol. Ecol. phosphate in soils. Soil Biol. Biochem. 14, 377–385. doi: 10.1016/0038-0717(82)
94:fiy007. 90009-8
Frontiers in Plant Science | www.frontiersin.org 7 June 2021 | Volume 12 | Article 673614Williamson et al. Glacier Algal Cellular Stoichiometry Hessen, D. O., and Anderson, T. R. (2008). Excess carbon in aquatic organisms and Ryan, J. C., Smith, L. C., van As, D., Cooley, S. W., Cooper, M. G., Pitcher, L. H., ecosystems: physiological, ecological, and evolutionary implications. Limnol. et al. (2019). Greenland ice sheet surface melt amplified by snowline migration Oceanogr. 53, 1685–1696. doi: 10.4319/lo.2008.53.4.1685 and bare ice exposure. Sci. Adv. 5:eaav3738. doi: 10.1126/sciadv.aav3738 Hillebrand, H., Dürselen, C. D., Kirschtel, D., Pollingher, U., and Zohary, T. Spijkerman, E., and Coesel, P. F. M. (1996). Phosphorous uptake and growth (1999). Biovolume calculation for pelagic and benthic microalgae. J. Phycol. 35, kinetics of two planktonic desmid species. Eur. J. Phycol. 31, 53–60. doi: 403–424. doi: 10.1046/j.1529-8817.1999.3520403.x 10.1080/09670269600651191 Ho, T. Y., Quigg, A., Finkel, Z. V., Milligan, A. J., Wyman, K., Falkowski, P. G., et al. Sterner, R. W., Elser, J. J., Fee, E. J., Guildford, S. J., and Chrzanowski, T. H. (2003). The elemental composition of some marine phytoplankton. J. Phycol. (1997). The light:nutrient ratio in lakes: the balance of energy and materials 39, 1145–1159. affects ecosystem structure and process. Am. Nat. 150, 663–684. doi: 10.1086/28 Hodson, A., Anesio, A. M., Tranter, M., Fountain, A., Osborn, M., Priscu, J., et al. 6088 (2008). Glacial ecosystems. Ecol. Monogr. 78, 41–67. Stibal, M., Box, J. E., Cameron, K. A., Langen, P. L., Yallop, M. L., Mottram, H., Hodson, A., Boggild, C., Hanna, E., Hyubrechts, P., Langfort, H., Cameron, K., et al. (2017). Algae drive enhanced darkening of bare ice on the greenland ice et al. (2010). The cryoconite ecosystem on the greenland ice sheet. Ann. Glaciol. sheet. Geophys. Res. Lett. 44, 11463–11471. 51, 123–129. doi: 10.3189/172756411795931985 Stibal, M., Telling, J., Cook, J., Mak, K. M., Hodson, A., Anesio, A. M., et al. Holland, A. T., Williamson, C. J., Sgouridis, F., Tedstone, A. J., McCutcheon, (2012). Environmental controls on microbial abundance and activity on the J., Cook, J. M., et al. (2019). Dissolved organic nutrients dominate melting greenland ice sheet: a multivariate analysis approach. Microb. Ecol. 63, 74–84. surface ice of the dark zone (Greenland ice sheet). Biogeosciences 16, 3283–3296. doi: 10.1007/s00248-011-9935-3 doi: 10.5194/bg-16-3283-2019 Stibal, M., Tranter, M., Telling, J., and Benning, L. G. (2008). Speciation, phase Huppert, A., Blasius, B., and Stone, L. (2002). A model of phytoplankton blooms. association and potential bioavailability of phosphorus on a svalbard glacier. Am. Nat. 159, 156–171. Biogeochemistry 90, 1–13. doi: 10.1007/s10533-008-9226-3 James, G. O., Hocart, C. H., Hillier, W., Chen, H., Kordbacheh, F., Price, G. D., Talmy, D., Blackford, J., Hardman-Mountford, N. J., Polimene, L., Follows, M. J., et al. (2011). Fatty acid profiling of Chlamydomonas reinhardtii under nitrogen and Geider, R. J. (2014). Flexible C: N ratio enhances metabolism of large deprivation. Bioresour. Technol. 102, 3343–3351. doi: 10.1016/j.biortech.2010. phytoplankton when resource supply is intermittent. Biogeosciences 11, 4881– 11.051 4895. doi: 10.5194/bg-11-4881-2014 Lorrain, A., Savoye, N., Chauvaud, L., Paulet, Y. M., and Naulet, N. (2003). Tedesco, M., Doherty, S., Fettweis, X., Alexander, P., Jeyaratnam, J., and Stroeve, Decarbonation and preservation method for the analysis of organic C and J. (2016). The darkening of the greenland ice sheet: trends, drivers, and N contents and stable isotope ratios of low-carbonated suspended particulate projections (1981-2100). Cryosphere 10, 477–496. doi: 10.5194/tc-10-477- material. Anal. Chim. Acta 491, 125–133. doi: 10.1016/s0003-2670(03)00815-8 2016 McCutcheon, J., Lutz, S., Williamson, C., Cook, J. M., Tedstone, A. J., Tedstone, A. J., Bamber, J. L., Cook, J. M., Williamson, C. J., Fettweis, X., Hodson, Vanderstraeten, A., et al. (2021). Mineral phosphorous drives glacier algal A. J., et al. (2017). Dark ice dynamics of the south-west Greenland Ice Sheet. blooms on the greenland ice sheet. Nat. Commun. 12:570. Cryosphere 11, 2491–2506. doi: 10.5194/tc-11-2491-2017 Montagnes, D. J. S., Berges, J. A., Harrison, P. J., and Taylor, F. J. R. (1994). Tedstone, A. J., Cook, J. M., Williamson, C. J., Hofer, S., McCutcheon, J., Irvine- Estimating Carbon, Nitrogen, Protein, and Chlorophyll a from volume in Fynn, T., et al. (2020). Algal growth and weathering crust state drive variability marine phytoplankton. Limnol. Oceanogr. 39, 1044–1060. doi: 10.4319/lo.1994. in Western Greenland Ice sheet ice albedo. Cryosphere 14, 521–538. doi: 10. 39.5.1044 5194/tc-14-521-2020 Musilova, M., Tranter, M., Wadham, J., Telling, J., Tedstone, A., and Anesio, A. M. van den Broeke, M., Box, J., Fettweis, X., Hanna, E., Noel, B., Tedesco, M., (2017). Microbially driven export of labile organic carbon from the greenland et al. (2017). Greenland ice sheet surface mass loss: recent developments in ice sheet. Nat. Geosci. 10, 360–365. doi: 10.1038/ngeo2920 observation and modelling. Curr. Climate Chang. Rep. 3, 345–356. doi: 10.1007/ Nicholes, M. J., Williamson, C. J., Tranter, M., Holland, A., Poniecka, E., Yallop, s40641-017-0084-8 M. L., et al. (2019). Bacterial dynamics in supraglacial habitats of the greenland Wadham, J. L., Hawkings, J., Telling, J., Chandler, D., Alcock, J., and Lawson, E. ice sheet. Front. Microbiol. 10:1366. (2016). Sources, cycling and export of nitrogen on the Greenland ice sheet. Palmucci, M., Ratti, S., and Giordano, M. (2011). Ecological and evolutionary Biogeoscience 13, 6339–6352. doi: 10.5194/bg-13-6339-2016 implications of carbon allocation in marine phytoplankton as a function Williamson, C. J., Anesio, A. M., Cook, J., Tedstone, A., Poniecka, E., Holland, A., of nitrogen availability: a fourier transform infrared spectroscopy approach. et al. (2018). Ice algal bloom development on the surface of the Greenland ice J. Phycol. 47, 313–323. doi: 10.1111/j.1529-8817.2011.00963.x sheet. FEMS Microbiol. Ecol. 94:fiy025. Pichrtová, M., Kulichová, J., and Holzinger, A. (2014). Nitrogen limitation Williamson, C. J., Cameron, K. A., Cook, J. M., Zarsky, J. D., Stibal, M., and and slow drying induce desiccation tolerance in conjugating green algae Edwards, A. (2019). Glacier algae: a dark past and a darker future. Front. (Zygnematophyceae, Streptophyta) from polar habitats. PLoS One 9:e113137. Microbiol. 10:524. doi: 10.1371/journal.pone.0113137 Williamson, C. J., Cook, J. M., Tedstone, A., Yallop, M. L., McCutcheon, J., Quigg, A., Finkel, Z. V., Irwin, A. J., Rosenthal, Y., Ho, T.-Y., Reinfelder, J. R., Poniecka, E., et al. (2020). Algal photophysiology drives darkening and melt et al. (2003). The evolutionary inheritance of elemental stoichiometry in marine of the Greenland ice sheet. Proc. Natl. Acad. Sci. USA 117, 5694–5705. doi: phytoplankton. Nature 425, 291–294. doi: 10.1038/nature01953 10.1073/pnas.1918412117 Redfield, A. C. (1958). The biological control of chemical factors in the Yallop, M. L., Anesio, A. M., Perkins, R. G., Cook, J. M., Telling, J., Fagan, D., environment. Am. Sci. 46, 205–221. et al. (2012). Photophysiology and Albedo-changing potential of the ice algal Remias, D., Holzinger, A., Aigner, S., and Lutz, C. (2012a). Ecophysiology and community on the surface of the Greenland ice sheet. ISME J. 6, 2302–2313. ultrastructure of Ancylonema nordenskiöldii (Zygnematales, Streptophyta), doi: 10.1038/ismej.2012.107 causing brown ice on glaciers in Svalbard (high arctic). Polar Biol. 35, 899–908. doi: 10.1007/s00300-011-1135-6 Conflict of Interest: The authors declare that the research was conducted in the Remias, D., Holzinger, A., and Lütz, C. (2009). Physiology, ultrastructure absence of any commercial or financial relationships that could be construed as a and habitat of the ice alga Mesotaenium berggrenii (Zygnematophyceae, potential conflict of interest. Chlorophyta) from glaciers in the European Alps. Phycologia 48, 302–312. doi: 10.2216/08-13.1 Copyright © 2021 Williamson, Turpin-Jelfs, Nicholes, Yallop, Anesio and Tranter. Remias, D., Schwaiger, S., Aigner, S., Leya, T., Stuppner, H., and Lütz, C. This is an open-access article distributed under the terms of the Creative Commons (2012b). Characterization of an UV- and VIS-Absorbing, purpurogallin- Attribution License (CC BY). The use, distribution or reproduction in other forums derived secondary pigment new to algae and highly abundant in Mesotaenium is permitted, provided the original author(s) and the copyright owner(s) are credited berggrenii (Zygnematophyceae, Chlorophyta), an extremophyte living on and that the original publication in this journal is cited, in accordance with accepted glaciers. FEMS Microbiol. Ecol. 79, 638–648. doi: 10.1111/j.1574-6941.2011. academic practice. No use, distribution or reproduction is permitted which does not 01245.x comply with these terms. Frontiers in Plant Science | www.frontiersin.org 8 June 2021 | Volume 12 | Article 673614
You can also read