Tailoring Activated Carbons for Efficient Downstream Processing: Selective Liquid-Phase Adsorption of Lysine
←
→
Page content transcription
If your browser does not render page correctly, please read the page content below
Full Papers
ChemSusChem                                        doi.org/10.1002/cssc.202000885

  Tailoring Activated Carbons for Efficient Downstream
  Processing: Selective Liquid-Phase Adsorption of Lysine
  Jeff Deischter, Nadja Wolter, and Regina Palkovits*[a]

  The essential amino acid lysine is of great importance in the                 mercial activated carbons with different textural properties and
  nutrition and pharmaceutical industries and is mainly pro-                    surface functionalities is investigated. Comprehensive adsorb-
  duced in biorefineries by the fermentation of glucose. In biore-              ent characterization establishes structure–adsorption relation-
  fineries, downstream processing is often the most energy-con-                 ships that define the major roles of the specific surface area
  suming step. Adsorption on hydrophobic adsorbents repre-                      and oxygen functionalities. A 13-fold increase of the separation
  sents an energy, resource, and cost-saving alternative. The re-               of lysine and glucose is achieved through systematic modifica-
  sults reported herein provide insights into the selective separa-             tion of a selected activated carbon by oxidation, and lysine ad-
  tion of l-lysine from aqueous solution by liquid-phase                        sorption is enhanced by 30 %.
  adsorption using tailored activated carbons. A variety of com-

  Introduction

  Biorefineries will be a fundamental part of the future sustaina-              resins are used to extract l-lysine from fermentation solutions
  ble bioeconomy because of the depletion of fossil resources                   and thereafter concentrated by evaporation and spray
  and global climate change. Therefore, it is crucial to explore al-            drying.[6]
  ternative, renewable sources of materials and develop innova-                    A major disadvantage of these methods is the resulting
  tive and efficient processes. A wide range of chemical building               saline eluents, which leads to an additional cost-intensive proc-
  blocks is already produced from renewable feedstocks, and                     essing step, high amounts of wastewater, and high energy
  many recent studies established pathways to broaden the                       costs.[7] In light of the climate crisis, the development of envi-
  portfolio of application for bio-based materials such as amino                ronmentally friendly, sustainable, and efficient separation pro-
  acids, aromatics, organic acids, and other monomers.[1] Amino                 cesses are necessary. Adsorption on hydrophobic adsorbents is
  acids, l-lysine in particular, play an essential role in the nutri-           an energy-, resource-, and cost-saving alternative for the recov-
  tion and pharmaceutical industries.[2] Its demand has been                    ery of components from aqueous media.[8] Several studies
  growing at 5–10 % per year with a production of 2.4 million                   have used zeolites for the selective liquid-phase adsorption of
  tons in 2015 and an amino acid market share of over 25 %.[3]                  amino acids.[9] Faisal et al. used zeolite-Y as an adsorbent for
  On an industrial scale, l-lysine is mainly produced by microbial              the recovery of l-arginine from model solutions and real fer-
  fermentation from sugar sources such as glucose, molasses,                    mentation broths.[9a] Moreover, MOFs were used by Jonckheere
  and sucrose using Corynebacterium glutamicum followed by                      et al. to separate amino acids such as l-phenylalanine, l-trypto-
  suitable downstream processing that involves classical separa-                phan, and l-tyrosine by liquid-phase adsorption.[10] Most re-
  tion methods.[1a, 2, 4] The selective separation and purification of          search on the adsorption of l-lysine from aqueous solutions
  l-lysine from aqueous fermentation broths are key steps to                    has been performed using adsorbents such as zeolites, miner-
  reduce the investment and production costs, which generally                   als, silica, or lignin beads that result in low adsorption capaci-
  account for 20–50 % of the total costs of biorefineries.[5] Tradi-            ties of approximately 60 mg g@1.[11] There have, however, only
  tionally, chromatographic methods based on ion exchange                       been a few studies in which activated carbons were used as
                                                                                adsorbents for amino acids, particularly for lysine.[12] Activated
  [a] J. Deischter, N. Wolter, Prof. Dr. R. Palkovits                           carbons are widely used adsorbents because of their large
      Institut fer Technische und Makromolekulare Chemie (ITMC)                 porous volumes that result in high specific surface areas and
      RWTH Aachen University
                                                                                their wide availability based on renewable carbonaceous or-
      Worringerweg 2, 52074 Aachen (Germany)
      E-mail: palkovits@itmc.rwth-aachen.de                                     ganic materials.[13] In addition, the physical and chemical prop-
     Supporting Information and the ORCID identification number(s) for the      erties of activated carbons can be tailored to enhance the af-
     author(s) of this article can be found under:                              finity towards desired compounds and can be utilized for spe-
     https://doi.org/10.1002/cssc.202000885.                                    cific applications.[14] The selective separation of lysine from glu-
     T 2020 The Authors. Published by Wiley-VCH Verlag GmbH & Co. KGaA.         cose by activated carbons and the structure–adsorption rela-
     This is an open access article under the terms of the Creative Commons
                                                                                tionship has, to date and to the best of our knowledge, not
     Attribution Non-Commercial License, which permits use, distribution and
     reproduction in any medium, provided the original work is properly         yet been discussed in literature. However, a fundamental un-
     cited and is not used for commercial purposes.                             derstanding of adsorbent properties that influence adsorption

  ChemSusChem 2020, 13, 3614 – 3621                                          3614   T 2020 The Authors. Published by Wiley-VCH Verlag GmbH & Co. KGaA, Weinheim
Full Papers
ChemSusChem                                           doi.org/10.1002/cssc.202000885

  capacity and selectivity is a prerequisite for targeted material                         pected temperature ranges for CO and CO2 release in the TPD
  design.                                                                                  measurements are shown in Figure 1 a. A comprehensive as-
     In this study, we investigate the selective separation of                             signment of CO and CO2 desorption profiles to some oxygen
  lysine and glucose by using tailored activated carbons as ad-                            functionalities for an example carbon (Silcarbon CW20) is given
  sorbents. The influence of crucial parameters such as the pH                             in Figure 1 b. In the CO profile of the carbon, a large peak ap-
  value is investigated. A variety of commercial activated carbons                         pears at elevated temperatures of 600–700 8C, mainly associat-
  are characterized by using N2 physisorption, water vapor sorp-                           ed with phenol and ether groups. The measurements also
  tion, Boehm titration, and temperature-programmed desorp-                                show a tail that extends to 1000 8C related to the decomposi-
  tion (TPD) MS to understand the influence of the textural prop-                          tion of carbonyl and quinone groups. CO desorbed at lower
  erties and surface chemistry on the adsorption properties of                             temperatures (400 8C) can be assigned to anhydride groups.
  lysine. The selective separation of lysine and glucose is evaluat-                       The CO2 desorption profile emphasizes maximum CO2 release
  ed as a crucial parameter for potential application. We evaluate                         at 250 and 650 8C, which corresponds to carboxylic and lactone
  a systematic modification of the activated carbon for a poten-                           groups.
  tial enhancement of the adsorption capacity and separation                                  CO2 evolution at temperatures of 400–600 8C is suggested to
  factor and confirm the stability of the modified form. Hereafter,                        relate to anhydride groups. CO and CO2 desorption profiles of
  lysine refers to the biologically active enantiomer l-lysine.                            the different activated carbons measured by using TPD-MS are
                                                                                           provided in Figure S2. The cumulative amounts of CO and CO2
                                                                                           released for each activated carbon during the TPD experiments
  Results and Discussion                                                                   are shown in Table 1. The activated carbons 100562, A Supra
                                                                                           EUR, and CP6/400 release the lowest amounts of CO and CO2,
  Characterization of activated carbons
  The N2 adsorption–desorption isotherms (see the Supporting
  Information; Figure S1 a) display, for most of the commercial
  activated carbon materials, a type I isotherm behavior with a
  fast uptake at a low relative pressure followed by a horizontal
  adsorption typical of microporous materials.[15] For some sam-
  ples, that is, PA4N and KB-G, type IV and II isotherms are ob-
  tained because of their meso- and macroporosity.[15] A narrow
  pore size distribution in the range of micropores (< 20 a)
  could be observed for the carbons (Figure S1 b). The results of
  N2 physisorption are summarized in Table 1.
     Information about the surface chemistry of the active
  carbon samples was obtained by using TPD-MS. In this pro-
  cess, the relative thermal stability of surface functional groups
  is used to determine the concentration of these functionalities
  on the carbon surface. The O-containing functional groups can
  be divided into two groups that decompose into CO2 and CO
  at different temperatures during the TPD experiment. The de-
  composition of carboxyl, anhydride, and lactone groups results
  mainly in CO2 formation, whereas the decomposition of
  phenol, ether, and carbonyl groups produces CO.[16] The main
  oxygen surface groups on the activated carbons and their ex-

   Table 1. Overview of textural properties of commercial activated carbons
   obtained by using N2 physisorption and the amounts of released CO and
   CO2 measured by using TPD-MS.

   Activated      Stotal[a]   Vtotal      Vmicro[b]   COdesorbed[c]   CO2,desorbed[c]
   carbon         [m2 g@1]    [cm3 g@1]   [cm3 g@1]   [mmol g@1]      [mmol g@1]
   CW20           2023        1.83        0.49        2052             63
   KB-G           1355        1.14        0.31        2157            144
   PA4N           1491        1.47        0.38        2134             73
   CP6/400        1254        0.64        0.51         964            106
   A Supra EUR    1923        0.97        0.62         528             32
   Ble 100562     2075        1.17        0.66         225             13                  Figure 1. a) Oxygen surface groups on activated carbon and their tempera-
                                                                                           ture range of decomposition during TPD-MS analysis. b, c) Rates of CO (b)
   [a] BET method. [b] t-plot method. [c] Amounts of CO and CO2 released in
                                                                                           and CO2 (c) desorption during TPD-MS analysis of the activated carbon Sil-
   TPD-MS experiments.
                                                                                           carbon CW20 and the proposed corresponding functional groups.

  ChemSusChem 2020, 13, 3614 – 3621          www.chemsuschem.org                        3615   T 2020 The Authors. Published by Wiley-VCH Verlag GmbH & Co. KGaA, Weinheim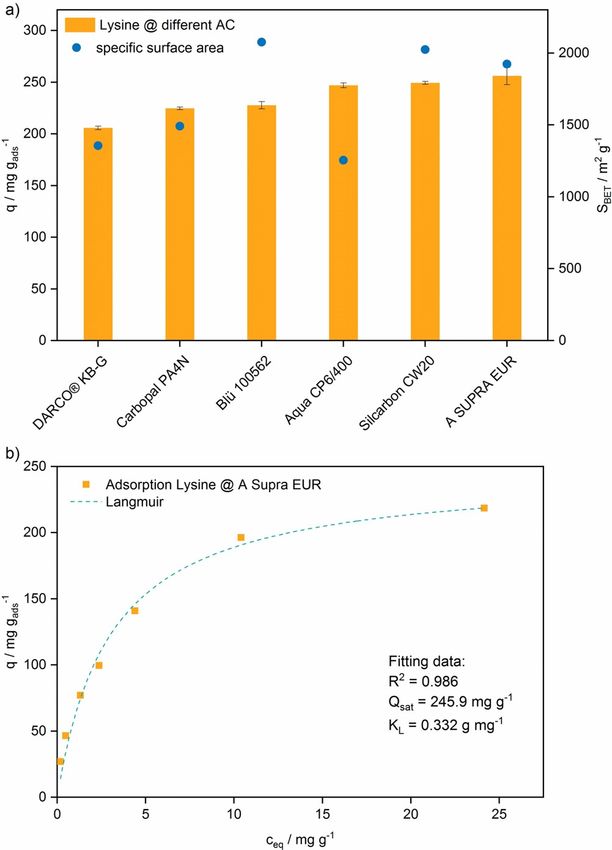
Full Papers
ChemSusChem doi.org/10.1002/cssc.202000885
which indicates that they have a very low amount of O-con- Water vapor sorption enables insights with regard to the
taining functional groups. Their main CO signal at approxi- surface polarity that result from the specific surface functionali-
mately 700–900 8C is typical for quinone and carbonyl func- ty and morphology of materials. The water vapor adsorption
tional groups. Activated carbons PA4N, KB-G, and CW20 pos- isotherms of the activated carbons are depicted in Figure S3.
sess significantly higher amounts of oxygen surface group In the case of water vapor adsorption, type III and V isotherms
functionalities. CO is mainly released at 500 8C, typical of anhy- are obtained for the studied activated carbons. This kind of ad-
dride groups, and 600–800 8C, which can be assigned to high sorption is characteristic for weak interactions between a polar
amounts of phenol and ether functionalities. With regard to adsorbate and hydrophobic surfaces, especially at a low rela-
the CO2-evolution profiles of these activated carbons, signifi- tive pressure (p/p0 < 0.2), in which a very low uptake of water
cant contributions occur at 180–300 8C assigned to carboxylic occurs.[19] Furthermore, each adsorption isotherm shows an
groups, 350–600 8C caused mainly by lactone groups, and elevated water uptake at p/p0 = 0.4–0.8 associated with the
500–700 8C that originate from peroxide and carboxylic anhy- steady growth of water clusters. Differences between the re-
dride groups.[16b, c] Although the different functional groups can spective isotherms are related to the different amounts of sur-
be assigned by the decomposition temperatures, interpreta- face oxygen functional groups. Activated carbons with the
tion of TPD spectra from the literature is somehow ambiguous highest amounts of CO and CO2 released during TPD-MS, that
because of the overlap of desorbed products.[17] is, CW20, KB-G, and PA4N, also possess the highest water
Therefore, and to complement these TPD-MS results, Boehm vapor uptake at a low relative pressure. This indicates more hy-
titration was performed to determine the functional groups drophilic surface properties compared to the very hydrophobic
present on the surface of the commercial activated carbons.[18] materials 100562 and A Supra EUR. These results are in accord-
The results of Boehm titration are presented in Figure 2 and ance with the results obtained by using TPD-MS and Boehm ti-
Table S1. Indeed, the results of Boehm titration agree with tration.
those obtained by TPD-MS. Activated carbons that possess
higher amounts of O-containing surface groups also hold the
Influence of pH on lysine adsorption
highest content of acidic groups such as carboxylic, lactonic,
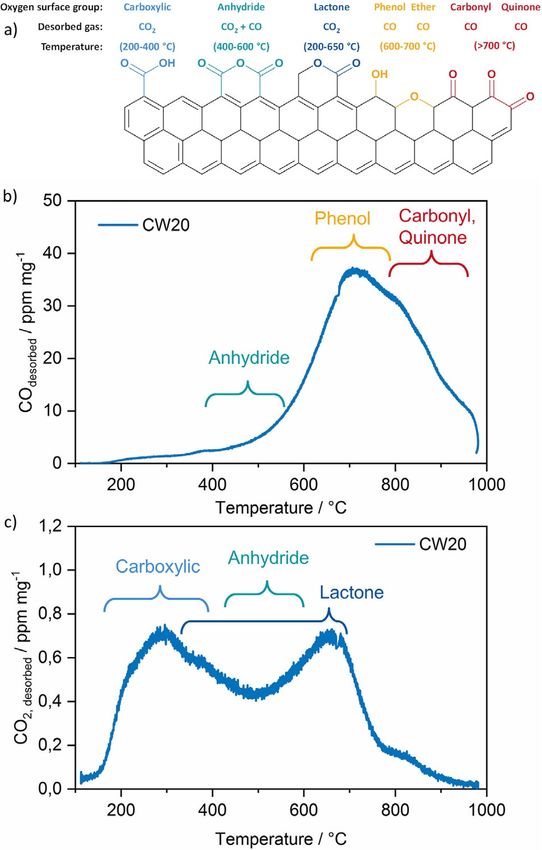
and phenolic groups. The data indicate that all carbons have a Lysine is a basic amino acid that can be found in four different
large contribution of surface groups and differ significantly in dissociation states that depends on the pH value of the solu-
their chemical nature. Notably, Boehm titration only considers tion (Figure 3 a). Dissolved lysine in water has a pH value of 10,
the amount of acidic and not basic groups, whereas in TPD-MS which makes it predominantly zwitterionic. pH values higher
analysis both types of functional groups are measured. TPD- than 10 result in a change of the dissociation state towards
MS results for CW20 and KB-G showed almost the same the anionic form. For pH values of 1–8, lysine is mainly present
amount of CO desorbed during the measurement but signifi- in the cationic and dicationic form.[20] As a result of the dissoci-
cantly differ in the results obtained by using Boehm titration. ation behavior of lysine, it shows various adsorption behaviors
An explanation could relate to the much higher amount of as the polarity of the adsorptive has a great impact on the ad-
basic functional groups such as ketone, pyrene, or chromene sorption performance.[11c] Furthermore, the pH value needs to
for CW20. be taken into consideration as fermentative processes for
lysine production may differ in pH, and typical lysine produc-
tion with Corynebacterium glutamicum is performed at pH 6–
8.[2] The influence of the pH value of the solution on the ad-
sorption of lysine on activated carbon is shown in Figure 3 b.
The adsorption capacity of lysine on activated carbon reached
a maximum at pH 10, which enabled an adsorption of
249.4 mg g@1. At this pH value, lysine is primarily in the zwitter-
ionic state, which is the most stable form in water. In this
state, lysine also has its lowest solubility in water, which makes
it less polar compared to the other dissociation states.[20, 21] As
AC is inherently hydrophobic, the dissociation state with the
lowest polarity is the most favored as, in general, the adsorp-
tion of a nonpolar solute will be higher on adsorbents that are
also nonpolar.[22] The cationic and dicationic forms (pH 1–8)
showed significantly lower adsorption capacities of 18–
42 mg g@1. For higher pH values above 10, the anionic state be-
comes the major form and the adsorption capacity decreases
significantly. If salts are added into the adsorption mixture, the
polarity of the lysine solution changes, which affects the ad-
sorption behavior. The protonated/deprotonated dissociation
Figure 2. Activated carbon surface functionalities obtained by Boehm titra- states are more polar compared to the zwitterionic state,
tion. which widens the gap in polarity between the adsorbent and
ChemSusChem 2020, 13, 3614 – 3621 www.chemsuschem.org 3616 T 2020 The Authors. Published by Wiley-VCH Verlag GmbH & Co. KGaA, Weinheim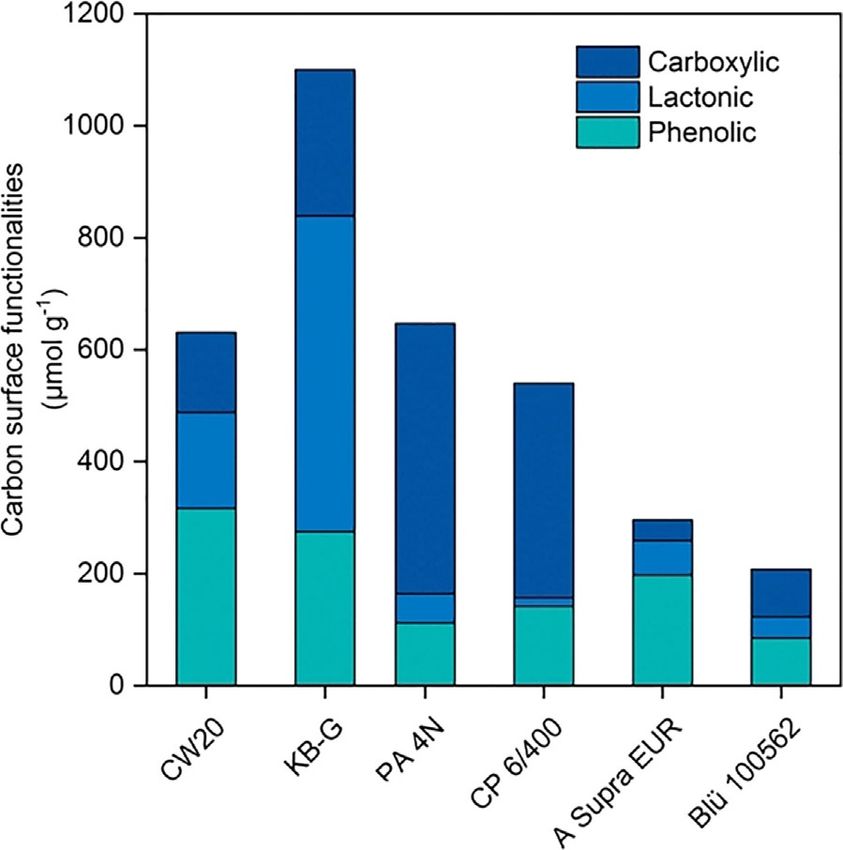
Full Papers
ChemSusChem                                           doi.org/10.1002/cssc.202000885

  Figure 3. a) Changes as a function of pH in the distribution of different dis-
  sociation states of dissolved lysine, determined from reported dissociation
  constants.[11c, 20] b) Influence of the pH value of the solution on the adsorp-
  tion of lysine on activated carbon (Silcarbon CW20). T = 30 8C, cLys = 30 g L@1,
  tads = 24 h. The error bars correspond to the standard deviation determined
  from triplicate experiments.                                                          Figure 4. a) Adsorbed amounts of lysine using commercial activated carbons
                                                                                        with the corresponding surface areas. T = 30 8C, cLys = 30 g L@1, tads = 24 h,
                                                                                        pH 10. The error bars correspond to the standard deviation determined
                                                                                        from triplicate experiments. b) Adsorption isotherm of lysine from aqueous
  adsorbate. Thus, the adsorption performance correlates directly                       solution fitted to a Langmuir adsorption isotherm model.
  with the properties of the molecule; the polarity increases with
  protonation/deprotonation to result in lower adsorption ca-
  pacities. In addition, the surface state of the activated carbon
  is pH dependent. Functional groups of the activated carbon                            to date and to the best of our knowledge, the highest ever re-
  such as carboxyl, ketone, or phenol can be deprotonated in                            ported for lysine adsorption on carbon material.[12c] The activat-
  solutions with basic pH values, which results in stronger elec-                       ed carbon A Supra EUR has the highest adsorption capacity
  trostatic interactions with the positively charged amino groups                       followed by Silcarbon CW20 and CP6/400. A correlation of the
  of lysine compared to an uncharged surface state at a lower                           specific surface area to the adsorption performance indicates
  pH value.[23] As the best result was achieved at a solution pH                        that a high surface area indeed favors a high adsorption ca-
  of 10, the following experiments were conducted under these                           pacity. However, this trend is not linear, and the experimental
  conditions.                                                                           data scatter, which leads to the conclusion that there are more
                                                                                        factors to consider to try to understand the adsorption per-
                                                                                        formance. A Supra EUR, the activated carbon with the lowest
  Lysine adsorption on different activated carbons
                                                                                        surface functionality, has the highest affinity towards the least
  A set of different commercial activated carbons was tested by                         polar form of lysine (zwitterionic state). This adsorption behav-
  using a single-solute aqueous solution with a lysine concentra-                       ior can be explained by the nonspecific enthalpy-driven hydro-
  tion of 30 g L@1. An adsorption temperature of 30 8C was                              phobic effect and van der Waals (vdW) forces. Nevertheless,
  chosen because temperatures between 30 and 34 8C are typi-                            CW20, a carbon with high amount of oxygen functional
  cally used for the fermentation process.[6] The textural proper-                      groups, shows a very high adsorption towards lysine, too. A
  ties, surface functionalities, and polarity of the activated car-                     possible explanation for this might be that, besides vdW forces
  bons are presented in Table 1, Figure 2, and Figures S1–S3 and                        and hydrophobic interactions, an increased amount of electro-
  discussed in the previous section. The lysine adsorption capaci-                      static interactions and hydrogen bonding are present and/or
  ties of the different activated carbons are presented in Fig-                         lysine is adsorbed according to an ion-exchange mecha-
  ure 4 a. The adsorption capacities are 206–256 mg g@1, which is,                      nism.[12c] In general, for the single-solute lysine adsorption, no

  ChemSusChem 2020, 13, 3614 – 3621            www.chemsuschem.org                   3617   T 2020 The Authors. Published by Wiley-VCH Verlag GmbH & Co. KGaA, Weinheim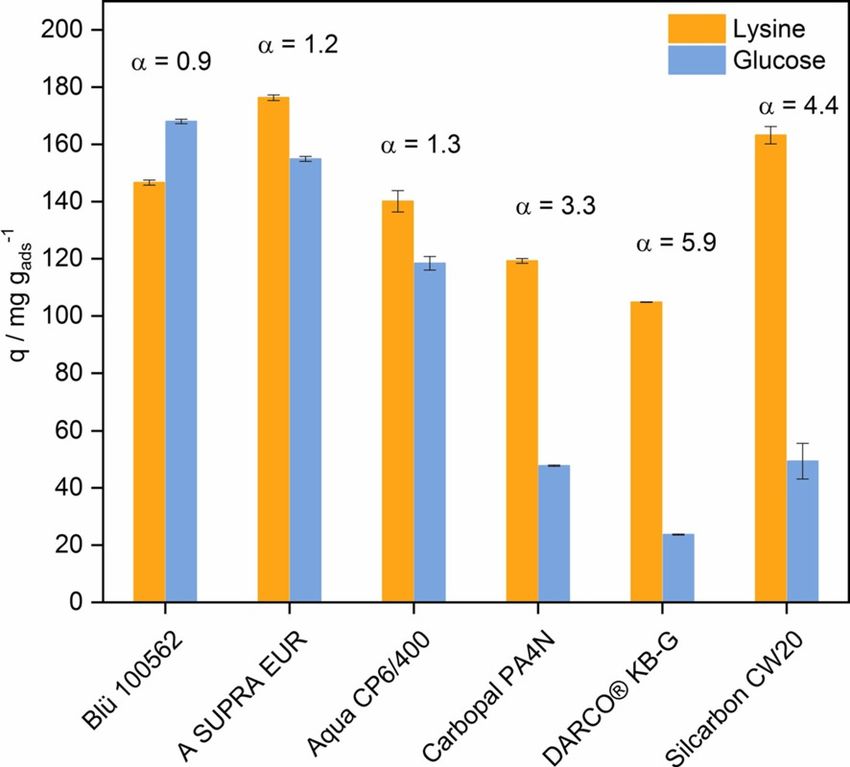
Full Papers
ChemSusChem                                               doi.org/10.1002/cssc.202000885

  correlation can be made between adsorption capacity and                                  highest selectivity towards lysine was for the activated carbons
  functionalities.                                                                         CW20 and KB-G with a = 4.4 and 5.9, respectively. This indi-
     To gain more information on the interaction between the                               cates that the selectivity correlates with the amount of surface
  adsorbent material and lysine, a single-component adsorption                             oxygen groups as higher amounts of oxygen groups translate
  isotherm of lysine was measured for A Supra EUR (Figure 4 b).                            to a higher selectivity for lysine (Figure 6).
  The lysine adsorption data were fitted to the Langmuir adsorp-
  tion isotherm model. This model assumes monolayer adsorp-
  tion, in which adsorption only occurs at a fixed number of defi-
  nite localized sites, which are identical and equivalent, with no
  lateral interaction and steric hindrance between the adsorbed
  molecules.[24] This model fits the data very well with a correla-
  tion coefficient (R2) of 0.986. A characteristic plateau indicates
  an equilibrium saturation point in which once a molecule oc-
  cupies a site, no further adsorption takes place.

  Competitive adsorption of lysine and glucose
  It is important to gain knowledge on the selectivity of the ad-
  sorption process because lysine is produced on industrial scale
  by the fermentation of glucose and a mixture of different com-
  ponents is present.[2] As a model solution, a mixture of lysine
  and d-glucose with equivalent masses was used (10 g L@1). The                            Figure 6. Separation factor as a function of cumulated amounts of CO2 and
  molarity was kept lower than that for the single-model solu-                             CO (normalized by specific surface area) released during TPD-MS experi-
  tion to inhibit the undesired Maillard reaction.[25] The competi-                        ments for different activated carbons.
  tive adsorption performance for commercial activated carbons
  is shown in Figure 5. Single-component adsorption showed
  high adsorption capacities towards lysine relatively independ-                              Although CW20 possesses slightly lower amounts of oxygen
  ent of the respective characteristics of the activated carbons.                          functional groups compared to, for example, KB-G, the higher
  In multicomponent adsorption, the influence of the activated                             specific surface area coupled with high amount of oxygen re-
  carbon surface properties becomes more pronounced to con-                                sults in a high separation factor. This shows that the interplay
  sider the selectivity of adsorption. The selectivity was deter-                          of both porosity and functionality presents the essential char-
  mined by the separation factor a calculated as the ratio of                              acteristics. The lowest selectivity towards lysine adsorption was
  lysine to glucose adsorbed divided by the ratio of lysine and                            found for the activated carbons Ble 100562, A Supra EUR, and
  glucose that remains in solution. The separation factor a is                             Aqua CP6/400, which can be explained by their very low
  0.9–5.6 for the different commercial activated carbons. The                              amounts of oxygen functional groups.
                                                                                              In single-component adsorption, the dissociation state of
                                                                                           lysine with the lowest polarity (at pH 10) was most favored for
                                                                                           the adsorption on hydrophobic activated carbon. Surprisingly,
                                                                                           competitive adsorption showed that a more hydrophilic
                                                                                           carbon (caused by a higher content of oxygen surface groups)
                                                                                           results in better selectivity towards lysine adsorption. We sug-
                                                                                           gest that glucose (uncharged at pH 10) adsorption relies
                                                                                           mainly on physical adsorption based on weaker vdW forces
                                                                                           and hydrophobic interactions. As a result of the similar polarity
                                                                                           of glucose and lysine, no separation based on physical adsorp-
                                                                                           tion can be made for low-functionalized carbons. In contrast,
                                                                                           an increasing content of oxygen functional groups enables en-
                                                                                           hanced electrostatic interactions and hydrogen bonding be-
                                                                                           tween the amine groups of lysine and oxygen surface groups
                                                                                           of the activated carbon to result in a higher selectivity for
                                                                                           lysine compared to glucose. To gain further insights into the
                                                                                           origin of the high selectivity towards lysine in the lysine–glu-
                                                                                           cose adsorption and to enhance the adsorption performance,
                                                                                           an activated carbon was modified systematically to tailor the
  Figure 5. Adsorbed amounts of lysine and glucose in competitive adsorption
                                                                                           surface chemistry.
  experiments using commercial activated carbons. T = 30 8C, cLys/Glu = 10 g L@1,
  tads = 4 h, pH 10. a = (qLys/qGlu)/(ce,Lys/ce,Glu). Error bars correspond to the stan-
  dard deviation determined from triplicate experiments.

  ChemSusChem 2020, 13, 3614 – 3621              www.chemsuschem.org                   3618   T 2020 The Authors. Published by Wiley-VCH Verlag GmbH & Co. KGaA, Weinheim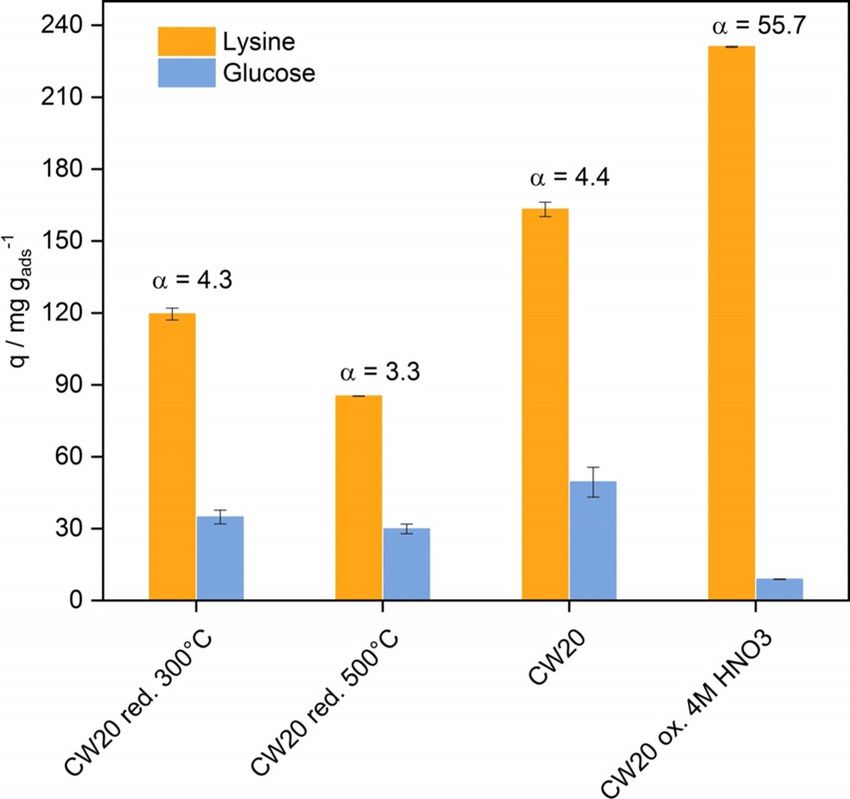
Full Papers
ChemSusChem                                 doi.org/10.1002/cssc.202000885

  Modified activated carbon in lysine adsorption                       modified Silcarbon CW20 are shown in Figure 7. Through oxi-
                                                                       dation of the activated carbon, an outstanding 13-fold increase
  The chemical structure of the activated carbon surface has a         in separation could be achieved, in which the lysine adsorption
  significant impact on the adsorption performance and espe-           was enhanced by 30 %. Although the specific surface area de-
  cially on the selectivity as previous results revealed. According-   clines by 40 %, surface functionalities seem to be key for the
  ly, the surface functionalities of the carbon were modified by       efficient separation of lysine from glucose (Figure S8). These re-
  using reduction and oxidation methods. For modification ex-          sults further support the idea of enhanced selectivity by elec-
  periments, Silcarbon CW20 was chosen as a model carbon as it         trostatic interactions and an increase of the amount of hydro-
  showed the most promising results in terms of selectivity and        gen bonding between the amine groups of lysine and oxygen
  adsorption capacity. The textural properties of the modified         surface groups of the activated carbon. Future studies will aim
  carbons were characterized by using N2 physisorption (Fig-           to gain a fundamental understanding of the governing surface
  ure S5); the polarity and surface functionalities were character-    interactions. Through oxidation, the CO content desorbed
  ized by using water vapor sorption and TPD-MS, respectively          from the carbon could be doubled and the CO2 amount desor-
  (Table S2). Comparison of the specific surface areas indicates       bed was eight times higher than that of the untreated carbon.
  that modification decreases the porosity. These results are in       Reduction of the activated carbon, in turn, led to lower separa-
  accordance with those of previous studies as harsh conditions        tion factors and overall lower adsorption capacities, which con-
  can lead to a collapse of the pore walls and a decline in the        firms the crucial role of O-containing surface groups.
  specific surface area and total pore volume.[26] The desorption
  of CO and CO2 from Silcarbon CW20 if it was heated from 120
  to 1000 8C during TPD-MS analysis is shown in Figure S5. Oxi-
  dative treatment with nitric acid led to a higher amount of CO
  and CO2 evolution from Silcarbon CW20. After oxidation, the
  increase of evolved CO2 was higher than that of CO, which in-
  dicates the generation of a higher proportion of acidic groups.
  Also, relevant peaks are observed between 175–400 8C in the
  CO2 evolution profile, which can be attributed to carboxylic
  acids and carboxylic anhydrides. The amount of evolved CO2 is
  also significantly higher above 600 8C compared to that of the
  untreated carbon. In addition, the amount of evolved CO at
  approximately 700 8C increased significantly. However, reduc-
  tion under H2 results in exactly the opposite trend. The CO and
  CO2 desorption profiles decrease with an increase of the reduc-
  tion temperature, and CW20 reduced at 500 8C showed the
  lowest amount of CO and CO2 evolved. This was expected as
  reduction removes most of the O-containing functional groups
  from the surface.
                                                                       Figure 7. Competitive adsorption of lysine and glucose using modified Sil-
     Besides TPD-MS, water vapor sorption was used to visualize        carbon CW20. T = 30 8C, cLys/Glu = 10 g L@1, tads = 4 h, pH 10. Error bars corre-
  the effect of the modification on the polarity of the activated      spond to the standard deviation determined from triplicate experiments.
  carbon. The water vapor adsorption isotherms of untreated
  and modified Silcarbon CW20 are depicted in Figure S7. The
  shape of the isotherm describes the surface polarity of the acti-       To test the stability of the modified activated carbon and its
  vated carbon qualitatively. Indeed, the shape of the isotherms       recyclability, the oxidized carbon CW20 was tested in three
  changed significantly upon the incorporation (through oxida-         consecutive adsorption runs. The recycling procedure is ex-
  tion) and removal (through reduction) of surface oxygen func-        plained in detail in the Supporting Information. The results of
  tional groups. The O-enriched activated carbon possessed a           the recycling test of the oxidized CW20 are shown in Figure 8.
  significantly higher water uptake at a low relative pressure (p/     It became evident that after the first recycling, the adsorption
  p0 = 0.1–0.6). This observation is in good agreement with the        capacity decreases from 211 to 191 mg g@1. This decline in the
  TPD-MS data. The reduction of the carbon, however, results in        adsorbed amount of lysine could be related to a certain loss of
  a lower water uptake at low relative pressures (p/p0 < 0.7). A       surface functional groups. Overall, the recycling study proves
  type III/V isotherm could be observed with a low water loading       the high stability and recyclability of the optimized activated
  at a low relative pressure that increased at a higher relative       carbon CW20.
  pressure because of capillary condensation.[19b] These findings
  are in line with previous results, as fewer surface O-containing
                                                                       Conclusions
  functionalities relate to a more hydrophobic carbon compared
  to the as-received Silcarbon CW20. It is expected that a higher      A detailed insight into lysine adsorption and its separation
  amount of surface functional groups favors lysine over glucose       from glucose on tailored activated carbon was performed. By
  adsorption. The adsorption and separation performance of the         testing a broad variety of different activated carbons, the ne-

  ChemSusChem 2020, 13, 3614 – 3621   www.chemsuschem.org          3619    T 2020 The Authors. Published by Wiley-VCH Verlag GmbH & Co. KGaA, Weinheim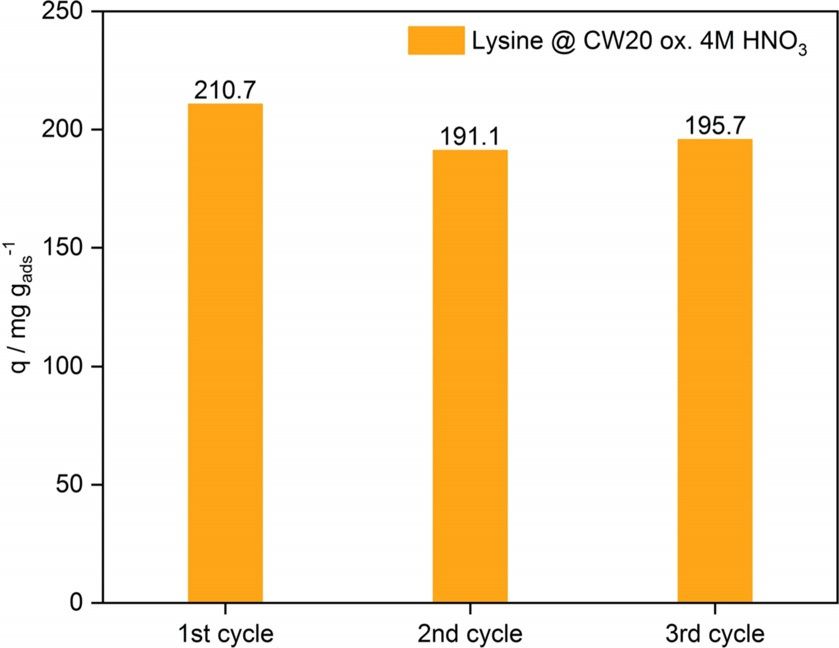
Full Papers
ChemSusChem                                      doi.org/10.1002/cssc.202000885

                                                                               equivalent masses of l-lysine and d-glucose (10 g L@1) was used.
                                                                               The amount adsorbed from the solutions on a specific mass of ad-
                                                                               sorbent in the equilibrium is represented by the adsorption capaci-
                                                                               ty q and was calculated by using Equation (1).

                                                                                    ðc0 @ ceq Þmsol:
                                                                               q¼                                                                         ð1Þ
                                                                                         mAC

                                                                               In which c0 is the initial liquid-phase concentration of the adsorp-
                                                                               tion solution, ceq is the concentration that remains at equilibrium,
                                                                               msol. is the total mass of the solution, and mAC is the total mass of
                                                                               the activated carbon. For the pH-dependent measurements, pH
                                                                               values from 1 to 12 were adjusted using 4 m NaOH and 6 m HCl.

                                                                               Surface modification of activated carbon
  Figure 8. Adsorbed amounts of lysine by CW20 ox. 4 m HNO3 in three con-
                                                                               Reduction of the activated carbon was performed in a tube oven
  secutive adsorption cycles. T = 30 8C, cLys = 3 g L@1 pH 10.
                                                                               with H2 at 300 and 500 8C, respectively. The sample was pretreated
                                                                               by heating to 100 8C for 1 h under N2 to remove impurities. After-
                                                                               wards, the temperature was elevated at a heating rate of
  cessity of a high specific surface area in combination with a                10 8C min@1 under H2. After the temperature was held for 3 h, the
  large amount of oxygen surface functionalities was proven to                 sample was cooled overnight under N2 atmosphere. The activated
                                                                               carbon was oxidized by treating Silcarbon CW20 (1 g) with 4 m
  achieve high lysine adsorption capacities of up to 256 mg g@1.
                                                                               nitric acid (10 mL; Caution: corrosive acid and strong oxidizing
  The selectivity for lysine adsorption from an aqueous phase
                                                                               agent). The mixture was heated to reflux at 150 8C for 20 min with
  that contains both lysine and glucose depends strongly on the                stirring at 250 rpm. Nitrous gases produced by heating are neutral-
  surface functionalities of the activated carbon rather than on               ized by using a washing bottle that contained NaOH solution at
  the specific surface area. To gain further insights, an activated            the exit of the setup. The activated carbon was collected by filtra-
  carbon was tailored by oxidation with nitric acid to result in a             tion and washed with distilled water until pH neutral. Afterwards,
  significantly enhanced lysine adsorption capacity by 30 % and                the carbon was dried overnight at 80 8C.
  a 13-fold higher separation factor. Adsorption conditions such
  as pH had a significant impact on the lysine uptake. Recycling               Characterization methods
  experiments were performed by testing the oxidized activated
  carbon CW20 in repetitive adsorption runs and showed only a                  HPLC analysis
  minor decline in lysine adsorption capacity, which emphasizes                The aqueous phase of the adsorption experiments was analyzed
  the stability of the surface functionalization.                              by using a Shimadzu Prominence LC-20 HPLC system. For the
                                                                               measurements of lysine and lysine/glucose mixtures, the system
                                                                               was equipped with a Primesep S 4,6 V 150 mm mixed zone column
  Experimental Section                                                         provided by SIELC Technologies and a refractive index detector. As
                                                                               the eluent, 80 mm ammonium formate in a water/acetonitrile mix-
  Chemicals and materials                                                      ture (60:40) was used. The temperature was kept at 50 8C, and the
  l-Lysine (+ 98 %) was supplied by abcr GmbH and d-glucose (>                 flow rate was 0.8 mL min@1.
  99 %) by Merck. Activated carbon 100562 was provided by Blecher
  GmbH. Silcarbon CW20 was provided by Silcarbon Aktivkohle
  GmbH, and Aqua Air Adsorbens GmbH & Co.KG supplied the Aqua                  N2 physisorption
  CP6/400. Activated carbons A Supra EUR and KB-G were supplied                A Quadrasorb SI was used to measure the N2 adsorption and de-
  by Cabot Corporation. Degassed Milli-Q water from a Werner Rein-             sorption isotherms. Before the measurements, the samples were
  stwasser system (> 18.2 MW cm) was used in all the experiments.              degassed at 150 8C under vacuum for at least 5 h by using a FloVac
                                                                               degasser. The temperature during the measurement was kept at
                                                                               @196 8C. The data were evaluated by using the software Quadra-
  Adsorption experiments                                                       Win. The specific surface areas were determined by using the BET
                                                                               model in the range 0.05 , p/p0 , 0.2. For the analysis of the total
  Before the adsorption experiments, the activated carbons were
                                                                               pore volume, the highest relative pressure points p/p0 = 0.95–0.98
  dried in a vacuum oven at 60 8C for 24 h. If not stated otherwise,
                                                                               were used. The micropore volumes were obtained by using the t-
  40 mg of adsorbent was added to 2 mL solution. The adsorption
                                                                               plot model.
  experiment was performed in a water shaking bath with a temper-
  ature control unit. Typically, the sample was kept in the shaking
  bath for 24 h at 30 8C. Afterwards, the loaded adsorbent was fil-
                                                                               H2O vapor sorption
  tered, and the remaining solution was analyzed by using HPLC to
  determine the concentration. For each of the experiments, tripli-            Before the measurement, the samples were treated in an analo-
  cate adsorption experiments were conducted to ensure accuracy.               gous manner as the samples for the N2 physisorption measure-
  For the single adsorption, a solution of lysine (30 g L@1) in Milli-Q        ments. The water vapor adsorption isotherms were measured by
  water was used. For the competitive adsorption, a solution with              using an AutosorbS iQ, which works in a static and volumetric

  ChemSusChem 2020, 13, 3614 – 3621       www.chemsuschem.org               3620   T 2020 The Authors. Published by Wiley-VCH Verlag GmbH & Co. KGaA, Weinheim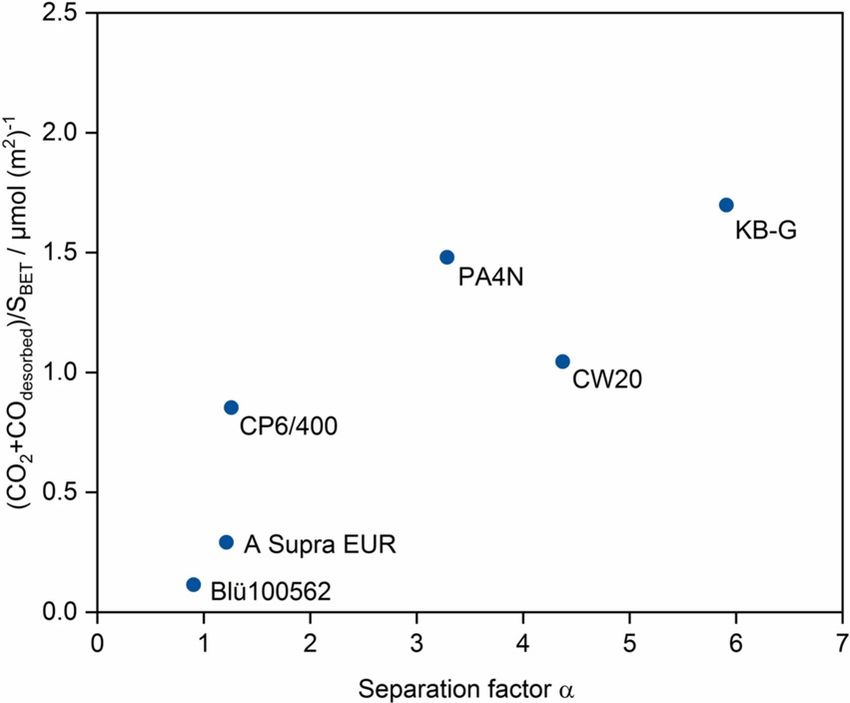
Full Papers
ChemSusChem                                              doi.org/10.1002/cssc.202000885

  mode. Water vapor isotherms can be measured in the range of p/                                   Renewable Energy Laboratory, Golden, CO, 2002, https://www.nrel.gov/
  p0 = 0.1–0.9. The isotherms were measured at 30 8C. The data were                                docs/fy02osti/32438.pdf.
  evaluated by using the software ASiQWin.                                                   [6]   T. Hermann, J. Biotechnol. 2003, 104, 155 – 172.
                                                                                             [7]   I. Lee, K. Lee, K. Namgoong, Y.-S. Lee, Enzyme Microb. Technol. 2002, 30,
                                                                                                   798 – 803.
  TPD-MS                                                                                     [8]   a) K. Schute, C. Detoni, A. Kann, O. Jung, R. Palkovits, M. Rose, ACS Sus-
                                                                                                   tainable Chem. Eng. 2016, 4, 5921 – 5928; b) C. Detoni, C. H. Gierlich, M.
  TPD-MS experiments were performed by using a mass spectrome-                                     Rose, R. Palkovits, ACS Sustainable Chem. Eng. 2014, 2, 2407 – 2415; c) K.
  ter (CIRRUS 2 device by MKS Instruments) equipped with a com-                                    Schute, Y. Louven, C. Detoni, M. Rose, Chem. Ing. Tech. 2016, 88, 355 –
  bined Faraday cage and electron multiplier detector. As an internal                              362; d) G. Schroer, J. Deischter, T. Zensen, J. Kraus, A.-C. Pçppler, L. Qi, S.
                                                                                                   Scott, I. Delidovich, Green Chem. 2020, 22, 550 – 562; e) L. Rebenach, J.
  standard, 10 mL min@1 He was used. The experiments were con-
                                                                                                   Lins, E. Koh, M. Rose, ChemSusChem 2019, 12, 3627 – 3634.
  ducted under an Ar stream of 90 mL min@1. The flow was regulated                           [9]   a) A. Faisal, M. Holmlund, M. Ginesy, A. Holmgren, J. Enman, J. Hedlund,
  by using Labview, and the data were obtained from Process EyeQ.                                  M. Grahn, ACS Sustainable Chem. Eng. 2019, 7, 8900 – 8907; b) J. E.
  Samples were pretreated at 120 8C for 3 h to ensure that all mois-                               Krohn, M. Tsapatsis, Langmuir 2005, 21, 8743 – 8750; c) S. Munsch, M.
  ture and O2 was out of the system. The spectra were recorded by                                  Hartmann, S. Ernst, Chem. Commun. 2001, 1978 – 1979.
  progressively heating the samples to 1000 8C at a heating rate of                       [10]     D. Jonckheere, J. A. Steele, B. Claes, B. Bueken, L. Claes, B. Lagrain,
  20 8C min@1.                                                                                     M. B. J. Roeffaers, D. E. De Vos, ACS Appl. Mater. Interfaces 2017, 9,
                                                                                                   30064 – 30073.
                                                                                          [11]     a) G. Chen, M. Liu, BioResearch 2011, 7, 298 – 314; b) Y. Yang, S. Wang, J.
  Boehm titration                                                                                  Liu, Y. Xu, X. Zhou, Langmuir 2016, 32, 4746 – 4754; c) N. Kitadai, T. Yo-
                                                                                                   koyama, S. Nakashima, J. Colloid Interface Sci. 2009, 329, 31 – 37; d) N. Ki-
  The general titration procedure was performed by using the stan-                                 tadai, T. Yokoyama, S. Nakashima, J. Colloid Interface Sci. 2009, 338,
  dard Boehm titration method.[18, 27]                                                             395 – 401; e) A. J. O’Connor, A. Hokura, J. M. Kisler, S. Shimazu, G. W. Ste-
                                                                                                   vens, Y. Komatsu, Sep. Purif. Technol. 2006, 48, 197 – 201.
                                                                                          [12]     a) A. Ikuo, H. Katsumi, K. Mutsuo, Bull. Chem. Soc. Jpn. 1982, 55, 687 –
  Acknowledgements                                                                                 689; b) A. Vinu, K. Z. Hossain, G. Satish Kumar, K. Ariga, Carbon 2006, 44,
                                                                                                   530 – 536; c) J. Yang, S. Han, Desalin. Water Treat. 2018, 120, 261 – 271.
                                                                                          [13]     Separation and Purification Technologies in Biorefineries (Eds.: S. Ramasw-
  We thank Noah Avraham and Jens Heller for HPLC analysis. This                                    amy, H.-J. Huang, B. V. Ramarao), John Wiley & Sons, Hoboken, 2013.
  work was funded by the Bundesministerium fer Bildung und For-                           [14]     a) C. Y. Yin, M. K. Aroua, W. M. A. W. Daud, Sep. Purif. Technol. 2007, 52,
  schung (BMBF, Federal Ministry of Education and Research)                                        403 – 415; b) P. Chingombe, B. Saha, R. J. Wakeman, Carbon 2005, 43,
                                                                                                   3132 – 3143.
  within the Project “BioSorp” (FKZ 031B0678A). We gratefully
                                                                                          [15]     K. A. Cychosz, R. Guillet-Nicolas, J. Garc&a-Mart&nez, M. Thommes, Chem.
  thank Blecher GmbH, Silcarbon Aktivkohle GmbH, and Aqua Air                                      Soc. Rev. 2017, 46, 389 – 414.
  Adsorbens GmbH & Co.KG for providing us the activated carbons.                          [16]     a) J. L. Figueiredo, M. F. R. Pereira, M. M. A. Freitas, J. J. M. =rf¼o, Carbon
  We also thank J8rime Meyers, Moritz Litzel, Joel B. Mensah, F.                                   1999, 37, 1379 – 1389; b) M. S. Shafeeyan, W. M. A. W. Daud, A. Housh-
                                                                                                   mand, A. Shamiri, J. Anal. Appl. Pyrolysis 2010, 89, 143 – 151; c) M.
  Joschka Holzh-user, Yannik Louven, Tobias Janke, and Jennifer
                                                                                                   Thommes, C. Morlay, R. Ahmad, J. P. J. A. Joly, Adsorption 2011, 17, 653;
  Hanf for sparing their valuable time for discussion.                                             d) W. Shen, Z. Li, Y. Liu, Recent Pat. Chem. Eng. 2008, 1, 27 – 40.
                                                                                          [17]     J.-H. Zhou, Z.-J. Sui, J. Zhu, P. Li, D. Chen, Y.-C. Dai, W.-K. Yuan, Carbon
                                                                                                   2007, 45, 785 – 796.
  Conflict of interest                                                                    [18]     H. P. Boehm in Advances in Catalysis, Vol. 16 (Eds.: D. D. Eley, H. Pines,
                                                                                                   P. B. Weisz), Academic Press, Oxford, 1966, pp. 179 – 274.
  The authors declare no conflict of interest.                                            [19]     a) L. Cossarutto, T. Zimny, J. Kaczmarczyk, T. Siemieniewska, J. Bimer, J. V.
                                                                                                   Weber, Carbon 2001, 39, 2339 – 2346; b) J. J. Mahle, Carbon 2002, 40,
                                                                                                   2753 – 2759.
  Keywords: adsorption · amino acids · carbon · oxidation ·                               [20]     G. L. Gambino, G. M. Lombardo, A. Grassi, G. Marletta, J. Phys. Chem. B
                                                                                                   2004, 108, 2600 – 2607.
  surface analysis
                                                                                          [21]     T. E. Needham, A. N. Paruta, R. J. Gerraughty, J. Pharm. Sci. 1971, 60,
                                                                                                   565 – 567.
   [1] a) W. Leuchtenberger, K. Huthmacher, K. Drauz, Appl. Microbiol. Biotech-           [22]     R. C. Bansal, M. Goyal, Activated Carbon Adsorption, CRC Press, Boca
       nol. 2005, 69, 1 – 8; b) Z. Chen, G. Liu, J. Zhang, J. Bao, Bioresour. Tech-                Raton, 2005.
       nol. 2019, 271, 196 – 201; c) J. Meyers, J. B. Mensah, F. J. Holzh-user, A.        [23]     F. VillacaÇas, M. F. R. Pereira, J. J. M. =rf¼o, J. L. Figueiredo, J. Colloid In-
       Omari, C. C. Blesken, T. Tiso, S. Palkovits, L. M. Blank, S. Pischinger, R. Pal-            terface Sci. 2006, 293, 128 – 136.
       kovits, Energy Environ. Sci. 2019, 12, 2406 – 2411; d) J. Deischter, K.            [24]     I. Langmuir, J. Am. Chem. Soc. 1918, 40, 1361 – 1403.
       Schute, D. S. Neves, B. E. Ebert, L. M. Blank, R. Palkovits, Green Chem.           [25]     a) V. M. Hill, D. A. Ledward, J. M. Ames, J. Agric. Food Chem. 1996, 44,
       2019, 21, 1710 – 1717; e) Y. Louven, K. Schute, R. Palkovits, ChemCat-                      594 – 598; b) M. A. J. S. van Boekel, Biotechnol. Adv. 2006, 24, 230 – 233.
       Chem 2019, 11, 439 – 442.                                                          [26]     M. F. R. Pereira, S. F. Soares, J. J. M. =rf¼o, J. L. Figueiredo, Carbon 2003,
   [2] S. Anastassiadis, Recent Pat. Biotechnol. 2007, 1, 11 – 24.                                 41, 811 – 821.
   [3] a) J.-H. Lee, V. F. Wendisch, Bioresour. Technol. 2017, 245, 1575 – 1587;          [27]     S. L. Goertzen, K. D. Th8riault, A. M. Oickle, A. C. Tarasuk, H. A. Andreas,
       b) A. L. Demain, Ind. Biotechnol. 2007, 3, 269 – 283.                                       Carbon 2010, 48, 1252 – 1261.
   [4] N. Tonouchi, H. Ito in Amino Acid Fermentation (Eds.: A. Yokota, M.
       Ikeda), Springer Japan, Tokyo, 2017, pp. 3 – 14.
   [5] A. Aden, M. Ruth, K. Ibsen, J. Jechura, K. Neeves, J. Sheehan, B. Wallace,
       L. Montague, A. Slayton, J. Lukas, Lignocellulosic Biomass to Ethanol Pro-         Manuscript received: April 5, 2020
       cess Design and Economics Utilizing Co-Current Dilute Acid Prehydrolysis           Accepted manuscript online: May 18, 2020
       and Enzymatic Hydrolysis for Corn Stover, NREL/TP-510-32438, National              Version of record online: June 29, 2020

  ChemSusChem 2020, 13, 3614 – 3621              www.chemsuschem.org                  3621         T 2020 The Authors. Published by Wiley-VCH Verlag GmbH & Co. KGaA, Weinheim
You can also read