Point-of-care detection, characterization, and removal of chocolate bloom using a handheld Raman spectrometer - Nature
←
→
Page content transcription
If your browser does not render page correctly, please read the page content below
www.nature.com/scientificreports

            OPEN           Point-of-care detection,
                           characterization, and removal of
                           chocolate bloom using a handheld
                           Raman spectrometer
                           Joshua Heuler1, Siyu He2, Sharad Ambardar3 & Dmitri V. Voronine3,4 ✉

                           Chocolate bloom is an off-white coating on the surface of chocolate products due to the altered
                           distribution of the ingredients. Bloom reduces the shelf-life of chocolate and affects its visual and tactile
                           quality, all of which are serious concerns for chocolate manufacturers and consumers. The automated,
                           rapid, and noninvasive point-of-care detection of chocolate bloom has been an essential but challenging
                           problem. The ability to detect and characterize chocolate bloom using portable laser spectroscopy could
                           be used to develop in-situ quality control sensors. In this work, a handheld Raman spectrometer was
                           used to detect chocolate bloom. Raman spectra acquired from bloomed HERSHEY’S milk chocolate,
                           Hawaiian Host milk chocolate covered macadamia nuts, and Babayevsky Russian dark chocolate were
                           used to characterize the type of bloom. The 1064 nm laser beam of the handheld Raman instrument
                           was used to partially remove the fat bloom of the dark chocolate and to induce sugar bloom on the milk
                           chocolate. The handheld Raman approach has a high potential for industrial and consumer applications
                           for the on-site chemical analysis of chocolate bloom and as an alternative laser-based chocolate
                           decoration.

                           The main components of milk and dark chocolate include cocoa solids, cocoa butter, and sugar, with milk choco-
                           late containing additional milk solids1. The distribution of ingredients in the cocoa butter matrix combined with
                           the crystalline structure of the cocoa are the key determinants of the characteristics of chocolate products2. Cocoa
                           butter has six crystalline forms (polymorphs) numbered according to their thermal stability, with polymorph
                           VI being the most stable3. Polymorph V is preferred by chocolate manufacturers because it gives chocolate its
                           desirable qualities4. The challenge for a chocolate maker is to ensure that their chocolate contains polymorph V
                           when it reaches consumers5. One of the greatest limitations on the shelf-life6 and overall quality1 of chocolate is
                           the formation of chocolate bloom. Chocolate bloom can take on a uniform or a marbled appearance6, and the
                           resulting beige appearance on the surface of the milk or dark chocolate is viewed by consumers as an indicator of
                           poor quality4. Bloom is classified as fat bloom or sugar bloom based on the chemical composition7. However, a
                           combination of both sugar bloom and fat bloom in the same sample has been observed4.
                               Chocolate bloom can be caused by flaws in the chocolate composition (such as fatty fillings8), manufacturing
                           errors (such as poor tempering2), and improper storage in warm and/or humid conditions9. The presence of
                           polymorph VI instead of the polymorph V found in unbloomed chocolate is the main chemical indication of
                           the fat bloom3. When chocolate is heated, the cocoa butter polymorphs separate and recrystallize at the surface4.
                           Cracks in the chocolate from cooling may accelerate the process9. Polymorph VI resists melting during temper-
                           ature fluctuations, which is thought to produce bloom seed crystals for molten cocoa butter to crystallize around
                           upon cooling10. Sugar bloom is caused by a different process. The diffusion of the cocoa alters the distribution of
                           the chocolate ingredients and can trap sugar crystals at the surface1. Sugar bloom can also be caused by moisture
                           dissolving sugar and forming crystals at the surface of the chocolate9. Either bloom formation renders the product
                           unappealing for consumers and manufacturers.

                           1
                            Department of Cell Biology, Microbiology and Molecular Biology, University of South Florida, Tampa, FL, 33620,
                           USA. 2Department of Biomedical Engineering, Columbia University, New York City, NY, 1002, USA. 3Department
                           of Medical Engineering, University of South Florida, Tampa, FL, 33620, USA. 4Department of Physics, University of
                           South Florida, Tampa, FL, 33620, USA. ✉e-mail: voronine@usf.edu

Scientific Reports |   (2020) 10:9833 | https://doi.org/10.1038/s41598-020-66820-1                                                           1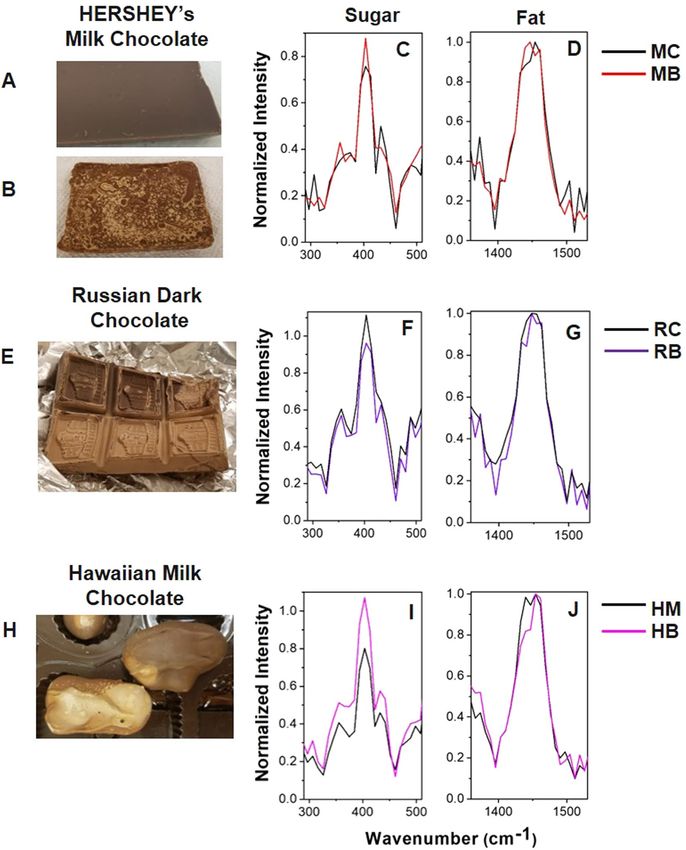
www.nature.com/scientificreports/                                                             www.nature.com/scientificreports

                               Detecting and characterizing chocolate bloom rapidly and inexpensively is a serious challenge for the choc-
                           olate industry. For example, annual production of more than 3.5 million metric tons of chocolate by over 2000
                           companies involving over 200,000 people in Europe has been reported, with over 90% of which were small and
                           medium sized enterprises producing chocolates containing fillings, such as hazelnuts, almonds, macadamia nuts,
                           and others11,12. The complex heterogeneous composition of pure and filled chocolate products, and a variety
                           of manufacturing conditions lead to a large diversity of the causes of chocolate bloom. In particular, the filled
                           chocolate products are especially susceptible to fat bloom formation via complex oil migration mechanisms13,14.
                           The formation of chocolate bloom at the industrial level could happen during the manufacturing and packaging
                           stages and may be due to the variations in the ambient conditions such as temperature and moisture, as well as
                           the chemical compositions of the heterogeneous chocolate products, various fillings, and tempering conditions15.
                           Continuous monitoring and quality control of those parameters has been a challenge. Therefore, monitoring
                           the formation of bloom using a Raman spectrometer might be an important manufacturing feedback system,
                           which could prevent manufacturing of the bloomed products at an early stage of the fabrication process. When
                           Raman spectrometers are more widely available at the consumer level, they could also be used to develop an early
                           warning strategy based on the gradually varying ratios of the Raman peaks of fats and sugars. For example, as
                           described below, the laser treatment could amplify bloom formation under certain conditions, which may provide
                           an early warning signal that blooming process has started, potentially, even in the absence of visual effects.
                               Typically, human panels are used to rate the level of chocolate bloom, but this technique lacks sensitivity and
                           objectivity6. Over the past decade, several theoretical and experimental techniques to detect fat bloom such as the
                           whiteness-index6 and other mathematical models16 have been developed. However, these models require sophis-
                           ticated calibrations to differentiate between degrees of flat bloom6 and have low sensitivity to any changes in the
                           visual description of the chocolate17. Cold stage x-ray photoelectron spectroscopy (XPS) was used to experimen-
                           tally confirm the types of bloom present in chocolate samples based on the observed carbon functional groups4.
                           Other techniques have been applied for the purpose of understanding bloom formation. Atomic force microscopy
                           has been used to observe how the blooming process increases the roughness of the chocolate surface1. X-ray dif-
                           fraction was used to differentiate six polymorphs of cocoa butter3, and it has been more recently used to observe
                           how temperature changes are related to the presence of the VI polymorph in bloomed chocolate1,4.
                               Raman Spectroscopy is a non-invasive, label-free technique that was previously used for laser-based chemical
                           analysis. Broad applications of Raman spectroscopy include agriculture18,19 and the food industry20. Raman spec-
                           troscopy has also been used to analyze the spectra of cocoa butter polymorphs21. Therefore, polymorphs V and
                           VI could be directly discriminated by using Raman spectroscopy. Cocoa butter, a component of milk chocolate1,
                           emits a strong Raman signal21, but studies of milk chocolate and its constituents using Raman spectroscopy with
                           near infrared (785 nm) and visible (532 nm) lasers were limited by the strong fluorescence background from
                           cocoa solids22. Unfortunately, traditional and bulky Raman spectrometers are fixed installations which limit the
                           application of on-site measurements. The use of handheld Raman spectrometers overcomes this limitation and is
                           essential in carrying out mobile Raman measurements. Even in the variable field conditions and environments,
                           portable Raman spectroscopy has been useful in archaeology23 and mineralogy24 where it was difficult to analyze
                           large archaeological samples using traditional bulky microscopes. Additionally, handheld Raman spectrometers
                           have been applied to art25 and rock paintings26. Raman spectroscopy has also been used in the field of forensics27,
                           such as for the identification of bodily fluids28. Therefore, handheld Raman spectroscopy may be considered as a
                           superior technique for the point-of-care chemical chocolate analysis.
                               In this work, we used a 1064 nm handheld Raman spectrometer to detect and characterize fat and sugar
                           bloom on three different types of chocolates, namely HERSHEY’S milk chocolate, Hawaiian Host milk chocolate
                           covered macadamia nuts, and Babayevsky Russian dark chocolate. The 1064 nm laser reduces the fluorescence
                           background and suppresses the sample damage29 from high laser power as compared to 532 nm and 785 nm
                           lasers. In addition to the detection of chocolate bloom, we were also able to partially remove the fat bloom and to
                           induce the sugar bloom on the Babayevsky dark and Hawaiian Host milk chocolate, respectively. Laser-induced
                           bloom could possibly be used as an aesthetic modification of the outer surface of chocolate without modifying
                           the inner composition and taste.

                           Materials and Methods
                           Materials. The unbloomed chocolate samples were purchased from local supermarkets. The brands of choc-
                           olate used were HERSHEY’S milk chocolate (MC), Hawaiian Host Island Macs (HM), i.e. milk chocolate with
                           hazelnuts at the center, and Babayevsky Russian dark chocolate (RC). Bloomed HERSHEY’S Milk chocolate (MB)
                           was obtained by storing a chocolate bar in 23–29 °C ambient air for one week. The bloomed Hawaiian Host
                           chocolate (HB) and the bloomed Babayevsky Russian dark chocolate (RB) were obtained by storage at a similar
                           temperature range for several weeks before being used in the experiments. For the RC and HM chocolates, the
                           smooth, dark, and glossy areas were used to obtain the spectra of the unbloomed chocolate, while the white areas
                           were used to obtain the spectra of the bloomed chocolate. All the chocolate products were used within the shelf
                           time before the corresponding expiration dates. A summary of the relevant nutritional information is shown in
                           Table 1.

                           Instrumentation.        A handheld 1064 nm excitation Raman spectrometer (FirstGuard, Rigaku) was used to
                           obtain the Raman spectra. The schematic arrangement of the experiment is shown in Fig. 1A. The chocolate
                           samples were fixed with clamps on a vertical sample holder, and the handheld Raman instrument was used in
                           point-and-shoot mode to directly illuminate the sample with the laser beam and to collect the scattered Raman
                           signals in the backward direction. The laser point was focused 3 mm from the aperture of the handheld device.
                           For the unbloomed chocolate samples, the laser power was set to 350 mW with 5 s exposure time and 60 accu-
                           mulations. The laser focal spot was ~1 mm. Some of the bloomed chocolate samples showed melting at 350 mW

Scientific Reports |   (2020) 10:9833 | https://doi.org/10.1038/s41598-020-66820-1                                                          2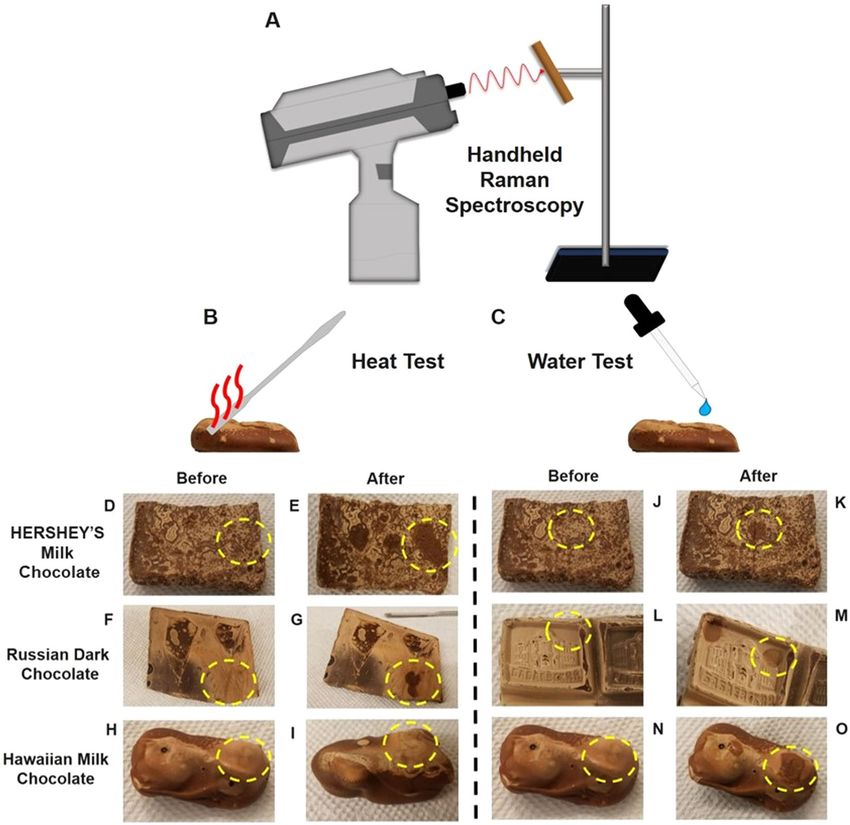
www.nature.com/scientificreports/ www.nature.com/scientificreports
%
Sample % WeightSugar WeightFats Ingredients
HERSHEY’S Milk Cane sugar, milk, cocoa solids, cocoa butter,
56.16 31.5
Chocolate (MC) milk fat, lecithin, natural flavor
Hawaiian Host Milk Cocoa solids, sugar, cocoa butter, milk, soy
50 37.5
Chocolate (HM) lecithin, vanillin, dry roasted macadamia nuts
Russian Dark Ground cocoa, sugar, cocoa powder, cocoa oil,
51.58 36.8
Chocolate (RC) emulsifiers
Table 1. Nutritional information for the commercially available MC, HM, and RC chocolate samples from
™
SmartLabel , Hawaiian Host, and RussianFoodUSA, respectively.
of power. Therefore, to avoid melting, all the spectra of the bloomed samples were obtained at 300 mW power
with the same 5 s exposure time and 60 accumulations. Dark background was taken before every reading and
was subtracted from the raw data. The raw spectra were normalized by dividing the intensity of all bands by the
highest cocoa butter band (1439 cm−1 to 1464 cm−1). The corresponding non-normalized spectra are shown in
Supplementary Information (Figs. S1, S2 and S5). For measuring the Raman signals from the bloomed chocolate
samples, we selected areas of uniform states of bloom formation, which represent mostly bloom with minimal
mixture of the unbloomed areas.
Control Experiments. Two control test experiments were performed to verify the classifications of the
bloom samples based on the Raman data. First, in the water test, a drop of water was placed on the bloom surface
for two minutes before being removed with a paper towel (Fig. 1C). The dissolved bloom was identified as sugar
bloom. Second, the heat test was performed with the end of a metal spatula heated by placing its end on a 40 °C
hot plate for 20 seconds. The spatula was then held against the bloom surface for 10 seconds (Fig. 1B). The melted
bloom was identified as fat bloom. The results of the invasive control experiments are shown in Fig. 1D–O and are
compared to the non-invasive Raman measurements.
Results and Discussion
Bloom Detection. HERSHEY’S Milk Chocolate. The unbloomed and bloomed chocolate samples were
placed in a sample holder shown in Fig. 1A and analyzed with the 1064 nm handheld Raman spectrometer. The
Raman bands were assigned to sucrose22,30, cocoa butter21,22,31 and fats21,22,31 as displayed in Table 2. The spec-
tra were normalized by dividing the intensity of all bands by the highest cocoa butter “fat” band (1439 cm−1 to
1464 cm−1). This and another fats band at 1298 cm−1 are mainly due to the –CH2 deformation22,32. Therefore,
the normalized spectra show the ratios of the given band’s assigned constituent and the level of cocoa butter.
For the Russian dark and Hawaiian milk chocolate, the dark, glossy areas were used to obtain the spectra of the
unbloomed chocolate, while the white areas were used to obtain the spectra of the bloomed chocolate. We opti-
mized the Raman spectral acquisition parameters to obtain high reproducibility and low spectral fluctuations as
shown in the two additional MC replicate measurements in Supplementary Fig. S6.
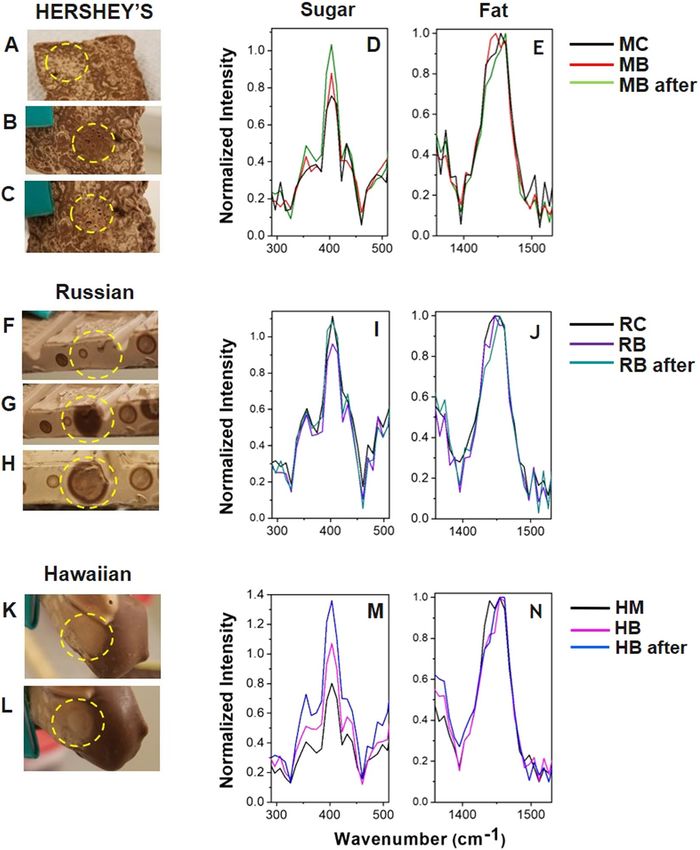
The normalized Raman spectra in Fig. 2C,D show differences between the unbloomed MC (black) and
bloomed MB (red) chocolate samples. The ratio of the sucrose band at 403 cm−1 to the cocoa butter band at
~1439–1446 cm−1 of the bloomed chocolate is higher than that of the unbloomed sample as shown by the larger
intensity of the normalized 403 cm−1 in Fig. 2C (the HB spectra feature a similar, but significantly greater dif-
ference in this band in Fig. 2I). Therefore, the sucrose to cocoa butter ratio is higher in the MB chocolate, as the
chocolate constituents separate during the blooming process. It is possible that sucrose concentration is increased
at the chocolate surface due to the movement of polymorph VI cocoa butter.
Raman spectroscopy suggests that the MB chocolate bloom has both sugar and fat components. Fat bloom
samples are typically comprised of the cocoa butter polymorph VI, which has a melting point of 34 °C27 to 36 °C3.
Applying heat melts the fat bloom faster than the sugar bloom. On the other hand, the sugar bloom is more water
soluble compared to the fat bloom. Figure 1J,K show that placing a water drop on the MB chocolate surface
dissolves the bloom. Figure 1D,E show that the MB bloom melted from the heat of the spatula (the dark regions
indicate melted milk chocolate). The results of these control tests indicate that the MB bloom is a combination
of sugar and fat bloom. Therefore, the control tests corroborate the evidence provided by the handheld Raman
spectrometer. Although chocolate bloom is typically classified as either sugar bloom or fat bloom, a mixture of
the two has been previously reported4. A combination of cryo-scanning electron microscopy, X-ray photoelec-
tron spectroscopy, and environmental scanning electron microscopy was used to detect CH2, C-OH, O = C-OH,
and O-C-O functional groups on the surface of poorly tempered and untampered chocolates, which indicated
the presence of sugar and fat bloom in the same sample4. The effects of emulsifiers such as lecithin and flavor
ingredients such as vanillin have insignificant contributions to Raman spectra of chocolate due to their small
concentrations. For example, the typical concentration of lecithin in chocolate is ~ 0.3–0.6%11.
Babayevsky Russian Dark Chocolate. In contrast to the HERSHEY’S milk chocolate results, the normalized
intensities of the sugar region shown in Fig. 2F are lower in the bloomed RB than in the unbloomed RC at
the 403 cm−1 sucrose band. Therefore, the sucrose to cocoa butter ratio is lower in the bloomed RB sample.
Such changes in the Raman band ratios reflect a decrease in sugars relative to cocoa butter after blooming. This
suggests that the blooming process has reduced the amount of sugars at the chocolate surface. Therefore, the
Raman data suggests that the Russian dark chocolate bloom is fat bloom. The current bloom theory states that the
Scientific Reports | (2020) 10:9833 | https://doi.org/10.1038/s41598-020-66820-1 3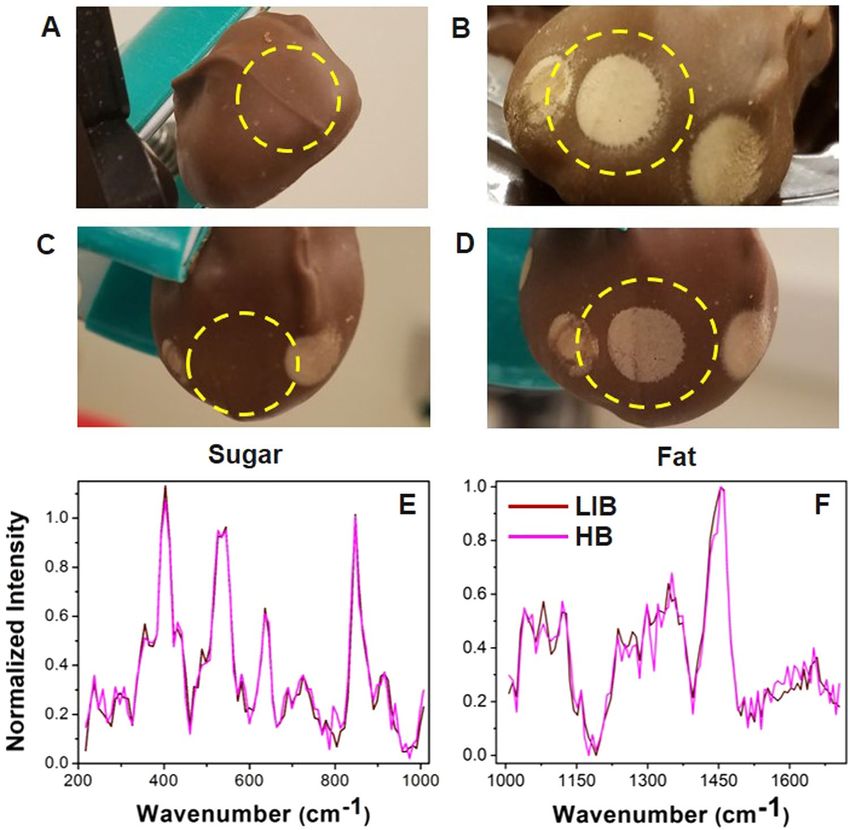
www.nature.com/scientificreports/                                                             www.nature.com/scientificreports

                           Figure 1. Chocolate bloom analysis. (A) Point-and-shoot handheld Raman analysis of a chocolate bar sample
                           fixed on a sample holder and illuminated by a laser beam (red wavy line) from a handheld device. (B) Heat test
                           and (C) water test are used as control tests to confirm the type of bloom. The yellow dashed circles show the
                           areas of control test application. Optical images of the bloomed chocolate samples before (D, F, H) and after
                           (E,G,I) a hot metal spatula was placed on the bloom surface for 20 seconds. The HERSHEY’S milk chocolate
                           bloom (MB) and the Russian dark chocolate bloom (RB) both melted under the heat, which is shown as dark
                           coloured spots in (E,G), respectively. Hawaiian milk chocolate bloom (HB) did not melt under these conditions.
                           Optical images of the bloomed chocolate samples before (J,L,N) and after (K,M,O) a drop of water was
                           placed on the surface for two minutes. After removing the water drop from the surface, the MB and HB were
                           significantly dissolved based on the darker coloration of the spots in (K,O). The RB did not significantly dissolve
                           in water, although a slightly darker spot was observed.

                           separation of the polymorph VI of the cocoa butter can displace other ingredients in the chocolate matrix17. The
                           evidence from the handheld Raman spectrometer suggests that a change in ingredients at the chocolate surface
                           has occurred.
                               The control tests shown in Fig. 1 support the fat bloom Raman data. Figure 1M shows that the RB bloom sur-
                           face was not significantly dissolved by a drop of water. This observation is expected because cocoa butter is made
                           of the hydrophobic TAG molecules33. Furthermore, Fig. 1F,G show that the bloom surface melts when the heat is
                           applied, which is characteristic of the fat bloom. Therefore, the observed RB bloom is fat bloom.

                           Hawaiian Host Milk Chocolate. The ratio of the 403 cm−1 sucrose band to the cocoa butter band is significantly
                           stronger in the bloomed HB (pink) relative to the unbloomed HM (black) as shown in Fig. 2I. Since this data
                           was normalized using the 1454 cm−1 cocoa butter band, then the sugar to cocoa butter ratio increased in the HB
                           bloom dramatically due to a much higher sugar concentration. As shown in the Supplementary Fig. S1E, the
                           non-normalized intensity of the sugar bands approximately doubled in the bloomed HB chocolate.
                               There are additional small differences in the fat region of the Raman spectra. The Supplementary Fig. S1F
                           shows that the fat bands increase significantly in intensity after blooming, but they do not quite double in inten-
                           sity as the sugar bands in Supplementary Fig. S1E. This suggests that the blooming process at the surface of the

Scientific Reports |   (2020) 10:9833 | https://doi.org/10.1038/s41598-020-66820-1                                                          4
www.nature.com/scientificreports/ www.nature.com/scientificreports
Vibrational
Band Assignment MC MB RC RB HC HB Mode
δ(C9–C3–
Sucrose22,30 403 s 403 s 403 s 403 s 403 s 403 s O2), δ(O14–
C4–C3)
535 s 535 s 535 s 535 s 535 s 535 s βR2(A5)
645 m 636 s 636 s 636 s 636 m 636 m βR1(A5)
847 s 847 s 847 s 847 s 847 s 847 s ν (C–C)
Cocoa Butter21,22,31 1055w 1031 m 1039 s — 1039w 1039 m νas(C–C)T
1079w 1080 m 1080 s 1080 s 1079w 1079w ν (C–C)G
1120w 1120 m 1120 s — 1120 m 1120 m νs(C–C)T
Fats21,22,31 1298 m — 1298 m 1298 m 1298 m 1298 m τ (CH2)
Cocoa butter21,22,31 — — 1434 m 1343 m 1351 s 1351 s δ(C–H)
— 1446 s 1446 s 1446 s 1439 m — δ(CH2 )
1454 s 1461w — — 1454 s 1454 s δa(CH3)
Table 2. Spectral band assignments. All spectra acquired for the samples were split into a sugar region
(217 cm−1 to 1000 cm−1) and a fat region (1000 cm−1 to 1700 cm−1). The following abbreviations were used to
indicate the band signal strength: s-strong, m-medium, and w-weak.
HB may be attributed to sugar bloom. Although the Hawaiian Host sample contained macadamia nuts, there
was little evidence to suggest that fat bloom occurred due to the movement of nut oils, which are known to pro-
mote fat bloom34. If macadamia nut oils moved to the surface, then one would expect the Raman spectra to be
dominated by an increase in the relative intensities of the fat bands. However, this was not the case, as the relative
intensities of the sugar bands increased significantly more than those of the fat bands. The relative band intensity
ratios of the normalized sugar bands of the unbloomed and bloomed samples before and after (see below) the
laser treatment are given in Table 3, providing the quantitative analysis of the bloom detection (Fig. 2) and bloom
removal (Fig. 3), respectively. The Supplementary Fig. S7 shows non-normalized Raman spectra of all three sam-
ples of the unbloomed chocolates in the full spectral range from 217 cm−1 to 1800 cm−1. The Supplementary
Fig. S8 shows the Raman spectra of the MC and MB chocolates for different laser powers, which show the absence
of significant differences between the sugar and fat Raman peak ratios.
The results of the water drop test support the classification of HB as sugar bloom. Figure 1N,O show that the
bloom surface is water soluble (the sugar crystals dissolved). Meanwhile, Fig. 1I shows that the bloom surface
is resistant to heat. If the bloom were fat-dominated, the surface would have melted and become darker, but
Fig. 1H,I show that the surface gets whiter.
Laser Bloom Removal. HERSHEY’S Milk Chocolate Bloom. We further investigated the possibility of laser
removal of chocolate bloom and its detection using handheld Raman spectroscopy. The MB chocolate revealed
visible changes during the laser bloom removal. After the MB bloom was exposed to the handheld Raman laser
beam for about five minutes, the white color of the bloom decreased, but the chocolate had small holes at the
surface (Fig. 3A–C). After five minutes of cooling, Fig. 3C shows that the white color of bloom reappears across
the region heated by the laser.
Figure 3D shows that the relative intensity of the 403 cm−1 sucrose band increases in the MB sample after the
laser treatment compared to the original MC and MB samples. This conveys that the sugar to cocoa butter (fats)
ratio has increased, and there is more sugar on the surface. After the laser application melts the surface and the
chocolate cools, the cocoa butter may recrystallize at the surface of the chocolate differently from the natural
chocolate bloom. Sugar crystals may be moved towards the surface in this process as well. Fat bloom normally
forms over a longer time period of melting and recrystallizing of cocoa butter, whereas here the reappearance of
the whitish surface happened in a few minutes.
Russian Dark Chocolate Bloom. The laser-exposure of the RB chocolate bloom temporarily restored the appear-
ance of the dark chocolate in a semi-melted state. The white color of bloom on the RB chocolate disappeared
entirely with no surface damage (Fig. 3F,G). However, after five minutes a light whitish layer appeared on the
surface of the chocolate as shown in Fig. 3H.
The ratio of the 403 cm−1 sucrose band to the cocoa butter band in the fat region increased after the laser
bloom treatment (Fig. 3I). The changes suggest that the heat of the laser melted the chocolate, and as it cooled
the sugars recrystallized in a manner that increased their Raman signals. Unlike the MB chocolate, the returning
white layer was uneven in the RB chocolate. The reforming layers of fat and sugar do not appear to have the same
concentrations as either the bloomed or unbloomed samples. This confirms the partial removal of the fat bloom
on the Russian dark chocolate. The optical and Raman data also suggest that the RB fat bloom was partially con-
verted to sugar bloom.
The practical applications of this laser bloom removal method are currently limited to small areas and short
time after the laser treatment, as well as to a specifically fat bloom type. This work presents a promising step
toward large scale bloom removal. Optimization of laser wavelength, power, and exposure parameters may fur-
ther improve the bloom removal efficiency beyond the first proof-of-principle shown in this work.
Scientific Reports | (2020) 10:9833 | https://doi.org/10.1038/s41598-020-66820-1 5www.nature.com/scientificreports/ www.nature.com/scientificreports
Figure 2. Bloom detection. Optical images of the unbloomed MC (A), bloomed MB (B), unbloomed RC and
bloomed RB (E), and unbloomed HM and bloomed HB (H) chocolates. The normalized Raman spectra of
the sugar (300 cm−1 to 500 cm−1) and fat (1350 cm−1 to 1550 cm−1) spectral regions are shown in (C,F,I) and
(D,G,J), respectively.
Sample Iunbloomed / bloomed before Iunbloomed / bloomed after
HERSHEY’S Milk Chocolate (MC) 0.82 0.67
Hawaiian Host Milk Chocolate (HM) 1.19 1.04
Russian Dark Chocolate (RC) 0.69 0.51
Table 3. Relative band intensity ratios (I) of the normalized sugar bands of the unbloomed and bloomed
samples before (left column) and after (right column) the laser treatment.
Scientific Reports | (2020) 10:9833 | https://doi.org/10.1038/s41598-020-66820-1 6www.nature.com/scientificreports/ www.nature.com/scientificreports
Figure 3. Bloom removal. Optical images of the bloomed chocolate samples before (A,F,K), immediately after
(B,G), and five minutes after (C,H,L) laser treatment. For the HB chocolate, the appearance after treatment
did not change over time, so only two images are shown. The normalized spectra of the sugar (300 cm−1 to
500 cm−1) and fat bands (1350 cm−1 to 1550 cm−1) are shown in the (D,I,M) and (E,J,N) panels, respectively.
Hawaiian Host Milk Chocolate Bloom. The HB chocolate bloom showed a different behavior. Figure 3K,L show
that the HB bloom has a lighter color after the laser application. Figure 3M shows that the sugar to cocoa butter
ratio increased after the treatment. In the Supplementary Figs. S1E,F, the band intensity of the post-treatment
spectra is twice as high as the HB bloom spectra, which is itself approximately double the intensity of the
unbloomed HM chocolate. These changes suggest that laser exposure exacerbates the sugar bloom formation
rather than reducing it.
Laser-Induced Bloom. The laser-chocolate interaction in the HM chocolate (Fig. 4A) resulted in
laser-induced bloom (LIB) that was not observed in other chocolate samples. After a Raman measurement was
taken and the sample cooled for approximately five minutes, a white layer appeared on the surface as a large spot
(dashed circle in Fig. 4B). After a second reading was taken on the same spot with the same laser parameters, the
spot melted (Fig. 4C) and reformed again after five minutes (Fig. 4D). As shown in the Raman spectra in Fig. 4E,F,
the two areas had almost identical signals in terms of band positions and intensities, indicating almost 100%
Scientific Reports | (2020) 10:9833 | https://doi.org/10.1038/s41598-020-66820-1 7www.nature.com/scientificreports/ www.nature.com/scientificreports
Figure 4. Laser-induced bloom. Optical images of HM chocolate before (A) and after (B) acquiring a Raman
spectrum, after the laser was reapplied to the white spot, and melted the bloom (C) and after five minutes, the
spot reappeared (D). Raman spectra of the sugar bloom on the HB chocolate and the white spot (LIB) are split
into sugar (E) and fat (F) spectral regions. The two spectra are almost identical, which suggests that the LIB
white spot is chemically identical to the HB sugar bloom.
bloom formation. The laser induced bloom happens with a sufficient time delay after the Raman measurement.
Therefore, it does not interfere with the process of bloom detection.
When a laser beam was incident on the chocolate, some of the energy was absorbed, and the heat melted the
surface. We hypothesize that when the sample cools, the fat and sugar crystallize in an even, white layer. The
laser-irradiated spot is, therefore, chemically identical sugar bloom, which is supported by the similar Raman
spectra. Laser-induced bloom could be a possible aesthetic etching modification without affecting the bulk of the
chocolate.
Conclusions
Point-of-care handheld 1064 nm Raman spectroscopy was successfully used to detect, characterize, and classify
chocolate bloom in milk and dark chocolate. Differences in absolute and relative intensity, band position, and
noise levels were used to experimentally confirm the presence of bloom. Control bloom tests verified the assign-
ments. Fat bloom interacted with the laser radiation by melting in the immediate vicinity of the laser spot and
then solidifying after a few minutes. The bloom that returned was visually different from the original bloom, and
it had stronger Raman signals, which correspond to sugar bloom. Sugar bloom did not melt, and it lightened in
color upon the laser treatment. Absolute intensities of the Raman signals increased in the sugar bloom as well.
Therefore, laser exposure resulted in the partial removal of fat bloom but did not remove the sugar bloom. Laser
exposure induced bloom formation on the surface of HC milk chocolate. This could be a method of decorating
chocolate products by creating a two-tone effect provided the chocolate is stored in a manner that prevents the
spread of bloom. The current cost of a handheld Raman spectrometer limits the wide practical applications for
chocolate decorations. However, it is envisioned that cheaper chocolate decoration devices could be built using
less expensive lasers without the Raman detection unit.
Received: 26 December 2019; Accepted: 26 May 2020;
Published: xx xx xxxx
Scientific Reports | (2020) 10:9833 | https://doi.org/10.1038/s41598-020-66820-1 8www.nature.com/scientificreports/ www.nature.com/scientificreports
References
1. Hodge, S. M. & Rousseau, D. Fat bloom formation and characterization in milk chocolate observed by atomic force microscopy.
Journal of the American Oil Chemists’ Society 79, 1115–1121 (2002).
2. Seguine, E. S. Tempering—the inside story. Manuf Confect 71, 118–125 (1991).
3. Wille, R. L. & Lutton, E. S. Polymorphism of cocoa butter. Journal of the American Oil Chemists’ Society 43, 491–496 (1966).
4. James, B. J. & Smith, B. G. Surface structure and composition of fresh and bloomed chocolate analysed using X-ray photoelectron
spectroscopy, cryo-scanning electron microscopy and environmental scanning electron microscopy. LWT-Food Science and
Technology 42, 929–937 (2009).
5. Fryer, P. & Pinschower, K. The materials science of chocolate. Mrs Bulletin 25, 25–29 (2000).
6. Nopens, I. et al. Automated image analysis tool for migration fat bloom evaluation of chocolate coated food products. LWT-Food
Science and Technology 41, 1884–1891 (2008).
7. Cerbulis, J., Clay, C. & Mack, C. H. The composition of bloom fat in chocolate. Journal of the American Oil Chemists’ Society 34,
533–537 (1957).
8. Ziegleder, G. & Schwingshandl, I. Kinetics of fat migration within chocolate products. Part III: fat bloom. Lipid/Fett 100, 411–415
(1998).
9. Lonchampt, P. & Hartel, R. W. Fat bloom in chocolate and compound coatings. European Journal of Lipid Science and Technology
106, 241–274 (2004).
10. van Malssen, K., van Langevelde, A., Peschar, R. & Schenk, H. Phase behavior and extended phase scheme of static cocoa butter
investigated with real-time X-ray powder diffraction. Journal of the American Oil Chemists’ Society 76, 669–676 (1999).
11. Depypere, F., Delbaere, C., De Clercq, N. & Dewettinck, K. Fat bloom and cracking of filled chocolates: issues for the European
manufacturer? New Food 12, 9–12 (2009).
12. Delbaere, C., de Walle, V., Depypere, D., Gellynck, F. & Dewettinck, X. K. Relationship between chocolate microstructure, oil
migration, and fat bloom in filled chocolates. European Journal of Lipid Science and Technology 118, 1800–1826 (2016).
13. Widlak, N. R. & Hartel, R. W. Causes and best manufacturing practices to minimize bloom in confections. In Cocoa Butter and
Related Compounds 173–194 (Elsevier, 2012).
14. Reinke, S. K. et al. Tracking structural changes in lipid-based multicomponent food materials due to oil migration by microfocus
small-angle X-ray scattering. ACS applied materials & interfaces 7, 9929–9936 (2015).
15. Lonchampt, P. & Hartel, R. W. Surface bloom on improperly tempered chocolate. European Journal of Lipid Science and Technology
108, 159–168 (2006).
16. Foubert, I., Vanrolleghem, P. A., Vanhoutte, B. & Dewettinck, K. Dynamic mathematical model of the crystallization kinetics of fats.
Food research international 35, 945–956 (2002).
17. Bricknell, J. & Hartel, R. W. Relation of fat bloom in chocolate to polymorphic transition of cocoa butter. Journal of the American Oil
Chemists’ Society 75, 1609–1615 (1998).
18. Farber, C. & Kurouski, D. Detection and identification of plant pathogens on maize kernels with a hand-held Raman spectrometer.
Analytical chemistry 90, 3009–3012 (2018).
19. Yang, D. & Ying, Y. Applications of Raman spectroscopy in agricultural products and food analysis: A review. Applied Spectroscopy
Reviews 46, 539–560 (2011).
20. Almeida, M. R. et al. Determination of amylose content in starch using Raman spectroscopy and multivariate calibration analysis.
Analytical and bioanalytical chemistry 397, 2693–2701 (2010).
21. Bresson, S., Rousseau, D., Ghosh, S., Marssi, M. E. & Faivre, V. Raman spectroscopy of the polymorphic forms and liquid state of
cocoa butter. European journal of lipid science and technology 113, 992–1004 (2011).
22. Larmour, I. A., Faulds, K. & Graham, D. Rapid Raman mapping for chocolate analysis. Analytical Methods 2, 1230–1232 (2010).
23. Short, L. et al. Facile residue analysis of recent and prehistoric cook stones using handheld Raman spectrometry. Journal of Raman
Spectroscopy 46, 126–132 (2015).
24. Jehlička, J., Culka, A., Vandenabeele, P. & Edwards, H. G. Critical evaluation of a handheld Raman spectrometer with near infrared
(785 nm) excitation for field identification of minerals. Spectrochimica Acta Part A: Molecular and Biomolecular Spectroscopy 80,
36–40 (2011).
25. Vandenabeele, P. et al. Comparative study of mobile Raman instrumentation for art analysis. Analytica Chimica Acta 588, 108–116
(2007).
26. Olivares, M. et al. Non-invasive portable instrumentation to study Palaeolithic rock paintings: the case of La Peña Cave in San
Roman de Candamo (Asturias, Spain). Journal of Archaeological Science 40, 1354–1360 (2013).
27. Kurouski, D. & Van Duyne, R. P. In situ detection and identification of hair dyes using surface-enhanced Raman spectroscopy
(SERS). Analytical chemistry 87, 2901–2906 (2015).
28. Sikirzhytski, V., Sikirzhytskaya, A. & Lednev, I. K. Multidimensional Raman spectroscopic signatures as a tool for forensic
identification of body fluid traces: a review. Applied spectroscopy 65, 1223–1232 (2011).
29. Petry, R., Schmitt, M. & Popp, J. Raman spectroscopy—a prospective tool in the life sciences. ChemPhysChem 4, 14–30 (2003).
30. Brizuela, A. B. et al. A complete characterization of the vibrational spectra of sucrose. Carbohydrate research 361, 212–218 (2012).
31. de Oliveira, L. N., Castro, J. C., de, R., de Oliveira, M. A. L. & de Oliveira, L. F. C. Lipid characterization of white, dark, and milk
chocolates by FT-Raman spectroscopy and capillary zone electrophoresis. Journal of AOAC International 98, 1598–1607 (2015).
32. Baeten, V., Hourant, P., Morales, M. T. & Aparicio, R. Oil and fat classification by FT-Raman spectroscopy. Journal of Agricultural
and Food Chemistry 46, 2638–2646 (1998).
33. Motoyama, M. Structure and phase characterization of triacylglycerols by raman spectroscopy. Bulletin NARO Institute of Livestock
and Grassland Science 12, 19–68 (2012).
34. Smith, K. W., Cain, F. W. & Talbot, G. Effect of nut oil migration on polymorphic transformation in a model system. Food chemistry
102, 656–663 (2007).
Author contributions
S.H. and D.V.V. conceived the project. J.H. and S.A. performed the experiments and analyzed the data. All authors
wrote the manuscript. D.V.V. supervised the project.
Competing interests
The authors declare no competing interests.
Additional information
Supplementary information is available for this paper at https://doi.org/10.1038/s41598-020-66820-1.
Correspondence and requests for materials should be addressed to D.V.V.
Reprints and permissions information is available at www.nature.com/reprints.
Scientific Reports | (2020) 10:9833 | https://doi.org/10.1038/s41598-020-66820-1 9www.nature.com/scientificreports/ www.nature.com/scientificreports
Publisher’s note Springer Nature remains neutral with regard to jurisdictional claims in published maps and
institutional affiliations.
Open Access This article is licensed under a Creative Commons Attribution 4.0 International
License, which permits use, sharing, adaptation, distribution and reproduction in any medium or
format, as long as you give appropriate credit to the original author(s) and the source, provide a link to the Cre-
ative Commons license, and indicate if changes were made. The images or other third party material in this
article are included in the article’s Creative Commons license, unless indicated otherwise in a credit line to the
material. If material is not included in the article’s Creative Commons license and your intended use is not per-
mitted by statutory regulation or exceeds the permitted use, you will need to obtain permission directly from the
copyright holder. To view a copy of this license, visit http://creativecommons.org/licenses/by/4.0/.
© The Author(s) 2020
Scientific Reports | (2020) 10:9833 | https://doi.org/10.1038/s41598-020-66820-1 10You can also read