Giant nonlinear optical responses from photon-avalanching nanoparticles - Columbia University
←
→
Page content transcription
If your browser does not render page correctly, please read the page content below
Article

Giant nonlinear optical responses from
photon-avalanching nanoparticles

https://doi.org/10.1038/s41586-020-03092-9                     Changhwan Lee1, Emma Z. Xu1, Yawei Liu2,3, Ayelet Teitelboim2, Kaiyuan Yao1,
                                                               Angel Fernandez-Bravo2,8,9, Agata M. Kotulska4, Sang Hwan Nam5, Yung Doug Suh5,6 ✉,
Received: 10 July 2020
                                                               Artur Bednarkiewicz4 ✉, Bruce E. Cohen2,7 ✉, Emory M. Chan2 ✉ & P. James Schuck1 ✉
Accepted: 17 November 2020

Published online: 13 January 2021
                                                               Avalanche phenomena use steeply nonlinear dynamics to generate
    Check for updates                                          disproportionately large responses from small perturbations, and are found in a
                                                               multitude of events and materials1. Photon avalanching enables technologies such as
                                                               optical phase-conjugate imaging2, infrared quantum counting3 and efficient
                                                               upconverted lasing4–6. However, the photon-avalanching mechanism underlying
                                                               these optical applications has been observed only in bulk materials and aggregates6,7,
                                                               limiting its utility and impact. Here we report the realization of photon avalanching at
                                                               room temperature in single nanostructures—small, Tm3+-doped upconverting
                                                               nanocrystals—and demonstrate their use in super-resolution imaging in near-infrared
                                                               spectral windows of maximal biological transparency. Avalanching nanoparticles
                                                               (ANPs) can be pumped by continuous-wave lasers, and exhibit all of the defining
                                                               features of photon avalanching, including clear excitation-power thresholds,
                                                               exceptionally long rise time at threshold, and a dominant excited-state absorption
                                                               that is more than 10,000 times larger than ground-state absorption. Beyond the
                                                               avalanching threshold, ANP emission scales nonlinearly with the 26th power of the
                                                               pump intensity, owing to induced positive optical feedback in each nanocrystal. This
                                                               enables the experimental realization of photon-avalanche single-beam
                                                               super-resolution imaging7 with sub-70-nanometre spatial resolution, achieved by
                                                               using only simple scanning confocal microscopy and without any computational
                                                               analysis. Pairing their steep nonlinearity with existing super-resolution techniques
                                                               and computational methods8–10, ANPs enable imaging with higher resolution and at
                                                               excitation intensities about 100 times lower than other probes. The low
                                                               photon-avalanching threshold and excellent photostability of ANPs also suggest their
                                                               utility in a diverse array of applications, including sub-wavelength imaging7,11,12 and
                                                               optical and environmental sensing13–15.

The primary advantage of photon avalanching (PA) is its combination                           PA, a single ground-state absorption (GSA) event initiates a chain reac-
of extreme nonlinearity and efficiency, achieved without any periodic                         tion of excited-state absorption (ESA) and cross-relaxation events
structuring or interference effects. PA was first observed over 40 years                      between lanthanide (Ln3+) ions, resulting in the emission of many
ago in Pr3+-doped bulk crystals, which exhibited a sudden increase                            upconverted photons (Fig. 1a and Methods). The sensitivity of Ln3+
in upconverted luminescence when excited beyond a critical pump                               photophysics to local material properties has precluded the realization
laser intensity3. Its discovery quickly led to the development of other                       of PA in nanomaterials. Avalanche-like behaviour in previous nanopar-
lanthanide-based bulk PA materials—used, for example, in efficient                            ticle designs was ultimately the result of the formation of larger aggre-
upconverted lasers4–6,16—and its unique properties continue to spark                          gate materials18, non-PA thermal mechanisms19,20 or pre-avalanche
interest over diverse fields6,7.                                                              energy looping6,11,13,21–27, with nonlinear order s ranging from 2 to 7 (s is
   PA is a positive-feedback system6 analogous to the second-order                            defined by Ie = I ps , where Ie is the emission intensity and Ip is the pump
phase transition of ferromagnetic spin systems—a comparison that                              intensity)7,11,22. There remains strong motivation for developing PA in
has proved to be useful for modelling the process5,17. In lanthanide-based                    nanoparticles, given that the ability to process these colloidal

1
 Department of Mechanical Engineering, Columbia University, New York, NY, USA. 2The Molecular Foundry, Lawrence Berkeley National Laboratory, Berkeley, CA, USA. 3State Key Laboratory
of Rare Earth Resource Utilization, Changchun Institute of Applied Chemistry, Chinese Academy of Sciences, Changchun, China. 4Institute of Low Temperature and Structure Research,
Polish Academy of Sciences, Wroclaw, Poland. 5Laboratory for Advanced Molecular Probing (LAMP), Korea Research Institute of Chemical Technology (KRICT), DaeJeon, South Korea.
6
 School of Chemical Engineering, Sungkyunkwan University (SKKU), Suwon, South Korea. 7Division of Molecular Biophysics and Integrated Bioimaging, Lawrence Berkeley National
Laboratory, Berkeley, CA, USA. 8Present address: SUPA, School of Physics and Astronomy, University of St Andrews, St Andrews, UK. 9Present address: Centre of Biophotonics, University of
St Andrews, St Andrews, UK. ✉e-mail: ydsuh@krict.re.kr; a.bednarkiewicz@intibs.pl; becohen@lbl.gov; emchan@lbl.gov; p.j.schuck@columbia.edu

230 | Nature | Vol 589 | 14 January 2021
a b Before c
Photon avalanche Compare: ETU
threshold PA Saturation GSA ESA Cross- Emission
Tm3+
relaxation
Core Tm3+
Yb3+ 15
3F
2,3
106
GSA GSA R2
Inert shell
3H
4
ESA W3
Tm3+ concentration 105
Emission intensity (a.u.)
≥ 8%
Energy (×103 cm–1)
Cross- 10
relaxation 104 3H
s31 5
Slope > 15
103
3F
4
5
W2
102
R1
101
1,450 nm 3H
0 6
101 102 1,064 nm 800 nm
Upconverted avalanching emission (800 nm) Excitation intensity (a.u.)
Tm3+ Tm3+
3
H4 Weak photon absorption Photon absorption Yb3+–Tm3+
3
3
F4 Tm3+ ion (1,064 nm) (980 nm) energy transfer Multi-phonon relaxation
H6
Photon absorption Photon emission Tm3+–Tm3+
2
2
F 5/2 Yb3+ ion (1,064 nm) (800 nm) cross-relaxation
F 7/2
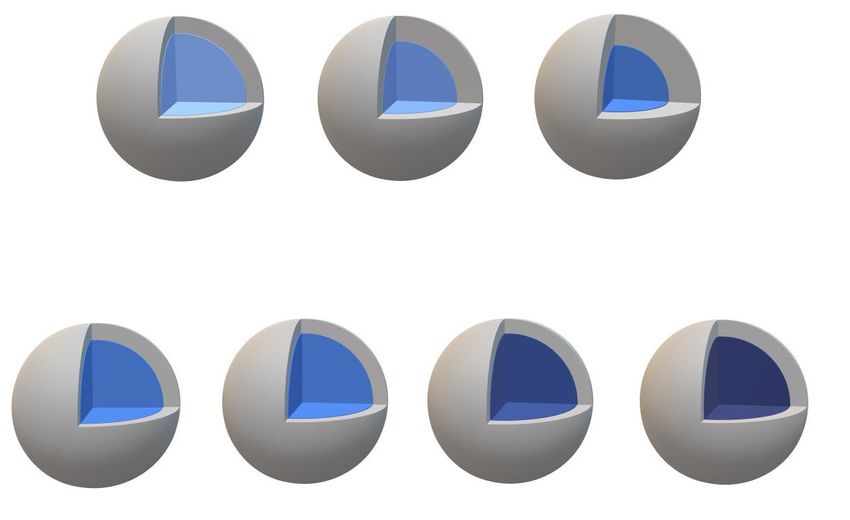
Fig. 1 | PA mechanism in Tm3+-doped nanocrystals. a, Core–shell ANPs, with R 2 denote the ground- and excited-state excitation rates, respectively. W2 and
avalanching occurring when the core Tm3+ concentration is ≥8%. Inset, W3 are the aggregate rates of relaxation from the 3F4 and 3H4 levels, respectively.
standard energy-transfer upconversion (ETU) process, in which Yb3+ ions These rates account for radiative and non-radiative relaxation pathways but
sensitize ground-state absorption, precluding PA. b, Model plot of emission exclude cross-relaxation and other energy-transfer processes. s31,
intensity versus excitation intensity, showing the three stages of PA behaviour. cross-relaxation rate; a.u., arbitrary units.
c, Energy levels of the 4f 12 manifolds of Tm3+ and their transitions. R 1 and
nanomaterials in solution allows them to be incorporated into various regime, with s ≤ 7 (Fig. 2a). At these Tm3+ concentrations, the chain reac-
device platforms, nanotechnologies and environments23,28, using bio- tion of ESA and cross-relaxation is too slow to compensate for radiative
compatible surface chemistries28–31 and materials32. and multiphonon relaxation from the 3F4 intermediate state, which
To design nanocrystals that may be capable of PA, we combined occurs with a rate of W2. However, at 8% Tm3+ doping, a clear threshold is
four key elements: (1) the recent design paradigm for upconvert- observed at pump intensity of about 20 kW cm−2 (Supplementary Fig. 3
ing nanoparticles, which emphasizes high Ln3+ content and energy and Table 3), beyond which the combination of cross-relaxation and
confinement23,29,33–37; (2) the choice of Tm3+ (Fig. 1a), with its slow ESA act as a gain, and a nonlinear slope of s > 22 is achieved (Fig. 2a, grey
intermediate-state decay rate W2; (3) compositions that omit sen- circles), surpassing the maximum value of 7 observed in the existing
sitizers22 (for example, Yb3+ in Fig. 1a, inset); and (4) the selection of pre-avalanching systems. Up- and down-scans of excitation intensity
excitation wavelengths in the second near-infrared window (NIR-II) display no measurable photobleaching nor hysteresis, thus showing no
(either 1,064 nm or 1,450 nm; Fig. 1c) optimized for resonant ESA, in detectable contribution from excitation-induced thermal avalanching
contrast to the usual Tm3+ ground-state pumping wavelengths (800 nm, (Supplementary Information Fig. 4)39. Critically, all three PA criteria are
or 980 nm with Yb3+ sensitization; Fig. 1)6,11,12,21,38. These design speci- met at room temperature for these 8% Tm3+ ANPs (Fig. 2).
fications enabled us to synthesize Tm3+-doped β-NaYF4 core–shell To understand why 8% Tm3+ doping gives rise to such nonlinear emis-
structures 16–33 nm in total diameter29,33 (Methods; Supplementary sion, we modelled the PA process in ANPs using coupled nonlinear dif-
Figs. 1, 2; and Supplementary Tables 1, 2), which are excited in the NIR-II ferential rate equations17,40 (DREs; see Supplementary Information and
region and emit in the NIR-I region at 800 nm (ref. 22). Supplementary Tables 4–8). Fitting the model to the experimental data
To determine whether PA occurs, we examined the nanoparticles for 8% Tm3+ ANPs (Fig. 2a, grey dash-dotted line) yields an ESA-to-GSA
for three definitive criteria5,6: (i) stronger pump-laser-induced ESA rate (R2/R1) ratio of more than 10,000 (Supplementary Table 6), satisfy-
compared to GSA, with the ratio of ESA to GSA rates exceeding 104 ing the R2/R1 > 104 criterion for PA6,41.
(R2/R1 in Fig. 1c)22; (ii) a clear excitation-power threshold, above which To observe the signature slow-down in the excited-state population
a large nonlinear increase in excited-state population and emission is rise times expected for PA4,6,17,42, time-dependent luminescence from the
observed; and (iii) a slowdown of the excited-state population rise time Tm3+ 3H4 level (800 nm emission) was measured (Fig. 2b; Methods and
at threshold. For PA, rise times typically reach more than 100 times the Supplementary Figs. 6–8). The rise time is defined as the time needed to
lifetime of the intermediate state, up to seconds6. Together, these reach 95% of the asymptotic value (Supplementary Fig. 7). We observe
criteria delineate PA from other nonlinear multiphoton processes, that a substantial lengthening of the luminescence rise time emerges
including conventional energy-transfer upconversion (Fig. 1a inset) near the PA threshold intensity, reaching a maximum of approximately
and energy looping22. 608 ms (Fig. 2b)—nearly 400 times the lifetime of the 3F4 state—further
Plots of Tm3+ emission at 800 nm versus 1,064 nm pump intensity verifying that the PA mechanism prevails in these nanoparticles.
measured on nanoparticle ensembles drop-casted onto glass substrates Our modelling also predicts PA for even longer-wavelength excitation
show that as Tm3+ content is increased from 1% to 4%, the degree of near 1,450 nm, resonant with ESA between 3F4 and 3H4, but not with GSA
nonlinearity s also increases, but resides firmly in the energy looping (Fig. 1c). This is a technologically attractive wavelength range because
Nature | Vol 589 | 14 January 2021 | 231Article
a ratio. The changes indeed result in a distinct reduction in threshold,
106
1% Tm, 1,064 nm toa b c
40 50
8% Tm 4%
106 8%
40
35 20%
Quantum yield (%)
30
104 s = 22.2
s = 20.8 30
Core/shell size 20
Emission intensity (a.u.)
102 s = 26.0 10/4.0 nm
25
Threshold (kW cm–2)
17/5.6 nm 10
16/8.5 nm
100 20 0
4%
106 800 8%
15 20%
Brightness (a.u.)
600
104
10
s = 26.0 s = 31.6 400
102 s = 15.5 8% Tm
5 Model, 8% Tm
20% Tm 200
Model, 20% Tm
100% Tm
Model, 100% Tm
100 0 0
101 102 0 500 1,000 1,500 101 102
Excitation intensity (kW cm–2) Relaxation rate, W2 (s–1) Excitation intensity (kW cm–2)
Fig. 3 | Modifying PA kinetics via ANP shell thickness, surface-to-volume PA DRE model to the data. All measurements were performed on ensemble
ratio and Tm3+ content. a, Top, 800-nm emission intensity versus 1,064-nm films. b, Threshold intensity versus W2, extracted from the data in a, showing
excitation intensity curves for different core sizes and shell thicknesses of 8% linear dependencies on W2, with slopes that depend on s31. Error bars are
Tm3+-doped ANPs. Bottom, ANPs with different Tm3+ concentrations. determined from the standard deviations of the curve fittings shown in
Green × symbols: 8% Tm3+, same as top panel. Red triangles: 20% Tm3+ Supplementary Fig. 3. c, d, Calculations of upconverting quantum yield (c) and
(see Supplementary Information for sample details; data for sample 7 are brightness (d) versus excitation intensity for 4%, 8% and 20% Tm3+, using values
shown; the curve for sample 6 with 20% Tm3+ is shown in Supplementary Figs. 3, from model fits to the green circles and red squares in a, and the blue circles in
5). Purple + symbols: 100% Tm3+. See Supplementary Tables 1, 2 for measured Fig. 2a.
dimensions and their standard deviations. The dash-dotted lines are fits of the
resolution would be realized automatically with ANPs during standard methods such as nonlinear structured illumination microscopy and
SCM. The imaging requires no complex instrumentation, excitation near-infrared emission saturation49 nanoscopy for a given photon
beam shaping or patterning, image post-processing, or alignment budget9,10. Additionally, applying the photon localization accuracy
procedures7. concept to PASSI images (Fig. 4b), which already exhibit sub-100-nm
We performed single-ANP imaging, measuring a PASSI image spot of resolution, yields a localization accuracy ofArticle
a b c
9.9 kW cm−2 7.1 kW cm−2
500 nm 1 500 nm 1
Photon localization
accuracy1. Turcotte, D. L. Self-organized criticality. Rep. Prog. Phys. 62, 1377–1429 (1999). 28. Zhou, B., Shi, B., Jin, D. & Liu, X. Controlling upconversion nanocrystals for emerging
2. Ni, H. & Rand, S. C. Avalanche phase conjugation. Opt. Lett. 17, 1222–1224 (1992). applications. Nat. Nanotechnol. 10, 924–936 (2015).
3. Chivian, J. S., Case, W. E. & Eden, D. D. The photon avalanche: a new phenomenon in Pr3+‐ 29. Tian, B. et al. Low irradiance multiphoton imaging with alloyed lanthanide nanocrystals.
based infrared quantum counters. Appl. Phys. Lett. 35, 124–125 (1979). Nat. Commun. 9, 3082 (2018).
4. Lenth, W. & Macfarlane, R. M. Excitation mechanisms for upconversion lasers. J. Lumin. 30. Tajon, C. A. et al. Photostable and efficient upconverting nanocrystal-based chemical
45, 346–350 (1990). sensors. Opt. Mater. 84, 345–353 (2018).
5. Joubert, M.-F. Photon avalanche upconversion in rare earth laser materials. Opt. Mater. 11, 31. Bünzli, J.-C. G. & Piguet, C. Taking advantage of luminescent lanthanide ions. Chem. Soc.
181–203 (1999). Rev. 34, 1048–1077 (2005).
6. Auzel, F. Upconversion and anti-Stokes processes with f and d ions in solids. Chem. Rev. 32. Gnach, A., Lipinski, T., Bednarkiewicz, A., Rybka, J. & Capobianco, J. A. Upconverting
104, 139–174 (2004). nanoparticles: assessing the toxicity. Chem. Soc. Rev. 44, 1561–1584 (2015).
7. Bednarkiewicz, A., Chan, E. M., Kotulska, A., Marciniak, L. & Prorok, K. Photon avalanche in 33. Gargas, D. J. et al. Engineering bright sub-10-nm upconverting nanocrystals for
lanthanide doped nanoparticles for biomedical applications: super-resolution imaging. single-molecule imaging. Nat. Nanotechnol. 9, 300 (2014).
Nanoscale Horiz. 4, 881–889 (2019). 34. Fischer, S., Bronstein, N. D., Swabeck, J. K., Chan, E. M. & Alivisatos, A. P. Precise tuning of
8. Thompson, M. A., Lew, M. D. & Moerner, W. E. Extending microscopic resolution with surface quenching for luminescence enhancement in core–shell lanthanide-doped
single-molecule imaging and active control. Annu. Rev. Biophys. 41, 321–342 (2012). nanocrystals. Nano Lett. 16, 7241–7247 (2016).
9. Gustafsson, M. G. L. Nonlinear structured-illumination microscopy: wide-field 35. Johnson, N. J. J. et al. Direct evidence for coupled surface and concentration quenching
fluorescence imaging with theoretically unlimited resolution. Proc. Natl Acad. Sci. USA dynamics in lanthanide-doped nanocrystals. J. Am. Chem. Soc. 139, 3275–3282 (2017).
102, 13081 (2005). 36. Liu, Q. et al. Single upconversion nanoparticle imaging at sub-10 W cm−2 irradiance. Nat.
10. Heintzmann, R. & Huser, T. Super-resolution structured illumination microscopy. Chem. Photon. 12, 548–553 (2018).
Rev. 117, 13890–13908 (2017). 37. Chen, X. et al. Confining energy migration in upconversion nanoparticles towards deep
11. Denkova, D. et al. 3D sub-diffraction imaging in a conventional confocal configuration by ultraviolet lasing. Nat. Commun. 7, 10304 (2016).
exploiting super-linear emitters. Nat. Commun. 10, 3695 (2019). 38. Wang, F. et al. Tuning upconversion through energy migration in core–shell
12. Liu, Y. et al. Super-resolution mapping of single nanoparticles inside tumor spheroids. nanoparticles. Nat. Mater. 10, 968–973 (2011).
Small 16, 1905572 (2020). 39. Gamelin, D. R., Lüthi, S. R. & Güdel, H. U. The role of laser heating in the intrinsic optical
13. Marciniak, L., Bednarkiewicz, A. & Elzbieciak, K. NIR–NIR photon avalanche based bistability of Yb3+-doped bromide lattices. J. Phys. Chem. B 104, 11045–11057 (2000).
luminescent thermometry with Nd3+ doped nanoparticles. J. Mater. Chem. C 6, 7568–7575 40. Butcher, J. C. Numerical Methods for Ordinary Differential Equations (Wiley, 2016).
(2018). 41. Goldner, P. & Pelle, F. Photon avalanche fluorescence and lasers. Opt. Mater. 5, 239–249
14. Pickel, A. D. et al. Apparent self-heating of individual upconverting nanoparticle (1996).
thermometers. Nat. Commun. 9, 4907 (2018). 42. Joubert, M. F., Guy, S. & Jacquier, B. Model of the photon-avalanche effect. Phys. Rev. B
15. Lay, A. et al. Optically robust and biocompatible mechanosensitive upconverting 48, 10031–10037 (1993).
nanoparticles. ACS Cent. Sci. 5, 1211–1222 (2019). 43. Hong, G. et al. Through-skull fluorescence imaging of the brain in a new near-infrared
16. Xie, P. & Gosnell, T. R. Room-temperature upconversion fiber laser tunable in the red, window. Nat. Photon. 8, 723–730 (2014).
orange, green, and blue spectral regions. Opt. Lett. 20, 1014–1016 (1995). 44. Ostrowski, A. D. et al. Controlled synthesis and single-particle imaging of bright,
17. Guy, S., Joubert, M. F. & Jacquier, B. Photon avalanche and the mean-field approximation. sub-10 nm lanthanide-doped upconverting nanocrystals. ACS Nano 6, 2686–2692
Phys. Rev. B 55, 8240–8248 (1997). (2012).
18. Deng, H., Yang, S., Xiao, S., Gong, H.-M. & Wang, Q.-Q. Controlled synthesis and 45. Hossan, M. Y. et al. Explaining the nanoscale effect in the upconversion dynamics of
upconverted avalanche luminescence of cerium(III) and neodymium(III) orthovanadate β-NaYF4:Yb3+, Er3+ core and core–shell nanocrystals. J. Phys. Chem. C 121, 16592–16606
nanocrystals with high uniformity of size and shape. J. Am. Chem. Soc. 130, 2032–2040 (2017).
(2008). 46. Teitelboim, A. et al. Energy transfer networks within upconverting nanoparticles are
19. Wang, Q.-Q. et al. Highly efficient avalanche multiphoton luminescence from coupled Au complex systems with collective, robust, and history-dependent dynamics. J. Phys.
nanowires in the visible region. Nano Lett. 7, 723–728 (2007). Chem. C 123, 2678–2689 (2019).
20. Ma, Z. et al. Origin of the avalanche-like photoluminescence from metallic nanowires. 47. Chan, E. M., Gargas, D. J., Schuck, P. J. & Milliron, D. J. Concentrating and recycling energy
Sci. Rep. 6, 18857 (2016). in lanthanide codopants for efficient and spectrally pure emission: the case of NaYF4:Er3+/
21. Liu, Y. et al. Amplified stimulated emission in upconversion nanoparticles for Tm3+ upconverting nanocrystals. J. Phys. Chem. B 116, 10561–10570 (2012).
super-resolution nanoscopy. Nature 543, 229–233 (2017). 48. Corle, T. R. & Kino, G. S. Confocal Scanning Optical Microscopy and Related Imaging
22. Levy, E. S. et al. Energy-looping nanoparticles: harnessing excited-state absorption for Systems (Academic Press, 1996).
deep-tissue imaging. ACS Nano 10, 8423–8433 (2016). 49. Chen, C. et al. Multi-photon near-infrared emission saturation nanoscopy using
23. Fernandez-Bravo, A. et al. Continuous-wave upconverting nanoparticle microlasers. Nat. upconversion nanoparticles. Nat. Commun. 9, 3290 (2018).
Nanotechnol. 13, 572–577 (2018). 50. Pichaandi, J., Boyer, J.-C., Delaney, K. R. & van Veggel, F. C. J. M. Two-photon
24. Si, X., Li, Z., Qu-Quan, W., Hong, D. & Shi-He, Y. Energy transfer and avalanche upconversion laser (scanning and wide-field) microscopy using Ln3+-doped NaYF4
upconversion of NdxY1 − xVO4 nanocrystals. Chin. Phys. Lett. 26, 124209 (2009). upconverting nanocrystals: a critical evaluation of their performance and potential in
25. Bednarkiewicz, A. & Strek, W. Laser-induced hot emission in Nd3+/Yb3+:YAG nanocrystallite bioimaging. J. Phys. Chem. C 115, 19054–19064 (2011).
ceramics. J. Phys. D 35, 2503–2507 (2002).
26. Dwivedi, Y., Bahadur, A. & Rai, S. B. Optical avalanche in Ho:Yb:Gd2O3 nanocrystals. Publisher’s note Springer Nature remains neutral with regard to jurisdictional claims in
J. Appl. Phys. 110, 043103 (2011). published maps and institutional affiliations.
27. Wang, G., Peng, Q. & Li, Y. Luminescence tuning of upconversion nanocrystals. Chemistry
16, 4923–4931 (2010). © The Author(s), under exclusive licence to Springer Nature Limited 2021
Nature | Vol 589 | 14 January 2021 | 235Article
Methods 200 kV, a FEI Themis 60-300 STEM/TEM operating at an acceleration
voltage of 300 kV and a Tecnai T20 S-TWIN TEM operating at 200 kV
Materials with a LaB6 filament. Size statistics were acquired for approximately
Sodium trifluoroacetate (Na-TFA, 98%), sodium oleate, ammonium 100 nanoparticles using ImageJ software. X-ray diffraction measure-
fluoride (NH4F), yttrium chloride (YCl3, anhydrous, 99.99%), thulium ments were performed using a Bruker D8 Discover diffractometer with
chloride (TmCl3, anhydrous, >99.9%), gadolinium chloride (GdCl3, anhy- Cu Kα radiation. The average core diameter and shell sizes are given
drous, 99.99%), yttrium trifluoroacetate (>99.99%), oleic acid (OA, 90%) in Fig. 3a. We note that the larger cores are slightly prolate in shape
and 1-octadecene (ODE, 90%) were purchased from Sigma-Aldrich. (Supplementary Fig. 2).
Synthesis of core ANPs Preparation of nanocrystal film samples
The synthesis of NaY1−xTmxF4 ANP cores with average diameters ranging Nanoparticles (40 μl of a 1 μM suspension in hexane) were either
from d = 10 nm to 18 ± 1 nm (see Supplementary Table 1) was based on drop-cast or spin-coated on a coverslip. Atomic force microscopy
reported procedures44. For the case of x = 0.01 (meaning 1% Tm3+ doping), measurements (Bruker Dimension AFM) were performed to measure
YCl3 (0.99 mmol, 193.3 mg) and TmCl3 (0.01 mmol, 2.8 mg) were added the thicknesses of the films.
into a 50-ml three-neck flask, followed by an addition of 6 ml OA and
14 ml ODE. The solution was stirred under vacuum and heated to 100 °C Optical characterization of ANPs
for 1 h. During this time, the solution became clear. After that, the flask For single-ANP imaging, a dilute dispersion of nanoparticles was depos-
was subjected to three pump–purge cycles, each consisting of refill- ited on a glass coverslip and placed on an inverted confocal microscope
ing with N2 and immediately pumping under vacuum to remove water (Nikon, Eclipse Ti-S inverted microscope). A 1,064-nm continuous-wave
and oxygen. Afterwards, sodium oleate (2.5 mmol, 762 mg) and NH4F diode laser (Thorlabs, FELH 750) or a Ti-sapphire pulsed laser (Coherent,
(4 mmol, 148 mg) were added to the flask under N2 flow. Subsequently, Chameleon OPO Vis, 1,390–1,510 nm, 80 MHz) were directed into the
the resealed flask was placed under vacuum for 15 min at 100 °C, followed back aperture of an NA = 1.49 100× immersion-oil objective (Olympus)
by three pump–purge cycles. Subsequently, the flask was quickly heated and focused directly onto the sample on an three-dimensional (XYZ)
from 100 °C to 320 °C (the approximate ramp rate was 25 °C min−1). The nanoscanning piezo stage (Physik Instrumente, P-545.xR8S Plano).
temperature was held at 320 °C for 40–60 min, after which the flask was For measurements on film samples, an NA = 0.95 100× air objective
rapidly cooled to room temperature using a stream of compressed air. lens (Nikon) was used. Emitted light was collected back through the
To isolate the nanoparticles, ethanol was added to the solution in same objective, filtered by 850-nm short-pass (Thorlabs, FESH 850)
a 1:1 volume ratio, and the precipitated nanoparticles were isolated and 750-nm long-pass (Thorlabs, FELH 750) filters, and sent to a spec-
by centrifugation (5 min at 4,000 rpm). The pellet was suspended in trometer equipped with an electron-multiplying charge-coupled device
hexanes and centrifuged to remove large and aggregated particles. The (Princeton Instruments, ProEM: 16002 eXcelon3) or a single-photon
nanoparticles remaining in the supernatant were washed two additional avalanche diode (Micro Photon Device, PDM series). For power depend-
times by adding ethanol, isolating by centrifugation and dissolving the ence measurements, a neutral density wheel with a continuously vari-
pellet in hexanes. The nanoparticles were stored in hexanes with two able density was used, synchronized with the collection system and
drops of oleic acid to prevent aggregation. automatically rotated by an Arduino-controlled rotator. Powers were
simultaneously recorded by a Thorlabs power meter by using a glass
Shell growth coverslip to reflect ~10% of the incoming flux. Average excitation power
A 0.1 M stock solution of 20% GdCl3 and 80% YCl3 was prepared by add- densities were calculated using measured laser powers and the 1/e2 area
ing YCl3 (2 mmol, 390.5 mg), GdCl3 (0.5 mmol, 131.8 mg), 10 ml OA and calculated from the imaged laser spot.
15 ml ODE to a 50-ml three-neck flask. The solution was stirred and
heated to 110 °C under vacuum for 30 min. After that, the flask was filled Time-resolved photoluminescence
with N2 and heated to 200 °C for about 1 h, until the solution became Samples were excited with a diode laser (Thorlabs) modulated at fre-
clear and no solid was observed in the flask. Subsequently, the flask quencies from 0.5 Hz to 5 Hz by a function generator (Stanford Research
was cooled to 100 °C and placed under vacuum for 30 min. A 0.2 M Systems DS345). Emitted light collected by the NA = 0.95 100× objec-
solution of Na-TFA was prepared by stirring Na-TFA (4 mmol, 544 mg), tive (Nikon) was detected by a single-photon avalanche diode (Micro
10 ml OA and 10 ml ODE in a flask under vacuum at room temperature Photon Device, PDM series). A time-correlated single-photon counting
for 2 h, ensuring that all chemicals were dissolved. Using a nanoparticle device (Picoquant, Hydraharp 400) was used to record the timing data.
synthesis robot, the Workstation for Automated Nanocrystal Discovery
and Analysis (WANDA), 3–9 nm NaY0.8Gd0.2F4 shells (see Supplementary PA mechanism in our ANPs
Table 1) were grown on ANP cores using a layer-by-layer protocol similar As discussed in the main text, a single GSA event in lanthanide-based PA
to that deployed in Levy et al.22. Briefly, for a shell thickness of 3 nm, initiates a chain reaction of ESA and cross-relaxation events between
6 ml ODE and 4 ml OA were added to the dried ANP cores and heated Ln3+ ions, resulting in the emission of many upconverted photons.
to 280 °C at 20 °C min−1 in the WANDA glove box. The automated pro- This mechanism amplifies the population of excited states, such as the
tocol alternated between injections of a 0.2 M Na-TFA stock solution 800-nm-emitting Tm3+ 3H4 level (Fig. 1c), through a positive-feedback
and a 0.1 M stock solution of 20% gadolinium and 80% yttrium oleate loop of ESA from an intermediate state (3F4), followed by cross-relaxation
solution. One injection was performed every 20 min for a total of 12 (an energy-transfer process) back down to the same intermediate state
injections (6 injections for each precursor). Following the last injection, while promoting a second ground-state Tm3+ ion up to its intermediate
each reaction was annealed at 280 °C for an additional 30 min and then state (we note that the cross-relaxation process is accompanied by the
cooled rapidly by nitrogen flow. The particles were isolated and puri- emission of phonons to compensate an energy mismatch of about
fied according to the purification protocol described for ANP cores. 1,200 cm−1). This process can effectively double the 3F4 population on
Core–shell NaYF4 nanoparticles doped with Tm3+ (1–100%) were every iteration of the loop, and the repeated looping results in nonlinear
synthesized using analogous methods. amplification of excited-state populations.
The ESA is effective because the absorption peak for the electronic
Nanoparticle characterization 3
F2–3F4 transition is close to the 1,064-nm excitation wavelength. How-
Transmission electron microscopy (TEM) was performed using a JEOL ever, the 1,064-nm photons have an energy mismatch of ~1,200 cm−1
JEM-2100F field-emission TEM system at an acceleration voltage of for the electronic 3H6–3H5 transition, which decreases the GSAcross-section at that wavelength. Owing to the energetic mismatch,
GSA is a phonon-assisted process in this case, which makes its oscilla- Code availability
tor strength very small, ~104 times weaker than for excitation resonant The code for modelling the PA behaviour using the differential rate
with the purely electronic f–f transitions. equations described in the Supplementary Information are freely avail-
able at https://github.com/nawhgnahc/Photon_Avalanche_DRE_cal-
Materials considerations for achieving PA in nanoparticles culation.git.
PA was first observed at low temperatures—as is often the case—although
several room-temperature demonstrations have been reported in bulk 51. Auzel, F., Chen, Y. & Meichenin, D. Room temperature photon avalanche up-conversion in
Er-doped ZBLAN glass. J. Lumin. 60-61, 692–694 (1994).
systems (for example, refs. 5–7,18,51–55). In nanomaterials, however, the sen- 52. Auzel, F. & Chen, Y. Photon avalanche luminescence of Er3+ ions in LiYF4 crystal. J. Lumin.
sitivity of Ln3+ photophysics to local material properties has precluded 65, 45–56 (1995).
the realization of PA and has hindered room-temperature operation. 53. Gomes, A. S. L., Maciel, G. S., de Araújo, R. E., Acioli, L. H. & de Araújo, C. B. Diode pumped
avalanche upconversion in Pr3+-doped fibers. Opt. Commun. 103, 361–364 (1993).
As noted in the main text, four key features were combined to design 54. Martín, I. R. et al. Room temperature photon avalanche upconversion in Tm3+-doped
nanocrystals that may be capable of PA. The first is the recent design fluoroindate glasses. J. Phys. Condens. Matter 12, 1507–1516 (2000).
55. Li, Y. et al. BiOCl:Er3+ nanosheets with tunable thickness for photon avalanche phosphors.
paradigm for Ln3+-based upconverting nanoparticles, in which high Ln3+
ACS Appl. Nano Mater. 2, 7652–7660 (2019).
content, engineered energy confinement and reduced surface losses 56. Garfield, D. J. et al. Enrichment of molecular antenna triplets amplifies upconverting
result in exceptional efficiencies and brightness23,29,33–37,56. A second nanoparticle emission. Nat. Photon. 12, 402–407 (2018).
57. Liu, Y. et al. Controlled assembly of upconverting nanoparticles for low-threshold
feature is the choice of Tm3+ (Fig. 1a), an ion with a particularly slow
microlasers and their imaging in scattering media. ACS Nano 14, 1508–1519 (2020).
intermediate-state decay rate W2, which strongly influences PA behav- 58. Fernandez-Bravo, A. et al. Ultralow-threshold, continuous-wave upconverting lasing from
iour5–7 (see below). The third critical aspect exploits the compositional subwavelength plasmons. Nat. Mater. 18, 1172–1176 (2019).
59. Kilbane, J. D. et al. Far-field optical nanothermometry using individual sub-50 nm
strategy employed previously for energy-looping nanoparticles22, in
upconverting nanoparticles. Nanoscale 8, 11611–11616 (2016).
which typical Yb3+ sensitizers are omitted and high concentrations of 60. Zhai, Y. et al. Near infrared neuromorphic computing via upconversion-mediated
Tm3+ ions are doped into a β-phase NaYF4 matrix, enhancing Tm3+–Tm3+ optogenetics. Nano Energy 67, 104262 (2020).
61. Bradac, C. et al. Room-temperature spontaneous superradiance from single diamond
cross-relaxation and ESA while reducing GSA (Fig. 1). The fourth key
nanocrystals. Nat. Commun. 8, 1205 (2017).
element, also shared with energy-looping nanoparticles, is the selection 62. Asenjo-Garcia, A., Kimble, H. J. & Chang, D. E. Optical waveguiding by atomic
of excitation wavelengths in the NIR-II transparency window (either entanglement in multilevel atom arrays. Proc. Natl Acad. Sci. USA 116, 25503 (2019)
1,064 nm or 1,450 nm; Fig. 1), which are optimized for resonant ESA
while maintaining non-resonant GSA, in contrast to the usual wave- Acknowledgements P.J.S., Y.D.S., S.H.N. and C.L. gratefully acknowledge support from the
lengths used for pumping Tm3+ (800 nm, or 980 nm when combined Global Research Laboratory (GRL) Program through the National Research Foundation of
Korea (NRF) funded by the Ministry of Science and ICT (number 2016911815), and KRICT
with Yb3+ sensitization; Fig. 1)6,11,12,21,38.
(KK2061-23, SKO1930-20). Y.D.S. acknowledges the Industrial Strategic Technology
To determine whether these design criteria enable nanocrystals to Development Program (number 10077582) funded by the Ministry of Trade, Industry, and
host PA, we synthesized Tm3+-doped β-NaYF4 core–shell structures Energy (MOTIE), Korea. E.Z.X. gratefully acknowledges support from the NSF Graduate
Research Fellowship Program. Y.L. was supported by a China Scholarship Council fellowship.
16–33 nm in total diameter29,33. As described in Methods sections
A.T. was supported by the Weizmann Institute of Science − National Postdoctoral Award
‘Synthesis of core ANPs’ and ‘Shell growth’, the Tm3+-doped core in Program for Advancing Women in Science. Work at the Molecular Foundry was supported by
each ANP is surrounded by an optically inert shell to minimize surface the Office of Science, Office of Basic Energy Sciences, of the US Department of Energy under
contract number DE-AC02-05CH11231. K.Y. acknowledges support from Programmable
losses33 (Figs. 1, Supplementary Figs. 1, 2 and Supplementary Tables 1,
Quantum Materials, an Energy Frontier Research Center funded by the US Department of
2). These nanoparticles may be excited in the NIR-II region to emit in Energy (DOE), Office of Science, Basic Energy Sciences (BES), under award DE-SC0019443.
the NIR-I region at 800 nm (ref. 22). Both spectral windows are valu- A.B. acknowledges financial support from NCN, Poland, grant number UMO-2018/31/B/
ST5/01827.
able for imaging with limited photodamage through living systems
or scattering media57. More generally, the near-infrared operation Author contributions P.J.S., E.M.C., B.E.C., C.L. and Y.D.S. conceived the study. Experimental
and exceptional photostability, along with the unique combination measurements and associated analyses were conducted by C.L., E.Z.X., Y.L., A.T., K.Y., A.F.-B.,
S.H.N. and E.M.C. Advanced nanoparticle synthesis and characterization was performed by
of steep nonlinearity and efficiency offered by PA suggest the utility
Y.L., A.T. and E.M.C. Theoretical modelling and simulations of PA photophysics were carried out
of ANPs in a diverse array of applications, including sub-wavelength by C.L., E.M.C., A.T., A.M.K. and A.B. Advanced simulations of super-resolution imaging were
bioimaging7,11,12, photonics and light detection56–58, temperature13,14,59 performed by A.M.K. and A.B. All authors contributed to the preparation of the manuscript.
and pressure15 transduction, neuromorphic computing60 and quantum
Competing interests The authors declare no competing interests.
optics61,62.
Additional information
Supplementary information is available for this paper at https://doi.org/10.1038/s41586-020-
03092-9.
Data availability Correspondence and requests for materials should be addressed to Y.D.S., A.B., B.E.C., E.M.C.
All data generated or analysed during this study, which support the or P.J.S.
plots within this paper and other findings of this study, are included Peer review information Nature thanks Xueyuan Chen, Andries Meijerink and the other,
anonymous, reviewer(s) for their contribution to the peer review of this work. Peer reviewer
in this published article and its Supplementary Information. Source reports are available.
data are provided with this paper. Reprints and permissions information is available at http://www.nature.com/reprints.You can also read