Analyzing reflectance spectra of human skin in legal medicine
←
→
Page content transcription
If your browser does not render page correctly, please read the page content below
Analyzing reflectance spectra of human
                skin in legal medicine

                Liudmila Belenki
                Vera Sterzik
                Katharina Schulz
                Michael Bohnert

Downloaded From: https://www.spiedigitallibrary.org/journals/Journal-of-Biomedical-Optics on 21 May 2021
Terms of Use: https://www.spiedigitallibrary.org/terms-of-use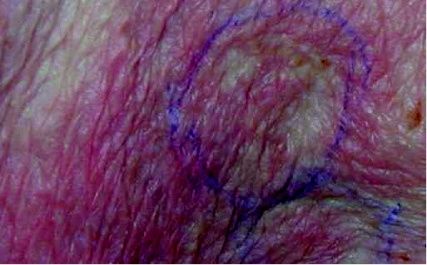
Journal of Biomedical Optics 18(1), 017004 (January 2013)
                                                                                                                                          TECHNICAL NOTE

                Analyzing reflectance spectra of human skin in legal
                medicine
                Liudmila Belenki,a Vera Sterzik,b Katharina Schulz,c and Michael Bohnertb
                a
                  University of Freiburg, Materials Research Center Freiburg, Stefan-Meier-Straße 21, 79104 Freiburg, Germany
                b
                  University of Würzburg, Institute of Legal Medicine, Versbacher Street 3, 97078 Würzburg, Germany
                c
                  University of Freiburg, Institute of Legal Medicine, Albertstraße 9, 79104 Freiburg, Germany

                               Abstract. Our current research in the framework of an interdisciplinary project focuses on modelling the dynamics
                               of the hemoglobin reoxygenation process in post-mortem human skin by reflectance spectrometry. The observa-
                               tions of reoxygenation of hemoglobin in livores after postmortem exposure to a cold environment relate the
                               reoxygenation to the commonly known phenomenon that the color impression of livores changes from livid to
                               pink under low ambient temperatures. We analyze the spectra with respect to a physical model describing the
                               optical properties of human skin, discuss the dynamics of the reoxygenation, and propose a phenomenological
                               model for reoxygenation. For additional characterization of the reflectance spectra, the curvature of the local mini-
                               mum and maximum in the investigated spectral range is considered. There is a strong correlation between the
                               curvature of specra at a wavelength of 560 nm and the concentration of O2 -Hb. The analysis is carried out
                               via C programs, as well as MySQL database queries in Java EE, JDBC, Matlab, and Python. © 2013 Society of Photo-
                               Optical Instrumentation Engineers (SPIE). [DOI: 10.1117/1.JBO.18.1.017004]

                               Keywords: reflectance spectrometry; optical properties; physical model of human skin; reoxygenation of hemoglobin in livores; data
                               analysis.
                               Paper 12518TN received Aug. 14, 2012; revised manuscript received Nov. 6, 2012; accepted for publication Nov. 26, 2012; published
                               online Jan. 7, 2013.

                1    Introduction                                                                     range between 500 and 600 nm.1,5,6,8,9 In order to explain
                For modern medicine and biomedical sciences, it is important to                       this observation, most textbooks draw on the theory that oxygen
                have fast, noninvasive techniques for differential diagnosis or                       diffuses from ambient air into the skin vessels and binds to
                fundamental research at hand. One successfully applied method                         hemoglobin molecules.13,17–19 This theory has been substanti-
                is reflectance spectrometry. It is the most important method for                      ated by experimental results of Bohnert et al.8 and Watchman
                analyzing skin in vivo1–4 and for the age determination of a trau-                    et al.,9 which have been obtained by measuring the reflectance
                matic injuries.5,6 In dermatology, this approach is used for the                      of livor mortis and analyzing the resulting spectra with respect to
                differential diagnosis of malignant melanoma,7 while in legal                         an optical model of human skin.1,9,20 Here we report the appli-
                and forensic medicine, it helps to estimate the cooling process                       cation of this approach to investigations on the dynamics of
                and to confirm that the discoloration of livor mortis due to cool-                    reoxygenation. More precisely, we propose a phenomenological
                ing is caused by reoxygenation of hemoglobin.1,8,9 The color                          model of the reoxygenation process.
                qualities of pink livores seen after exposure to a cold environ-
                                                                                                      2     Materials and Methods
                ment and in carbon monoxide (CO) poisoning are very similar.
                Nevertheless, by means of spectrometric measurements and stat-                        2.1    Study Population
                istical data analysis based on a physical skin model, it is possible
                to distinguish between two possibilities.                                             By means of reflectance spectrometry, postmortem lividity was
                    Postmortem lividity is the earliest apparent sign of death.                       investigated over a period of four years in 82 Caucasians
                Therefore, the first step in clarifying the change of color is to                     brought to the Institute of Legal Medicine of the Freiburg
                investigate the different states of cooled and uncooled livores                       University shortly after death. Immediately after arrival, the
                by reflectance spectrometry.10,11 Here, the discolored skin is irra-                  corpses were taken to a cold storage room of 4°C to 6°C. The
                diated with a white light source of a known intensity spectrum                        study included 52 males ages 25 to 93 (mean ¼ 54.5, median ¼
                that is comparable to bright daylight. The intensity of the                           49.5, std ¼ 16.9) and 30 females ages 23 to 95 (mean ¼ 68.2,
                reflected light is determined for each wavelength in the visible                      median ¼ 72, std ¼ 20.2).
                range. The livid color of livor mortis results from a nearly com-
                plete consumption of hemoglobin-bound oxygen (O2 -Hb) dur-                            2.2    Reflectance Spectrometry
                ing agony. It is a well-known phenomenon that the appearance
                of livor mortis changes to a bright red or pink color under low                       If one looks at an unknown material, one important property
                ambient temperatures.12–16 This corresponds to a qualitative                          being recognized is the color. This intuitive material characteri-
                change of the reflectance curve that occurs in the wavelength                         zation can be specified by reflectance spectrometry. Spectral
                                                                                                      reflectance reveals a lot of subtle information about the
                                                                                                      microstructure of the material, like the concentration of
                Address all correspondence to: Liudmila Belenki, University of Freiburg, Materials
                Research Center Freiburg, Stefan-Meier-Straße 21, 79104 Freiburg, Germany.
                Tel: +49 (151) 28478362; E-mail: liudmila.belenki@gmail.com                           0091-3286/2013/$25.00 © 2013 SPIE

                Journal of Biomedical Optics                                                    017004-1                                        January 2013   •   Vol. 18(1)

Downloaded From: https://www.spiedigitallibrary.org/journals/Journal-of-Biomedical-Optics on 21 May 2021
Terms of Use: https://www.spiedigitallibrary.org/terms-of-use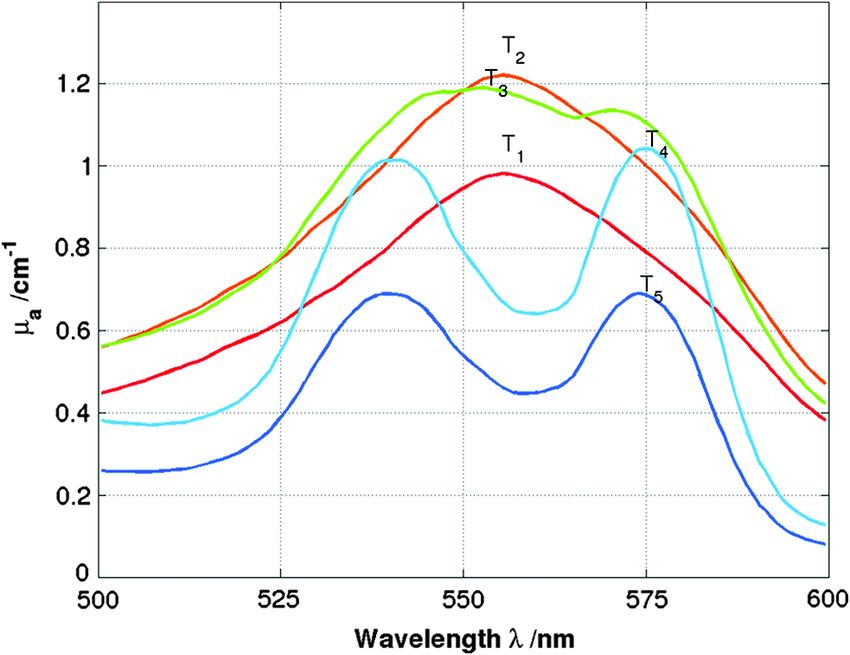
Belenki et al.: Analyzing reflectance spectra of human skin in legal medicine

                light-absorbing substances and the size distribution of light-                     diameter d within the interval (0.1, 0.8) μm and a refractive
                scattering structures.                                                             index of n2 ¼ 1.4. The effective particle size distribution
                    Measurements were performed with the diode array spectro-                      hðdÞ of the scatter (mitochondria) was calculated within the
                photometer MCS 400 (Carl-Zeiss-Jena GmbH, Jena, Germany)                           interval (0.1, 0.8) with a discretisation of Δd ¼ 0.1 μm. In
                and a halogen bulb the as light source (standard illuminant D65).                  the visible range of light, the absorption processes are mainly
                The spectral resolution is 0.8 nm within the wavelength range                      due to hemoglobin. Due to the cold, O2 binds more easily to
                of 188 to 1018 nm. The measuring head allowed recording of                         hemoglobin, and its release to the tissue is impeded.22
                the directed surface reflection of a 5-mm-wide measurement                             The extinction spectra of Hb, O2 -Hb, and CO-Hb were taken
                spot. Compressed barium sulphate was used as white standard                        into account for the modelling of the absorption coefficient. In a
                according to ISO 7724-2. Furthermore, the measurements were                        first approximation, the human skin can be modeled as a turbid,
                controlled and evaluated via the control software ASPECTþ                          absorbing, semi-infinite medium composed of homogeneously
                running on a personal computer. Reflectance was saved in the                       distributed scatterers and absorbers. Given this correlation, the
                range of 350 to 750 nm. The reflectance spectrometry and skin                      microscopic parameters can be estimated from a measured
                temperature measurements were performed on livores located                         reflectance spectrum by inversion using least-square or regulari-
                in the lateral region of the thorax and on pallor (uncolored skin)                 zation methods in a range of 500 to 600 nm,1,20 because this
                located on the breast forewall. Further parameters recorded were                   range contains the typical minima and maxima for deoxygen-
                time of death, cause of death, start of refrigeration, body mass                   ated and oxygenated hemoglobin. The standard deviations
                index, age, and gender. Measurements were performed at inter-                      were calculated under the assumption of Gaussian error propa-
                vals ranging from 6 to 12 h. The reflectance spectra have been                     gation. The reflectance spectra that were measured in the range
                managed via an scientific information repository as described by                   of 350 to 750 nm, as well as their respective meta data, like case
                Belenkaia et al.21 Altogether, 357 measurements were carried                       number, age, gender, etc., were stored in a scientific information
                out, with 241 being used for correlation analysis. These 241                       repository,21 from which the primary data were retrieved for data
                reflectance curves obtained from 82 bodies were analyzed with                      analysis and in which the estimated skin parameters were saved.
                respect to the physical skin model described below.                                The analysis is carried out via C programs,7 as well as via
                                                                                                   MySQL database queries in Java EE, JDBC, Matlab, and
                2.3     Estimation of O2 -Hb Concentrations                                        Python. Statistical analysis was performed with SPSS Statis-
                                                                                                   tics 19.0.0 (IBM Corporation, Somers, New York), with
                In all cases, the color impression of postmortem lividity changed                  P < 0.05 considered as statistically significant.
                from livid to bright red in the course of cooling the corpses.
                Furthermore, for every case, the respective reflectance spectra
                                                                                                   3       Results
                of the livores evolved the described local maximum between
                500 and 600 nm. With this observation in mind, the question                        3.1      One Example of the Discoloration via Cooling
                arises of whether it is possible to determine the concentration                             Down
                of Hb and O2 -Hb by means of the reflectance spectrum. In
                order to obtain this not directly accessible information, one                      An example of livor mortis taken from a 89-year-old Caucasian
                has to relate the mesoscopic material properties to the optical                    female is described here. One and a half hours after death, the
                properties of the skin and furthermore model the dependency                        corpse was brought into a cold environment of approximately
                of the reflectance on the optical skin properties. The latter                      5°C. The first picture of postmortem lividity, shown in Fig. 1(a),
                can be parameterized by the absorption coefficient μa , the scat-                  was taken after 24 h of cooling. At that time, the hypostatic areas
                tering coefficient μs0 , and the anisotropy factor g. While the                    were greyish-blue, and the skin had cooled down to 10.9°C.
                absorption coefficient is determined by the concentration and                      A very different color impression of this discoloration will be
                the extinction spectrum of Hb, O2 -Hb, and CO-Hb,22–24 the scat-                   observed if the corpse continues cooling down. At a skin tem-
                tering coefficient and the anisotropy factor can be modelled in                    perature of 8°C, as shown in Fig. 1(b), the livores exhibit a pink
                terms of the Mie theory25,26 if one assumes the shape of the light-                color. While the livid color of uncooled livor mortis resembles
                scattering obstacles (e.g., mitochondria) to be spherical. Now,                    the mixture of red and blue, the origin of the combination color
                the dependency of the reflectance on the optical material param-                   pink cannot be determined by the naked eye, due to the many
                eters can be determined by a Monte-Carlo model simulating the                      different ways of creating a pink color impression.28 A series of
                light transport in a turbid medium.1 The Monte-Carlo-based cal-                    five reflectance spectra of postmortem lividity measured at dif-
                ibration model was estimated for a semi-infinite half-space with                   ferent skin temperatures in the course of cooling down the
                a refractive index of n1 ¼ 1.36. The reflectance Rðμs0 ; μa Þ was                  corpse is shown in Fig. 1(c). For temperatures higher than
                calculated for a detector radius of r ¼ 0.5 cm. The human skin                     10°C, shown by curves T 1 and T 2 in Fig. 1(c), the broad reflec-
                is a very complex organ with a three-layered structure consisting                  tance plateau in the wavelength region corresponding to orange/
                of the stratum corneum, the stratum germinativium, and the der-                    red colors is obvious. The same holds for the prominent reflec-
                mis. The thin stratum corneum causes regular reflectance at tis-                   tance peak in the blue color regime. These regions of large
                sue-air transition. This regular reflectance is due to the refractive              reflectance are separated by a reflectance minimum masking
                index mismatch between the stratum corneum (nsc ¼ 1.55) and                        the green/yellow part of the spectrum. Obviously, the reflectance
                air (nair ¼ 1.0). In the visible light range, skin reflects between                maxima located at wavelengths corresponding to blue and red
                4% and 7% of the incident beam, nearly independent of wave-                        colors result in the livid color impression of uncooled livores
                length and skin type.22 The stratum germinativum und dermis                        shown in Fig. 1(a). In the course of the skin’s cooling down,
                are composed of many organelles and substructures that influ-                      the reflectance spectra change such that the local maximum
                ence the transport of light. However, the main scattering proc-                    of the blue reflectance region shifts to larger wavelengths resem-
                esses are elastic scattering processes by mitochondria und                         bling a blue/green color, and the reflectance plateau of the large
                collagen fibers that can be described by a scatterer27 with                        wavelength regime evolves a prominent peak at its left border

                Journal of Biomedical Optics                                              017004-2                                           January 2013   •   Vol. 18(1)

Downloaded From: https://www.spiedigitallibrary.org/journals/Journal-of-Biomedical-Optics on 21 May 2021
Terms of Use: https://www.spiedigitallibrary.org/terms-of-use
Belenki et al.: Analyzing reflectance spectra of human skin in legal medicine
(a) (b)
1mm 1mm
(c)
40
Reflectance R [%]
T5
30
T4
T1
T3
20 Fig. 2 Reflectance spectra of pallor (uncolored skin) recorded at skin
T2
temperatures T 1 ¼ 10.9°C, T 2 ¼ 10.3°C, T 3 ¼ 8.6°C, T 4 ¼ 8.0°C, and
T 5 ¼ 7.5°C. For temperatures higher than 8.0°C (curves T 1 , T 2 , and T 3 ),
the platy reflectance extrema for intermediate colors (500 to 600 nm)
are observed. For temperatures lower than 8.0°C (curves T 4 and T 5 ),
400 500 600 700 a local minimum appears at 576 nm. Additionally, a very weak local
Wavelength λ [nm] minimum at 541 nm can be observed.
Fig. 1 Appearance of livores for decreasing skin temperature. Images
of livores observed at a skin temperature of (a) 10.9°C and (b) 8.0°C.
Blue lines mark areas being characterised by reflectance spectroscopy.
(c) Reflectance spectra recorded at skin temperatures T 1 ¼ 10.9°C,
T 2 ¼ 10.3°C, T 3 ¼ 8.6°C, T 4 ¼ 8.0°C, and T 5 ¼ 7.5°C. Superimposed
colored curves indicate the reflectance estimated on the basis of the
physical model. Although the base line of the reflectance spectra differs
from measurement to measurement, the evolving local maximum at
wavelengths resembling a yellow-green color impression is apparent
for decreasing skin temperature.
corresponding to an orange color impression, shown by curves
T 3 , T 4 , and T 5 in Fig. 1(c). A qualitative change of the reflec-
tance spectra can be observed for intermediate colors (500 to
600 nm), where a new local maximum of reflectance rises at
560 nm. This local maximum being flanked by two local min-
ima at 541 and 576 nm is a typical feature of oxygenated hemo-
globin,9,22 suggesting a high concentration of O2 -Hb within the
cooled livor mortis. Superimposed colored curves indicate the
reflectance estimated on the basis of the physical model. Fig. 3 The optical parameter absorption coefficient μa was determined
Now we consider a series of five reflectance spectra of pallor by the concentration and the extinction spectrum of Hb, O2 -Hb, and
(uncolored skin) measured at the same skin temperatures as for CO-Hb at skin temperatures T 1 ¼ 10.9°C, T 2 ¼ 10.3°C, T 3 ¼ 8.6°C,
lividity in the course of cooling down the corpse (Fig. 2). For T 4 ¼ 8.0°C, and T 5 ¼ 7.5°C in dependence on the wavelength.
temperatures higher than 10°C, shown by curves T 1 , T 2 and T 3
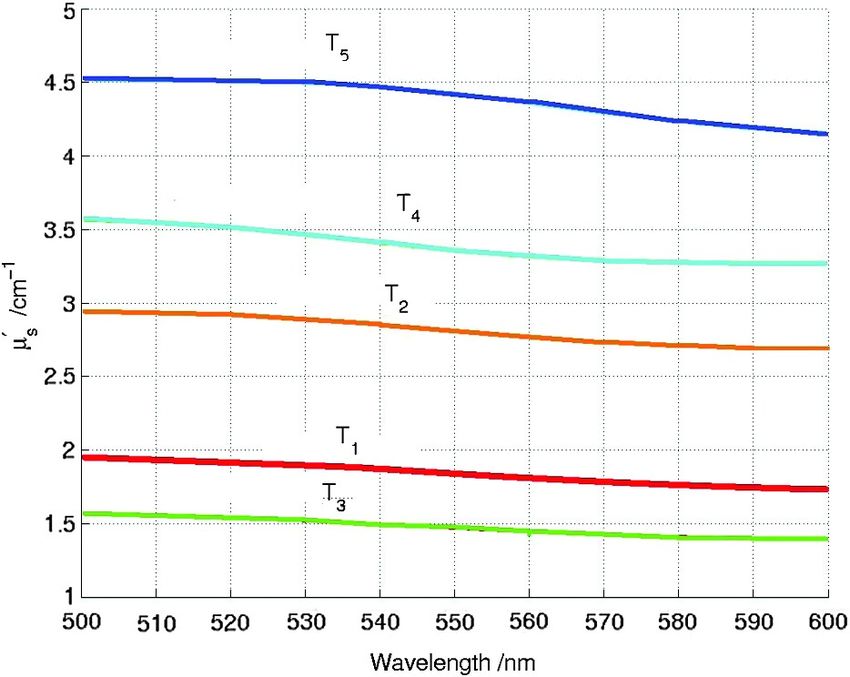
in Fig. 2, flat reflectance minima and maxima in the wavelength to the behavior of the absorption coefficients, the scattering
region of 380 to 750 nm are observed. For low temperatures coefficients are in linear dependency on the wavelength (Fig. 4).
T 4 ¼ 8.0°C and T 5 ¼ 7.5°C, a local minimum of reflectance A similary behavior of μs0 was observed by Garcia-Uribe et al.2
rises at 576 nm, and a very weak local minimum rises at 541 nm,
suggesting a low concentration of oxygenated hemoglobin
3.2 Dynamics of Reoxygenation for an Exemplary
O2 -Hb within the cooled pallor.
A series of absorption coefficients μa and scattering coeffi-
Case
cients μs0 in dependency on the wavelength were estimated7 via Applying the Monte-Carlo model to the exemplary case dis-
the program TMinv at the same skin temperatures as the five cussed in Fig. 1, the time series of O2 -Hb concentrations pre-
reflectance spectra from Fig. 1(c) and are shown in Figs. 3 sented in Fig. 5 is achieved. The dynamics reveal two phases of
and 4. A qualitative change of the absorption coefficient is livore appearance. The first phase starts with the cooling down
observed in the range of 500 to 600 nm. Double peaks arise of the corpse and is characterized by a negligible O2 -Hb con-
around 541 and 576 nm (Fig. 3). This result is the same as centration. The first phase of our exemplary case occurs from
those found by Garcia-Uribe et al. and Watchman et al.2,9 The 24 to 34 h after the beginning of cooling, at which time the skin
latter corresponds to the maximum and minimum of the corre- temperature decreases from 10.9°C to 10.3°C (black squares in
sponding reflectance curve at the same wavelengths. In contrast Fig. 5). For this interval, the O2 -Hb concentration is less than
Journal of Biomedical Optics 017004-3 January 2013 • Vol. 18(1)
Downloaded From: https://www.spiedigitallibrary.org/journals/Journal-of-Biomedical-Optics on 21 May 2021
Terms of Use: https://www.spiedigitallibrary.org/terms-of-use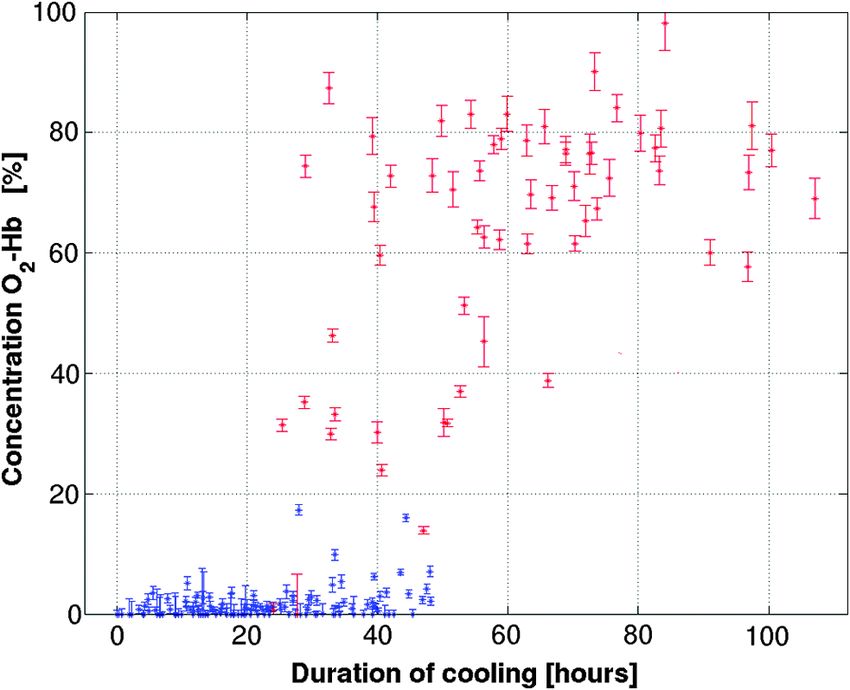
Belenki et al.: Analyzing reflectance spectra of human skin in legal medicine
2.5%. The second phase starts with the measurement taken 42 h
after the beginning of cooling, at which time the concentration
of O2 -Hb has increased to approximately 20%, while the skin
temperature has decreased to 8.6°C. In the further course of
time, the concentration of O2 -Hb within the livores reaches a
level of approximately 70%. From this final state of saturation,
the image of bright red livores shown in Fig 1(b) was taken.
We found that transitions from low to high O2 -Hb concen-
trations in the course of the cooling down of the corpse are
generic and can be described by
Δc 2cs
cO2 Hb ðtÞ ¼ 1 þ tanh ðt − t0 Þ þ cmin ; (1)
2 Δc
where t denotes the cooling duration in hours, cmin is the min-
imal O2 -Hb concentration percentage, Δc is the increase of the
O2 -Hb concentration percentage, t0 is the inflection point of the
Fig. 4 The reduced scattering coefficient μs0 was calculated in depend- model function at which the concentration has reached half-
ency on the wavelength at the same skin temperatures as the parameter height, and cs ¼ dtd cO2 Hb ðtÞjt¼t0 is the slope of the model func-
μa (see Fig. 3).
tion at the inflection point. As can be seen in Fig. 5, the body
was exposed to fluctuating ambient temperatures. Table 1 con-
tains data for t0, cmin , Δc, cs , χ 2 , and age for five other examples
80
in which there were no disturbances in ambient temperature. For
the shown case, the parameters of Eq. (1) can be estimated with
neglection of these temperature fluctuations to t0 ¼ ð43.080
0.002Þh, cmin ¼ ð1.74 0.05Þ%, Δc ¼ ð69.42 0.14Þ%, and
Concentration O2−Hb [%]
60
cs ¼ ð18.90 0.012Þ%∕h. The cost function of this estimation
sums up to χ 2 ¼ 6.2, which indicates that the estimated model
(black curve in Fig. 5) fits the data well.
40
3.3 Temperature and Cooling Duration Dependency
of Reoxygenation of Livores Within a Field Study
20
We analyzed 241 reflectance curves with respect to the de-
scribed physical skin model, and the resulting estimated O2 -Hb
0 concentrations were plotted against the respective skin tem-
30 40 50 60 70
Observation time [hours] peratures (Fig. 6) and the cooling duration (Fig. 7). In these dia-
grams, blue and magenta colored symbols indicate reflectance
Fig. 5 Time series of O2 -Hb concentration for the discussed case doc- curves with one (blue) or three local extrema (magenta) between
umenting the changing color of livores due to cooling. The concentra- 500 and 600 nm being associated with bluish and red livores,
tions are estimated from reflectance spectra of livores (Fig. 1) measured respectively.
in the course of cooling down the corpse. The respective skin temper-
ature is indicated by symbols. Asterix: 7°C to 9°C, black boxes: 10°C to
11°C, black triangle: 11.9°C. Shaded regions mark intervals of warming 3.4 Curvature Dependency of Reoxygenation of
at room temperature. Estimation errors are calculated from error propa- Livores Within a Field Study
gation. In case of low O2 -Hb-concentrations, the error bars lie within
the symbol bounds. The symbol on the far left and the second symbol For additional characterization of the reflectance spectra, the
on the right correspond to Fig. 1(a) and 1(b), respectively. curvature of the local minima and maxima in the investigated
Table 1 Estimated models.
Case Δc∕% t 0 ∕h cs ∕%∕h cmin ∕% χ2 Age
06254 69.4 0.14 43.08 0.00 18.9 0.01 1.74 0.05 6.2 89
05480 73.8 0.06 34.1 0.01 4.5 0.00 0.01 0.02 6.8 23
05534 76.1 0.19 74.7 0.01 6.6 0.00 2.4 0.08 1.9 85
05536 77.8 0.12 40.6 0.00 12.1 0.02 0.008 0.12 8.9 91
06058 74.5 0.10 139.1 0.06 1.9 0.00005 3.8 0.03 5.5 41
Journal of Biomedical Optics 017004-4 January 2013 • Vol. 18(1)
Downloaded From: https://www.spiedigitallibrary.org/journals/Journal-of-Biomedical-Optics on 21 May 2021
Terms of Use: https://www.spiedigitallibrary.org/terms-of-useBelenki et al.: Analyzing reflectance spectra of human skin in legal medicine
Fig. 6 Field study investigating the correlation between the temperature
of livores and the concentration of O2 -Hb. The scatter plot shows 241 Fig. 8 Field study investigating the correlation between the curvature of
O2 -Hb concentrations estimated from reflectance curves obtained reflectance spectra and O2 -Hb concentration. Box plots of the curvature
from 82 bodies. Livid and pink symbols refer to reflectance curves with in relation to the O2 -Hb concentration for 241 relectance spectra are
one and three local extrema, respectively, in the wavelength interval shown. The low O2 -Hb concentration corresponds to the positive val-
between 500 and 600 nm. ues of the curvature with six outliers (points beyond the whiskers, which
are displayed using þ). Comparing the groups among each other with a
Post-Hoc-Tamhane-test shows a significant difference (p < 0.0001): The
first group of O2 -Hb concentration {N ¼ 133, median ¼ 3.8 nm−1 ,
IQR ¼ f3.1; 5.0g nm−1 , mean ¼ 4.1 nm−1 , std ¼ 1.96 nm−1 } and the
second group of O2 -Hb concentration {N ¼ 30, median ¼ −5.6 nm−1 ,
IQR ¼ f−7.4; −3.5g nm−1 , mean ¼ −5.7 nm−1 , std ¼ 2.6 nm−1 } have
a difference of the means ¼ 9.7, std ¼ 0.46. The first group and the third
group of O2 -Hb concentration {N ¼ 78, median ¼ −9.7 nm−1 , IQR ¼
f−11.9; −8.2g nm−1 , mean ¼ −10.1 nm−1 , std ¼ 2.6 nm−1 } have a
difference of the means ¼ 14.2, std ¼ 0.32. The second group and the
third group have a difference of the means ¼ 4.4, std ¼ 0.49. Here, N
is the number of reflectance curves in the corresponding group, IQR is
the interquartile range, and std denotes the standard deviation.
and −10.11 2.63 nm−1 , respectively. The curvatures in the
three O2 -Hb concentration groups differed significantly
(P < 0.0001) in the Oneway ANOVA Welch-Test.
Furthermore, performing group-to-group comparisons via a
Post-Hoc-Tamhane-Test showed significant between-group
differences (P < 0.0001). Hence, there is a strong correlation
between the curvature of specra at 560 nm and the O2 -Hb
Fig. 7 Field study investigating the correlation between the duration of concentration.
cooling of livores and the concentration of O2 -Hb. The scatter plot
shows 241 O2 -Hb concentrations estimated from reflectance curves 4 Conclusion
obtained from 82 bodies. Livid and pink symbols refer to reflectance
curves with one and three local extrema, respectively, in the wave- The presented investigations are based on the fact that the dis-
length interval between 500 and 600 nm. coloration of livores from livid to pink due to exposure to a cold
environment is related to a characteristic change of the reflec-
tance spectrum in the wavelength interval from 500 to 600 nm.
spectral range was considered. The related qualitative change More precisely, the reflectance curve of livid livores exhibits a
of the reflectance curve can be characterized by computing the local minimum at 555 nm at room temperature, which evolves in
curvature at the position of the central local extremum at a the course of cooling to a local maximum at 560 nm being char-
wavelength of 560 nm, such that a vanishing curvature indicates acteristic for the pink type of livores. These observations relate
the transition from one (bluish livores) to three local extrema closely to the report of Bohnert et al.,8 who had approximated a
(red livores). We consider the evolution of the curvature in critical temperature T c ¼ ð10.3 2.7Þ°C, which is the temper-
dependency of the O2 -Hb concentration and carry out an analy- ature at which the qualitative change of the reflectance curve
sis via MatLab (function boxplot). The O2 -Hb concentration is happens.
arranged into three groups: ð0; 20Þ∕% (the first group), The observed spread for the relation between skin tempera-
ð20; 60Þ∕% (the second group), and ð60; 100Þ∕% (the third ture and O2 -Hb concentration is closely related to the fact that
group). Figure 8 shows a box plot of the curvature in relation the system under investigation is not in equilibrium, but conti-
to the O2 -Hb concentration for 241 reflectance spectra. The nously transforms from its high-temperature state to its low-
mean values for the three groups are 4.07 1.97, −5.67 2.58, temperature state. This transformation is determined by the
Journal of Biomedical Optics 017004-5 January 2013 • Vol. 18(1)
Downloaded From: https://www.spiedigitallibrary.org/journals/Journal-of-Biomedical-Optics on 21 May 2021
Terms of Use: https://www.spiedigitallibrary.org/terms-of-useBelenki et al.: Analyzing reflectance spectra of human skin in legal medicine
dynamics of thermal and molecular diffusion. While thermal 6. V. K. Hughes and N. E. I. Langlois, “Use of reflectance spectrophotom-
diffusion is driven by the temperature gradient between the etry and colorimetry in a general linear model for the determination of
the age of bruises,” For. Sci. Med. Pathol. 6(4), 275–281 (2010).
warm core of the corpse and the cool environment, the molecu- 7. R. Walther, “Reflexionsspektroskopie zur Charakterisierung optisch
lar diffusion is driven by the gradient between oxygen-rich trüber Medien: Modellierung, Simulation und statistische,” Datenanal-
atmosphere and oxygen-poor livores. The overall dynamic of yse Universität Freiburg, http://www.freidok.uni-freiburg.de/volltexte/
this relaxation process is describable by a phenomenological 1309 (2004).
model that takes into account the fact that the initial and 8. M. Bohnert et al., “Re-oxygenation of hemoglobin in livores after post-
final states of the system transform into each other in a relatively mortem exposure to a cold environment,” Int. J. Legal Med. 122(2),
91–96 (2008).
short timeframe of several hours. While the structure of the 9. H. Watchman et al., “Re-oxygenation of post-mortem lividity by passive
model is generic, the parameters have to be adapted for each diffusion through the skin at low temperature,” Forensic Sci. Med.
time series, because the complexity of human skin causes a cer- Pathol. 7(4), 333–335 (2011).
tain variety of individual properties, e.g., thickness of dermal 10. G. Kortüm, Reflexionsspektroskopie: Grundlagen, Methodik, Anwen-
layers, which certainly affect thermal conductivity and oxygen dungen, Springer, Berlin (1969).
11. B. Hapke, Theory of Reflectance and Emittance Spectroscopy, p. 472,
permeability of skin. Therefore, ongoing research seeks to
Cambridge University Press, Cambridge (2005).
further improve the physical skin model and investigate the 12. F. J. Holzer, “Über Eigentümlichkeiten beim Rotwerden der Toten-
reoxygenation process with better temporal resolution. We con- flecken,” Z.Medizinalbeamt 2, 65–72 (1934).
clude that the presented results emphasize the importance of the 13. H. Kessler, “Zur Differentialdiagnose der Einwirkung von Kälte
applied methodology combining reflectance measurements with oder Kohlenoxyd auf die Färbung der Hypostase,” MD Thesis,
an optical model of human skin. Heidelberg University Press (1951).
14. W. U. Spitz, Medicolegal Investigation of Death, 3rd ed., Thomas,
Springfield(1993).
15. V. J. M. DiMaio and D. J. DiMaio, Forensic Pathology, 2nd ed., CRC,
Acknowledgments Boca Raton (2001).
This study has been supported by Deutsche Forschungsgemein- 16. P. J. Saukko and B. Knight, Knight’s Forensic Pathology, 3rd ed.,
schaft (German Research Council), File No. Bo 1923/2-1. Arnold, London (2004).
17. B. Mueller, Gerichtliche Medizin, 2nd ed., Springer, Heidelberg (1975).
Futhermore, the authors would like to thank A. Liehr for dis- 18. B. Forster, Praxis der Rechtsmedizin, Thieme, Stuttgart, New York
cussion of this work and J. Honerkamp and S. Pollak for dis- (1987).
cussions at the earlier stage of this paper. We also would like to 19. B. Brinkmann and B. Madea, Eds., Handbuch Gerichtliche Medizin,
thank the anonymous reviewers for very useful remarks and Springer, Berlin (2003).
fruitful advice. 20. R. Walther et al., “Monte Carlo based model for steady-state diffuse
reflectance spectroscopy,” Proc. SPIE 5261, 88–99 (2004).
21. L. Belenkaia, M. Bohnert, and A. W. Liehr, Electronic Laboratory
Notebook Assisting Reflectance Spectrometry in Legal Medicine,
References
arXiv:cs.DB/0612123 [cs. DB], Cornell University Library, http://
1. M. Bohnert et al., “A Monte Carlo-based model for steady-state diffuse www.arxiv.org/abs/cs.DB/0612123 (2006).
reflectance spectrometry in human skin: estimation of carbon monoxide 22. R. R. Anderson and J. A. Parrish, “The optics of human skin,” J. Invest.
concentration in livor mortis,” Int. J. Legal Med. 119(6), 355–362 Dermatol. 77(1), 13–19 (1981).
(2005). 23. S. Prahl, “Optical Absorption of Hemoglobin,” Oregon Medical
2. A. Garcia-Uribe et al., “In-vivo characterization of optical properties of Laser Center, http://omlc.ogi.edu/spectra/hemoglobin/index.html
pigmented skin lesions including melanoma using oblique incidence (15 December 1999).
diffuse reflectance spectrometry,” Biomed. Opt. 16(2), 020501 (2011). 24. W. Schwerd, Der rote Blutfarbstoff und seine wichtigsten Derivate,
3. N. R. T. H. Nguyen and J. W. Tunnell, “Lookup table-based inverse Schmidt-Römhild, Lübeck (1962).
model for determining optical properties of turbid media,” Biomed. 25. G. Mie, “Beiträge zur Optik trüber Medien, speziell kolloidaler
Opt. 13(5), 050501 (2008). Metalllösungen,” Ann. Phys. 330(3), 377–445 (1908).
4. J. A. Delgado Atencio et al., “Influence of probe pressure on human skin 26. H. C. van de Hulst, Light Scattering by small Particles, John Wiley &
diffuse reflectance spectroscopy measurements,” Opt. Mem. Neural Sons, New York (1957).
Netw. 18(1), 6–14 (2009). 27. F. P. Bolin et al., “Refractive index of some mammalian tissues using a
5. L. L. Randeberg et al., “A novel approach to age determination of trau- fibre optic cladding method,” Appl. Opt. 28(12), 2297–2303 (1989).
matic injuries by reflectance spectroscopy,” Lasers Surg. Med. 38(4), 28. K. Nassau, The Physics and Chemistry of Colour, 2nd ed., Wiley Series
277–289 (2006). in Pure and Applied Optics, John Wiley & Sons, New York (2001).
Journal of Biomedical Optics 017004-6 January 2013 • Vol. 18(1)
Downloaded From: https://www.spiedigitallibrary.org/journals/Journal-of-Biomedical-Optics on 21 May 2021
Terms of Use: https://www.spiedigitallibrary.org/terms-of-useYou can also read