Seasonal and Interannual Variations of Sardine Catches along the Omani Coast
←
→
Page content transcription
If your browser does not render page correctly, please read the page content below
International Journal of Oceans and Oceanography
ISSN 0973-2667 Volume 14, Number 1 (2020), pp. 77-99
© Research India Publications
https://dx.doi.org/10.37622/IJOO/14.1.2020.77-99

     Seasonal and Interannual Variations of Sardine
            Catches along the Omani Coast

                  Saud M. Al Jufaili and Sergey A. Piontkovski*
       Sultan Qaboos University, P.O.Box 34, Muscat 123, Sultanate of Oman
                               *Corresponding author.

                                      Abstract
   Sardines contributed 85 % to the total small pelagic fish landings by Oman,
   i n 2 0 0 0 - 2 0 1 8 . Monthly data on sardine catches represented mainly by the
   Indian oil sardine (Sardinella longiceps Valenciennes, 1847) and 19
   environmental variables were subjected to the Principal Component Analysis
   which enabled us to elucidate factors driving seasonal and interannual
   fluctuations of sardine catches over three main fishery provinces. An increase
   of the catch and an increase in magnitude of seasonal fluctuations of these
   catches have been the main trends of the past two decades pronounced in a 30-
   year time series (1988-2018). The wind speed, sea surface temperature,
   geostrophic current velocity, number of cyclonic eddies, the El-Niño Southern
   Oscillation, Indian Ocean Dipole, and large pelagic species (predators on
   sardines) were the environmental variables which modulated interannual
   variations of sardine catches along the Omani shelf overlooking the western
   Arabian Sea.

INTRODUCTION
Landings of small pelagic fishes (sardines, anchovies and herring) contribute about
19% (~15 million tons) to the world fishery production (FAO, 2016). The commercial
importance of this group is high especially in the northern Indian Ocean, in which the
Indian oil sardine (Sardinella longiceps Valenciennes, 1847) leads industrial and
artisanal catches. Indian fisheries contributed about 80% to the global oil sardine
catch, in 1950-2014 (Kripa et al., 2018). However, sardine catches are highly variable,
on seasonal, interannual and decadal scales (Lluch-Belda et al., 1989, Schwartzlose, et
al., 1999), resulting in economic losses.
Overfishing coupled with environmental variations (in the form of intensity of a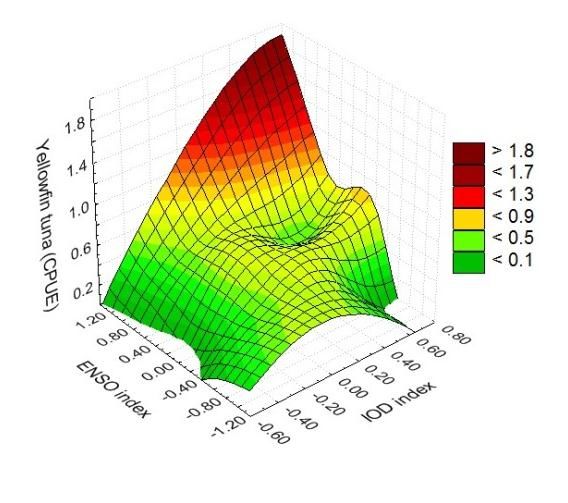
78                                            Saud M. Al Jufaili and Sergey A. Piontkovski

coastal upwelling, rainfall, sea surface temperature, food availability, wind speed and
basin scale or global scale oscillations driving geostrophic currents) have been
identified as the factors affecting variations of sardine catches over various
geographic regions (Kripa et al., 2015; Longhurst and Wooster, 1990; Peck et al.,
2013; Schwartzlose, et al., 1999). With this respect, the Arabian Sea variability is
unique because it encompasses all aforementioned processes. A multiple scale
coupling of physical, chemical and biological processes result in huge spatio-temporal
gradients of characterizing them parameters, such as atmospheric pressure gradients
inducing powerful monsoonal winds, seasonal coastal upwellings and winter
convective mixing of the upper layers of the sea. These processes generate intensive
enrichment of upper layers with nutrients, with subsequent magnitudes of primary and
secondary production in the western Arabian Sea ranked among the highest in the
world tropical ocean (Qasim, 1977; Longhurst, 1998; Piontkovski and Banse, 2006).
The main fish families caught by fishers of Oman in 1950-2015, were contributed by
the Clupeidae (~32%), mackerels (Scombridae, ~19%), emperors (Lethrinidae, ~6%),
jacks (Carangidae, ~5%), and groupers (Serranidae, ~4%) (Khalfallah et al., 2016).
R.V. “Rastrelliger” surveys along the Omani shelf conducted in the Arabian Sea in
1989, 1990 and 1995, reported the small pelagic fish biomass of about 252,000 tones
contributed mainly by Sardinella longiceps, and other small pelagics (Johannesson,
1995). Later on, five consecutive seasonal surveys conducted by R.V. “Al Mustaqila
1” along the Omani shelf, in 2007-20008, reported a stock of 1.9 million tones
indicating a huge increase in the biomass of sardines and other small pelagics
(Gauthier et al., 2009).
The Omani sardine fishery is a market driven coastal traditional fishery targeted by
beach sein, purse sein, and encircling gillnets. The major part of the fishing effort is
distributed along 1712 km of the coast overlooking the western Arabian Sea, in which
sardines contributed 85 % to the total small pelagic fish landings d u r i n g t h e p a s t
t w o d e c a d e s (Fishery Statistics Book, 2018). Sardinella longiceps contributes
about 95 % to Omani sardine landings (Dorr III et al., 1990). Several studies have
attempted to identify spatio-temporal patterns of these landings (Al-Jufaili et al.,
2006; Al-Jufaili, 2007; Al-Jufaili and Al-Jahwari, 2011; Piontkovski et al., 2014). The
current paper extends aforementioned efforts and addresses factors driving seasonal
and interannual fluctuations of sardine catches over three main fishery vilayats
(provinces) along the Omani coast, namely, Ash-Sharqiyah, Al-Wusta, and Dhofar, of
which the western Arabian Sea catches were compiled.

METHODS
Monthly time series of the concentration of chlorophyll-a, dissolved nitrate, mixed
layer depth, euphotic layer depth, outgoing long wave radiation and sea surface
temperature were retrieved from the NASA/Giovanni database as part of the NASA's
Goddard      Earth     Sciences    Data    and   Information    Services      Center
(https://giovanni.gsfc.nasa.gov/giovanni).
Seasonal and Interannual Variations of Sardine Catches along the Omani Coast        79

Along with remotely sensed parameters, this database incorporates products
assimilated from the NASA Ocean Biogeochemical Model (NOBM), which is a
coupled three-dimensional model with 14 vertical layers, incorporating general
circulation, biogeochemical, radiative components and assimilating monthly global
products (Gregg, 2008). The model is driven by wind stress, shortwave radiation and
sea surface temperature. The assimilation process has an algorithm of constant
readjustment of the model, based on the chlorophyll data acquired by satellite sensors.
It is assumed that oceanic radiation is driven by water scattering, absorption,
dissolved organic matter, and optical properties of the phytoplankton groups. The
estimates of sea surface nitrates are based on the algorithms linking the shipboard
with remotely sensed data.
The NOBM resembles phytoplankton groups, nutrients, a single herbivore group, and
detrital pools along with the major ocean carbon components (Gregg and Casey,
2007). The spatial resolution of the model is 0.67o x 1.25o. Monthly data on dissolved
nitrate, mixed layer depth, euphotic layer depth, outgoing long wave radiation and
concentration of diatoms were retrieved from this model.
The inshore, offshore and alongshore migrations are common features of sardine
population behavior. With this regard, the offshore gradients of sea surface
temperature were computed and used as one of the variables subjected to the Principal
Component Analysis. In particular, the offshore sea surface temperature gradient
between two adjacent regions has been computed. The coordinate box of the western
region (16-22oN; 54-60oE) had encompassed the Omani shelf, while the eastern
region was located one degree offshore.
Zonal and meridional components of wind speed were retrieved from the
NCAR/NCEP reanalysis database (Kistler et al., 2001), in which the monthly
averages of wind speed at 10 m above sea level were extracted for the Omani shelf
region overlooking the western Arabian Sea. The meridional component has a
positive value when the wind is blowing from south to north. A south wind has a
positive meridional constituent, while a north wind has a negative one. In the case of
zonal component, values are positive when the wind is blowing from west to east.
Thus, a western wind has a positive zonal constituent while an eastern wind has a
negative one.
Monthly time series characterizing the Indian Ocean Dipole and the El-Niňo Southern
Oscillation (El-Niňo 3.4) were downloaded from the NOAA website maintained by
the Working Group on Surface Pressure (Table 1).
Maps for sea surface height anomalies enabling calculation of the amount of cyclonic
and anticyclonic mesoscale eddies were acquired from the Archiving, Validation and
Interpretation    of    Satellite   Oceanographic        Data     Center     website
(http://www.aviso.oceanobs.com) and the CCAR Global Near Real-Time SSH
Anomaly/Ocean Color Data Viewer (http://argo.colorado.edu/~realtime/modis). In
following the approach proposed by Chelton et al. (2011) and Arur et al. (2014), the
outermost closed contour resembling a vortex with a minimum 5 cm amplitude, was
identified as an eddy. Cyclonic eddies (with anticlockwise rotation) were
80                                                Saud M. Al Jufaili and Sergey A. Piontkovski

     characterized by negative sea surface height anomalies depressed in cores of eddies,
     while anti-cyclonic eddies (with clockwise rotation) have positive sea surface height
     anomalies elevated in cores, within the bounding contour.
          Table 1. Environmental variables used for the Principal Component Analysis.
                 Variable                          Time range                  Data source
Gradient of atmospheric pressure at the sea       1948-2018      http://www.esrl.noaa.gov/psd/data
surface, mb
Photosynthetically active radiation,              1997-2015      https://giovanni.gsfc.nasa.gov
Einstein m-2 day-1
Meridional component of the wind speed,           1948-2018      http://www.esrl.noaa.gov/psd/data
m s-1
Zonal component of the wind                       1948-2018      http://www.esrl.noaa.gov/psd/data
speed, m s-1
Sea surface temperature gradient,                 1948-2018      http://www.esrl.noaa.gov/psd/data
o
  C km-1
Sea surface temperature, oC                       1948-2018      https://giovanni.gsfc.nasa.gov
Euphotic depth, m                                 1997-2015      https://giovanni.gsfc.nasa.gov
Mixed layer depth, m                              1997-2015      https://giovanni.gsfc.nasa.gov
Meridional component of geostrophic               1992-2018      https://www.esr.org/research/oscar
current velocity, m s-1
Zonal component of geostrophic current            1992-2018      https://www.esr.org/research/oscar
velocity, m s-1
Amount of cyclonic eddies                         1993-2018      https://www.aviso.altimetry.fr
Amount of anticyclonic eddies                     1993-2018      https://www.aviso.altimetry.fr
                                             -1
Concentration of dissolved nitrate, µmol L        1997-2015      https://giovanni.gsfc.nasa.gov
                                       -3
Concentration of chlorophyll-a, mg m              1998-2018      https://giovanni.gsfc.nasa.gov
Outgoing longwave radiation, Wm-2                 1948-2018      http://www.esrl.noaa.gov/psd/data
El-Nino Southern Oscillation index                1950-2018      https://www.esrl.noaa.gov/psd/data/clim
                                                                 ateindices/list/
                                                                 https://origin.cpc.ncep.noaa.gov/product
                                                                 s/analysis_monitoring/ensostuff/ONI_v5
                                                                 .php
Indian Ocean Dipole index                         1970-2018      https://www.esrl.noaa.gov/psd/gcos_wgs
                                                                 p/Timeseries/DMI/http://www.jamstec.g
                                                                 o.jp
Sardine landings, mt                              1988-2018      Statistics Book, 2002-2018
Large pelagic landings, mt                        1988-2018      Statistics Book, 2002-2018
Fishing effort                                    1988-2018      Statistics Book, 2002-2018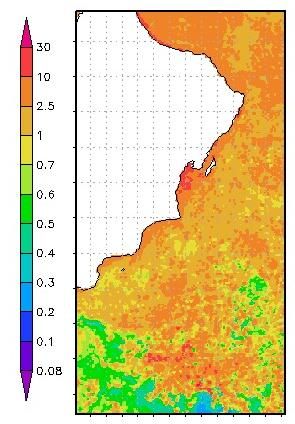
Seasonal and Interannual Variations of Sardine Catches along the Omani Coast         81

Monthly data on landings of large and small pelagic fishes and on the number of boats
involved in artisanal fishery were retrieved from the archives of the Ministry of
Agriculture and Fisheries. Landings have been recorded by categories entitled in
archived materials as “Large pelagics”, “Small pelagics”, “Demersal”, “Unidentified
Fishes”, etc. Within these categories, fish is distributed over taxonomic groups, such
as: “Yellowfin Tuna”, “King Fish”, “Queenfish”, “Sardines”, and etc. Data were
published annually, in the form of the “Fisheries Statistic Book” (2010-2018). We
defined and used “catches” as the sum of “landings” contributed by retained, landed
and discarded catch.
Sardines o f t h e A r a b i a n S e a are exposed to the press of large pelagic
predators, such as the longtail tuna (Thunnus tonggol (Bleeker, 1851)), sawtooth
barracuda (Sphyraena putnamiae (Jordan and Seale, 1905)), kingfish
(Scomberomorus       commerson      Lacepéde,1802),     queenfish     (Scomberoides
commersonnianus Lacepéde,1801), sailfish (Istiophorus platypterus (Shaw, 1792)),
and some other species. With this regard, we merged data on landings of large pelagic
species and used this parameter in the Principal Component Analysis, to characterize
the trophic press imposed on sardines.
The “Statistica” v.9 software was used for the Principal Component Analysis (PCA)
and the Spectral Analysis of monthly time series of sardine catches. A Hamming
window with weights of 0.04, 0.24, 0.45 and 0.04 was applied to a detrended and
mean-subtracted monthly time series of sardine catches, in order to estimate the
power spectrum of fluctuations, in particular the main period pronounced in 30 year
monthly time series. The PASTv.3.25 software (https://www.softpedia.com) was used
to run the Mann-Kendall test, in order to assess the validity of interannual trends.
A set of variables subjected to the PCA was contributed by physical, chemical and
biological parameters. The biological part was centered on trophic interactions of
sardines. On one hand, we considered the food source represented by phytoplankton
and variables affecting its variability (namely, the mixed layer depth,
photosynthetically active radiation, outgoing long wave radiation, and the
concentration of dissolved nitrate). On the other hand, sardines are stressed by large
pelagic predators, these catches have been treated as indicators of their biomass in our
analysis.
It should be mentioned that the assembled time series of environmental variables were
fairly heterogeneous, due to a number of years poorly covered by measurements. With
this respect, only the latest 18 years of data (2000-2018), with the most
comprehensive estimates, were subjected to the PCA.

RESULTS
The upper mixed layer of the ocean is the habitat of sardine populations. With this
regard the analysis of environmental forces and physical-biological coupling in the
upper layer was carried out. Monthly variation of the wind field was broken down
into the zonal and meridional components of the speed. The NCEP-NCAR database
82                                        Saud M. Al Jufaili and Sergey A. Piontkovski

enables one to retrieve data for a relatively broad time range, from the 1950s to the
present time. The seasonal pattern is well pronounced and exhibits the peak of both
wind speed components associated with the Southwest Monsoon (SWM). We plotted
interannual variations of the wind speed during SWM periods (Figure 1).

Figure 1. Interannual variations of the wind speed components during the Southwest
Monsoon (averaged for June, July and August). The dashed line stands for the
meridional component of the wind speed. The solid line stands for the zonal
component of the wind speed. Curves were smoothed by a cubic spine.

The decade of 2000-2010, was notorious for a declining trend of the wind speed
pronounced in both components (Mann-Kendall test: (a) for meridional component S
= -98, Z = 3.40, p (no trend) = 0.0007; (b) for zonal component S = -81, Z = 2.80, p
(no trend) = 0.005). Over years, a declining trend of the zonal component was also
pronounced during both inter-monsoon seasons (p>0.05) but not the Northeast
Monsoon. It should be noted that the wind speed has been averaged for a large region
(the 6o box over latitude and longitude, covering the Omani shelf and off the coast).
The averaging smoothed the spatial heterogeneity of the wind field, which is
important in mediating the mesoscale eddies pronounced at the sea surface.
The spatio-temporal distribution of mesoscale eddies in the region was discussed in
our previous paper (Piontkovski et al., 2019). With regard to the present study, we
updated the interannual trend of eddy occurrence, which confirmed the previously
reported pattern of the number of cyclonic and anticyclonic eddies increasing over
years, during inter-monsoon seasons. Eddies the size of ~ 200 km in diameter have
been pronounced in the field of sea surface height anomalies. Also, they affected
spatio-temporal variations of sea surface temperature (SST). The monthly occurrence
of cyclonic versus anticyclonic eddies was balanced.
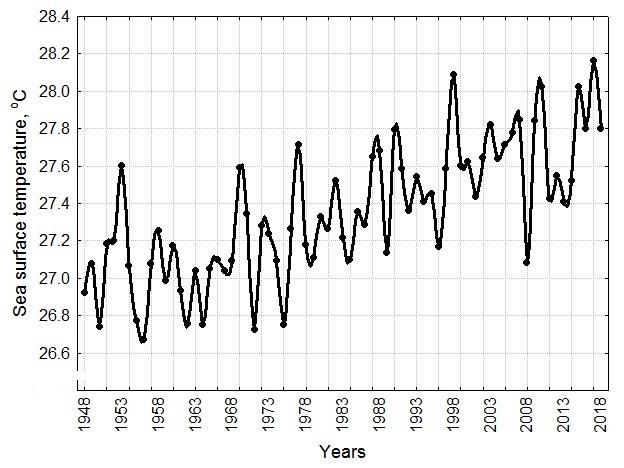
Seasonal and Interannual Variations of Sardine Catches along the Omani Coast       83

Temperature is believed to be an important environmental factor that influences
growth, maturation and survival of small pelagic fishes of the Arabian Sea (Al-Abri et
al., 2019). Sardines inhabit the upper mixed layer mostly, which is occupied by the
Indian Ocean Water Mass. Due to monsoonal mode of winds, seasonal variations of
the temperature in this water mass are substantial. In the past two decades, the
minimal SST of 22.18oC was recorded in January-2001, while the maximal value
attained 32.25oC in May-2010. On average, the SST of the SWM, in the western
Arabian Sea, 1.8 times exceeded the annual mean temperature. The interannual
variation of the SST exhibited two patterns, i.e. the increase of annual means over
years and the increase of intra-annual variations of SST over years (Figure 2).The
later one points to the intensifying variation of temperature within a seasonal cycle.

Figure 2. Interannual variations of the sea surface temperature (left panel) and the
coefficient of variation of sea surface temperature. The Mann-Kendall trend test for
SST: S = 1400, Z = 6.96, p(no trend) = 3.76*10-12). The Mann-Kendall trend test for
the coefficient of variation of SST: S = 617, Z = 3.07, p (no trend) = 0.002. Curves
were smoothed by a cubic spine.
84 Saud M. Al Jufaili and Sergey A. Piontkovski
The Mann-Kendall trend test implied a statistical significance of both trends. In fact,
the observed SST pattern was a projection of a more general pattern of temperature
increase over years, which was pronounced in the historical data set assembled for the
region. The increase of temperature was observed in the upper 300m layer. Our
assessments stem from the regional database on CTD casts, from about 90 national
and international expeditions described elsewhere (Al-Jufaili and Piontkovski, 2019).
For instance, in the upper 50m (which is the sardine habitat), the temperature has
increased by 2oC during the latest six decades (1960-2020), which gives a rate of
~0.3oC per decade for the SWM season. A positive trend has also been observed in
changes in salinity, which increased by 0.34ppm (~0.06 per decade) during the latest
six decades. The Mann-Kendall trend test implied a statistical significance of both
trends (S = 11, p (no trend) = -0.028).
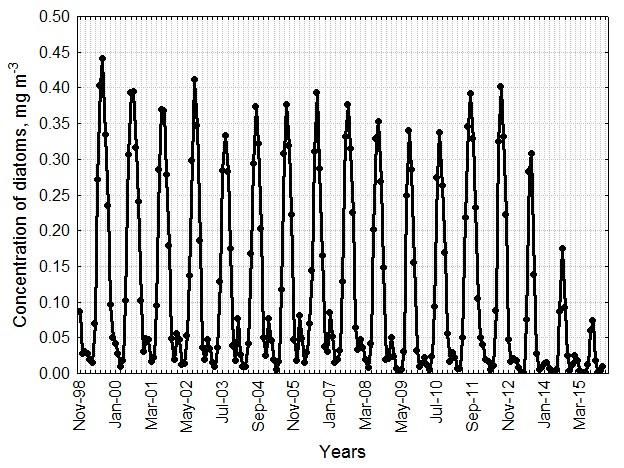
Sardine diet in Omani waters is mainly contributed by phytoplankton, which
persuaded us to look into the data on nutrients, diatom and chlorophyll-a time series
available for the region from the NOBM model. Fragments of these data are shown in
Figure 3.
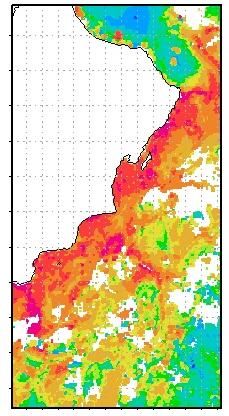
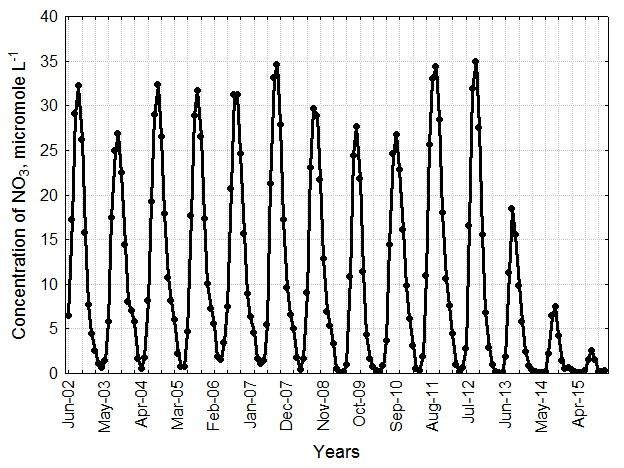
Figure 3. Monthly variations of the concentration of diatoms and nitrates in the
upper mixed layer of the western Arabian Sea.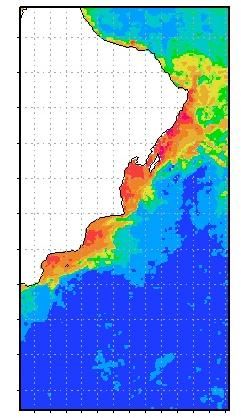
Seasonal and Interannual Variations of Sardine Catches along the Omani Coast         85

The fluctuations shown on both plots reflect the seasonality, which is the main
pattern, and along with seasonality, a sign of an interannual declining trend, which
took place in the latest decade. Unfortunately, the model products are limited to 2015.
The chlorophyll-a concentration demonstrated well pronounced seasonality as well, in
which the summer peak associated with the SWM exceeds the annual mean values by
a factor of three.
The spatial distribution of chlorophyll-a concentration along the Omani shelf was
highly heterogeneous within all the seasons. We exemplified the three seasons of
2008, which showed two orders of magnitude variation in the western Arabian Sea
(Figure 4),

Figure 4. Seasonal variation of the chlorophyll-a concentration in the western
Arabian Sea (including the Omani shelf). The vertical color bar stands for the
chlorophyll-a concentration (mg m-3). From left to right: Northeast Monsoon
(January-February, 2008), Spring Inter-monsoon (April-May, 2008), and Southwest
Monsoon (August-September, 2008). White zones in the right figure stand for a cloud
mask. Spatial resolution: 4km (MODIS Aqua level 3 products).

The three provinces along the coast (namely, Ash-Sharkiyah, Al-Wusta and Dhofar)
are the main contributors to Omani fishery. Provinces differ markedly by the
extension of the shelf as well as by the number of fishing boats involved in artisanal
landings of sardines. Ash-Sharkiyah has a shelf area of about 6000km2, followed by
Al-Wusta, with ~8,000km2 and Dhofar, with 17,000 km2. The number of boats over
provinces, averaged for the period of 2000-2018, was 617, 405 and 86 respectively.
Sardine catches and fishing effort were seasonal, in all three provinces. Due to rough
weather conditions, the number of boats operating during the SWM was less
compared to the spring and fall inter-monsoon seasons (Figure 5). For comparison, it
might be noted that the weather factor is not substantial to the Sea of Oman fishery (in
86 Saud M. Al Jufaili and Sergey A. Piontkovski
Muscat and Al-Batinah provinces), in which the number of boats stays almost
invariant over seasons.
Figure 5. Seasonal variations of fishing efforts over provinces (2007-2018). Y-axis:
monthly number of boats/annual mean.
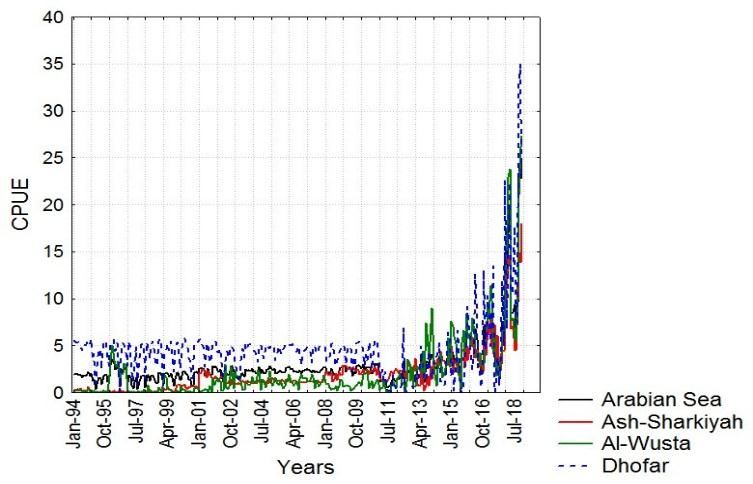
Seasonal variations of sardine catches persist on a positive trend of inter-annual
landings observed through all the provinces (Figure 6). Over the past eight years, for
instance, the catch per unit of effort (CPUE) in Dhofar, Al-Wusta and Ash-Sharkiyah
increased by a factor of 4,12 and 5, respectively.
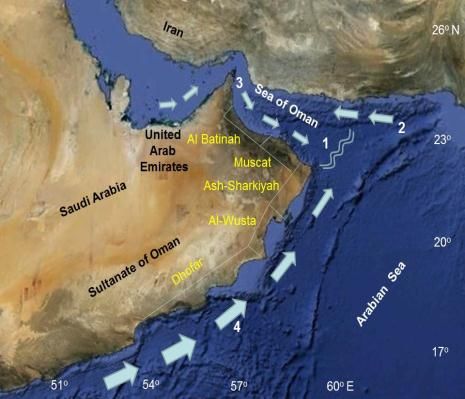
Figure 6. Monthly variations of sardine catches along the Omani shelf. Upper panel:
monthly time series of CPUE over three provinces and the western Arabian Sea as the
whole. Low panel: a scheme of geostrophic currents during SWM and a three-
dimensional bathymetric map (www.earth.google.com). Two parallel zigzags (1)
demarcate the location of the Ras Al Hadd frontal zone formed by the confluence of
the East Oman Current (3) and Oman Coastal Current (4). Arrows (2-4) indicate
direction of currents during the Southwest Monsoon. (2): inflow of the Indian Ocean
Water mass, (3): outflow of the Persian Gulf Water mass.Seasonal and Interannual Variations of Sardine Catches along the Omani Coast 87 An increase in sardine CPUE has been accompanied by increasing monthly variations of CPUE, which have been observed in all three provinces during the latest decade, as well as in the whole studied region (named as “Arabian Sea” in Figure 6). The spectral analysis of 30 years detrended and mean-subtracted monthly time series (not shown here) implied dominant periods of three and one year, pronounced in CPUE averaged for the whole studied region (16-22oN, 54-60oE). Along with the aforementioned environmental factors, the trophic stress imposed on sardines by large pelagic species should be analyzed. With these regards, monthly data on landings of all large pelagic species (merged) and the number of boats were converted to the CPUE and incorporated into the Principal Component Analysis. Among all the factors subjected to PCA, the El Niño-Southern Oscillation index and the Indian Ocean Dipole index acted as indicators of the global scale and the basin scale anomalies affecting regional circulation. In general, interannual variations of the sea surface temperature in the tropical Indian Ocean are forced by the surface heat flux variations remotely driven from the tropical Pacific through the El-Niño Southern Oscillation (Shinoda et al., 2004). The El Niño-Southern Oscillation (ENSO) is generated by fluctuations in the equatorial Pacific, between warmer than normal sea surface temperatures in the eastern equatorial Pacific (corresponding to the El-Niño phase) and cooler than normal temperatures in the central equatorial Pacific (the La- Niña phase). ENSO is believed to be the most powerful phenomenon affecting the globe. Since 2000, six ENSO have been observed. The Indian Ocean Dipole (IOD) also mediates interannual variability in the Arabian Sea. The intensity of IOD used to be identified by the sea surface temperature gradient between the western equatorial Indian Ocean (50oE-70oE and 10oS-10oN) and the southeastern equatorial Indian Ocean (90oE-110oE and 10oS-10oN). This gradient characterizes anomalous cooling of sea surface temperature in the southeastern region and anomalous warming in the western one (Saji et al., 1999). The Principal Component Analysis elucidated three statistical eigenvectors (Factor1, Factor2 and Factor3), which explained 71% of the total variability in the system of proposed environmental variables (Table. 2).
88 Saud M. Al Jufaili and Sergey A. Piontkovski
Table 2. Factor loading and statistical coupling in interannual variations of selected
parameters. Eigenvalues: 5.26, 4.11 and 3.90. Statistically significant loadings
exceeding 0.7 are marked in bold.
Variables F1
(28%) F2 (22%) F3 (21%)
Large pelagic species (CPUE) -0.76 -0.04 -0.18
Sardines (CPUE) 0.84 0.17 -0.30
Atmospheric pressure gradient at sea surface -0.26 0.44 0.69
Sea surface temperature (western part) 0.07 -0.76 -0.61
Sea surface temperature (eastern part) 0.14 -0.92 -0.17
Sea surface temperature gradient (west-east) -0.07 -0.02 -0.81
Zonal component of the wind speed -0.75 0.37 -0.15
Meridional component of the wind speed -0.82 -0.06 -0.07
Concentration of chlorophyll-a -0.29 0.60 -0.22
Meridional component of the current velocity -0.15 0.30 -0.85
Zonal component of the current velocity 0.23 0.75 -0.39
Cyclonic eddies 0.77 0.11 0.32
Anticyclonic eddies 0.64 -0.05 0.37
Photosynthetically available radiation 0.28 -0.05 -0.01
Mixed layer depth 0.49 0.69 -0.03
Concentration of dissolved nitrates -0.81 -0.04 0.36
Outgoing longwave radiation -0.67 -0.23 0.10
El-Niño-Southern Oscillation index 0.16 -0.36 -0.81
Indian Ocean Dipole index 0.13 -0.80 0.52
As the variable, sardines have contributed to the Factor1, in which statistical linkages
of sardines with large pelagic predators, wind speed, cyclonic eddies and
concentration of dissolved nitrates formed the major factor load (28%). Sardines and
large pelagic species were the most powerful contributors, with opposite signs, which
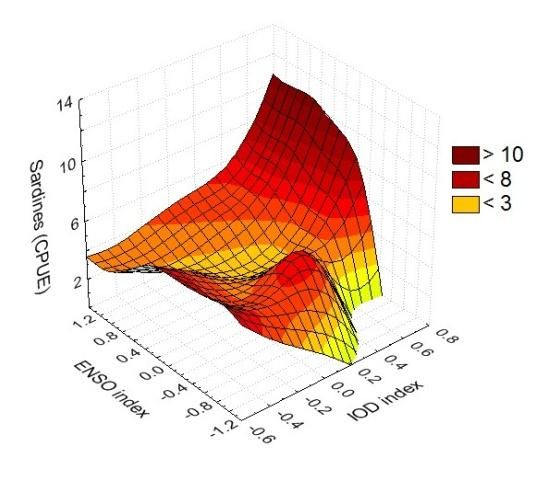
placed these variables in opposite parts of the F1 vs F2 factor plane. The only variableSeasonal and Interannual Variations of Sardine Catches along the Omani Coast 89 of Factor1 sardines teamed with (by a positive sign), was the amount of cyclonic eddies. In fact, both types of eddies (cyclonic and anticyclonic) form the cluster, which may be illustrated by the projection of variables on the factor plane (Figure 7). Figure 7. The projection of variables on the factor plane. Abbreviations. Zw: zonal component of the wind speed, Mw-meridional component of the wind speed, SST- East: sea surface temperature (eastern part of the region), SST-West: sea surface temperature (western part of the region), SST-Grad: sea surface temperature gradient between western and eastern parts, PAR: photosynthetically available radiation, OLR: outgoing long wave radiation, SLP-Grad: atmospheric pressure gradient at sea surface, Merid.Current: meridional component of geostrophic current velocity, Zonal Current: zonal component of geostrophic current velocity, MLD: mixed layer depth, NO3: concentration of dissolved nitrates, Chl: concentration of chlorophyll-a, Cycl- eddies: number of cyclonic eddies in the region, Anticycl-eddies: number of anticyclonic eddies in the region, IOD: Indian Ocean Dipole index, ENSO: El Niño- Southern Oscillation index, Large Pelagic: total CPUE of large pelagic species. The sea surface temperature and IOD form the other well pronounced cluster which contributes to Factor 2. Overall, Factors 2 and 3 contributed equally (22% and 21%), to the total variability. The range of sea surface temperature drives the offshore- inshore migrations of sardines. Optimal temperatures are located between 26oC and 28oC. Schools abandon the upper layer when the temperature exceeds 29oC (Chidambaram, 1950). In this respect, the annual sea surface temperatures of the latest decade as well as the coefficient of their variation point to the possibility of sardine populations being associated with coastal waters more closely than in the previous decade (Figure 2).
90                                           Saud M. Al Jufaili and Sergey A. Piontkovski

The Indian Ocean Dipole and the El Niño-Southern Oscillation index were notorious
contributors to F2 and F3. It should be noted that the time series of both indices were
retrieved from the period of spring inter-monsoon - which is the time of maximal
sardine catches. Taking into account the marked role of both atmospheric oscillations,
we plotted sardine catches (CPUE) as the function of two indices (Figure 8, left
panel).

Figure 8. Relationship between sardine catches (left panel), yellowfin tuna catches,
El-Niño Southern Oscillation, and Indian Ocean Dipole index (1988-2018). Diagrams
were smoothed by the Distance Weighted Least Squares method. The right panel
figure is taken from Al-Jufaili and Piontkovski (2019).

The three-dimensional plot of coupling illustrates the situation in which the highest
catches take place when the ENSO and IOD both approach their medium to full
strength positive phase (0.4-1.4 ENSO index values and 0.4-0.8 IOD values). This
plot was compared with the similar one, characterizing the Yellowfin tuna catches
(Al-Jufaili and Piontkovski, 2019). The highest catches of this species take place in
the years when the ENSO index corresponds to the range of 0.8-1.2 while the IOD
index exhibits the range of 0.6-0.8.

DISCUSSION
Seasonal and interannual variations of catches incorporate a human-induced and an
environmental component. In Oman, an artisanal fishing effort could be estimated,
most accurately, for the latest three decades (1988-2018). Over 90% of vessels were
fiberglass boats, 5-9 m long. In Ash-Sharkiyah, Al-Wusta, Dhofar, a three to four fold
increase of fishing efforts was observed (Fishery Statistics Book, 2011, 2013, 2018).
Overfishing, related to fishing effort, depends upon the market demand. For instance,
the Yellowfin tuna stock in the Indian Ocean is overfished (IOTC, 2018;
http://firms.fao.org/firms/resource/22/en), while the Indian oil sardine is less stressed,
due to less valuable contribution to the revenue, as well as high reproductive
Seasonal and Interannual Variations of Sardine Catches along the Omani Coast          91

properties of sardine populations.
As for environmental factors, a positive interannual trend and the magnitude of
seasonal fluctuations, which increased gradually during the latest decade, have been
the two main patterns we denoted, in analyzing monthly time series on sardine catches
(CPUE).
Presumably, an increase in the magnitude of seasonal fluctuations in sardine catches
over years was associated with an increase of the magnitude of sea surface
temperature fluctuations (Figure 2), accompanied by a decline of the wind speed
(Figure 1), increased occurrence of mesoscale eddies (Al-Jufaili and Piontkovski,
2019) and declined concentration of diatoms (Figure 3) which contribute gradually to
the sardine diet (Jayaprakash and Pillai, 2000; Remya et al., 2013). All the above
processes could have stimulated sardines to undertake intensive alongshore and
offshore migrations footprinted in the form of enhanced magnitudes of catches. The
distances of sardine feeding migrations could be thousands of kilometers
(Schwartzlose et al., 1999; Wada and Kashiwai, 1991) and are believed to be ruled
by changes of the preferential temperature zones and predator press (Armstrong et
al., 1991; O’Donoghue et al., 2010).
On the opposite side of the Arabian Sea, along the Indian shelf, the sea surface
temperature range below the physiological optimum forces sardine to migrate. In this
respect, a correlation was found between the sea surface temperature and landings of
oil sardine along the Indian coast with well pronounced temperature gradients, from
the North to the South (Vivekanandan et al., 2009). The thermal range of the Indian
oil     sardine     populations   is    located    between    22oC     and     28oC
(https://www.fishbase.de/Summary/SpeciesSummary.php?ID=1511&AT=indian+oil+
sardine). The range of temperatures in the western Arabian Sea observed during the
latest decade (Figure 2) and the coefficient of variation of these temperatures
exceeded the optimum reported for sardines and thus has stimulated migrations.
The PCA identified a number of environmental variables which contributed markedly
to interannual variations of sardine catches, namely the wind speed, sea surface
temperature, geostrophic current velocity, number of cyclonic eddies, two large scale
atmosphere driven oscillations –the ENSO and IOD, and the total catch of large
pelagic species (predators on sardines). Moreover, the three year period pronounced
in fluctuations of sardine catches (according to the Spectral Analysis) was reported in
the fluctuations of the multivariate ENSO index (Piontkovski and Chiffings, 2014).
A number of other studies emphasized the role of the aforementioned parameters in
spatio-temporal variability of sardine catches. In particular, in the California Current,
the elevated concentrations of sardine larvae were associated with cyclonic eddies
and the peripheries of anticyclonic eddies, which are believed to be favorable areas
for sardine recruitment (Logerwell and Smith, 2001; Logerwell et al., 2001). Warm
eddies could often branch out warm streamers well seen in satellite images of sea
surface temperature with streamer structures of about 10 km in width. Simultaneous
satellite measurements and aircraft observations on sardine schools have shown that
sardines tend to use warm streamers for migration towards the coast, with the
92                                          Saud M. Al Jufaili and Sergey A. Piontkovski

formation of dense schools at the head of warm streamers, in which fishing grounds
are often formed (Sugimoto and Tameishi, 1992; Tameishi et al., 1994).
In our case, sardine catches exhibited a statistical association with cyclonic (cold)
eddies, although the anticyclonic ones have been standing very close to the cyclonic,
by contribution to the Factor1 and have had the same sign (Table 2). Cyclonic eddies
of the western Arabian Sea have well pronounced chlorophyll maxima, in their central
parts (Tang et al., 2002). Presumably, these maxima could attract sardine schools.
Sampling along the transects directed offshore from the Omani shelf, implied diatoms
to be dominant during summer coastal upwelling (Latasa and Bidigare, 1998). In the
later field surveys over the continental slope and the western open sea waters, in
February and March, diatoms from genera Rhizosolenia, Thalassiotrix, Nitzschia, and
Chaetoceros, accounted for ~80-98% of the total phytoplankton biomass in the upper
100m layer. In cyclonic eddies, the total phytoplankton biomass exceeded that of
anticyclonic eddies by as much as 5-6 times (Kuzmenko, 2006).
An increase in the number of eddies in the western Arabian Sea (Piontkovski et al.,
2019) makes the upper layer increasingly heterogeneous, by physico-chemical
properties. An increasing (over years) coefficient of variation of SST reflects this
event (Figure 2).
The gut content analysis of the sardines caught in coastal waters of Muscat and Sohar
(the Sea of Oman) has indicated that phytoplankton could comprise up to 68% of
their diet (Haleem et al., 2011). In the eastern Arabian Sea, in coastal waters of India,
the remotely sensed chlorophyll-a could explain up to 39% of interannual
variations in sardine landings (George et al., 2012). However, no direct correlation
was found between the CPUE of sardines and remotely sensed chlorophyll-a
(averaged for the studied area and analyzed in the form of annual means in our study).
The PCA did not reveal the chlorophyll-a as a statistically significant parameter,
either, although chlorophyll-a, with the loading value of 0.6 in F2, was close to the
statistically significant level (0.7) marked in bold, in Table 2. Also, statistically
significant coupling between chlorophyll-a and sardines was pronounced in the Sea of
Oman, in the data of the previous decade (Piontkovski et al., 2014).
A depleted contribution of chlorophyll-a to PCA loading could be explained, in part,
by huge winter algal blooms caused by the dinoflagellate Noctiluca scintillans in
the western Arabian Sea. This species is actively avoided by sardines (Nair, 1958)
and Noctiluca has not been reported in their stomachs (Prasad, 1953; Sekharan,
1966). Being a heterotrophic organism feeding on small phytoplankton, Noctiluca
competes for food with sardines. Periodically, endosymbionts of Noctiluca
contribute markedly to remotely sensed chlorophyll-a and distort the ocean color
(hence remotely sensed chlorophyll-a concentration) contributed by the other
phytoplankton groups. The Noctiluca blooms dominate the northern part of the
western Arabian Sea and are less pronounced in the southern part. In this respect,
monthly fluctuations of chlorophyll-a in these parts (which we analyzed separately,
for the Ash-Sharkiyah and Dhofar provinces, along with the whole western Arabian
Sea region) were not correlated. This affected the correlation between sardines and
Seasonal and Interannual Variations of Sardine Catches along the Omani Coast         93

chlorophyll-a on the scale of the whole western Arabian Sea.
The El-Niño Southern Oscillation and Indian Ocean Dipole play a notorious role in
long-term variations of the sea surface temperature in the tropical Indian Ocean (Saji
et al., 1999), although coupling between these oscillations is yet to be understood in
detail. The ENSO-induced anomalous circulation over the Arabian Sea could be either
countered or supported by the Indian Ocean Dipole, depending on the state of the
phase and the amplitude of the two (Charabi and Abdul-Wahab, 2009). The diagrams
we proposed (Figure 8), characterized the diversity of the scenario of coupling
between the El-Niño Southern Oscillation, Indian Ocean Dipole and fish catches
along the Omani shelf. The shape of diagrams points to a certain “match-mismatch”
situation in the interplay of three variables. Because IOD and ENSO phases are not
correlated, the occurrence of “the match situation”, which results in maximal catches,
is difficult to predict.
IOD and ENSO also impact the variables which the PCA has contoured as statistically
significant in variations of sardine catches. In the southeast Indian Ocean, for
instance, the interannual variation of eddy occurrence was associated with their
kinetic energy, which was mediated by fluctuations of regional currents. In turn, the
intensity of these currents was modulated by the Indian Ocean Dipole, the Southern
Annular Mode, and the El-Niňo Southern Oscillation (Jia et al., 2011).
On the opposite side of the Arabian Sea, a negative trend of sardine landings observed
during the latest six years over the shelf of Kerala (India) was reported (Sajna et al.,
2019). Kerala is the major producer of oil sardine, with landings about one order of
magnitude higher than in Oman (FAO, 2016). The peak of landing in 2012 (mediated
by an almost 4 fold increase in fishing effort) was followed by a gradual decline, up to
the present time. The factors driving this decline were rainfalls, series of weak
monsoons and the 2015 ENSO resulted in warmer waters which negatively affected
the maturation of sardine larvae and the enhanced abundance of jellyfish which
suppressed the recruitment after 2013 (Kripa et al., 2018).
Details of the mechanisms driving opposite trends of sardine catches on opposite sides
of the Arabian Sea are yet to be elucidated. We assume that the “match-mismatch
situation”, which stems from the interplay between sardine catch, ENSO and IOD on
both sides, is one of the important constituents for comparison. In a broader context,
the phenomenon of synchronized (over various geographic regions and oceans) or out
of phase fluctuations in sardine landings have been discussed and related to the global
scale climate driven events (Schwartzlose et al., 1999).
In the 30 year historical record we analyzed, the latest decade of sardine catches has
exhibited a huge peak. The next several years of catches would contour the period of
this peak. This expectation bolds the issue of the characteristic period pronounced in
interannual fluctuations of sardine catches along the Omani shelf. For instance, data
from the Pacific Ocean implied a period of about 50 years, in sardine landings
(Chavez et al., 2003). Reconstruction of the history of pacific sardine biomass over
the past two millennia from sediments showed that sardines tend to vary over a
period of about 60 years (Baumgartner et al., 1992).
94                                          Saud M. Al Jufaili and Sergey A. Piontkovski

Once interannual variations of sardine landings over the Omani shelf are driven by a
complex coupling of several factors (discussed in this paper), one might expect a
characteristic period of variations to be mediated by interplay of these factors.
Nonetheless, the interannual variations footprinted in historical records of landings do
not exhibit a sign of these kinds of periods in the western Arabian Sea. As for the
eastern side, recent predictions under the climate-driven IPCC model RCP 4.5,
implied a general decline of Indian oil sardine catches along the Kerala coast, after
2049 till 2070s. The model revealed the increase of sea surface temperature to be one
of the major factors affecting the distribution and abundance of sardines (Sajna et al.,
2019).

CONCLUSIONS
An increase of the catch per unit of effort (in the past decade) and an increase of the
magnitude of seasonal fluctuations of these catches have been the main trends
pronounced in a 30-year time series of sardine catches.
The wind speed, sea surface temperature, geostrophic current velocity, number of
cyclonic eddies, the El-Niño Southern Oscillation, Indian Ocean Dipole, and large
pelagic species (predators on sardines) were the environmental variables which
modulated interannual variations of sardine catches along the Omani shelf
overlooking the western Arabian Sea. The relationship between catches, El-Niño
Southern Oscillation and Indian Ocean Dipole index pointed to a certain “numeric
match” of two atmosphere driven anomalies that should happen, to favor maximal
catches of sardines in the western Arabian Sea.

ACKNOWLEGMENTS
This research was funded by SQU grant # IG/AGR/FISH/17/01. The authors would
like to thank colleagues from the Ministry of Agriculture and Fisheries (Oman) for
providing data and consultations on fish catches.

REFERENCES
 [1]   Al-Abri, N.M., Piontkovski, S.A., Rabbaniha, M., Al-Abri, M., and Chesalina,
       T., 2019, Abundance and diversity of fish larvae assemblages in Omani
       coastal waters of Salalah region (the Arabian Sea). International Journal of
       Oceans and Oceanography, 13, 2, pp. 325-341.
 [2]   Al-Jufaili, S., and Al-Jahwari, O., 2011, The Omani coastal traditional sardine
       fishery 1994-2007: a review. Agricultural and Marine Sciences, 16, pp. 1-12.
 [3]   Al-Jufaili, S.M., 2007, Conceptual model for sardine and anchovy inverse
       cyclic behavior in abundance. Journal of Food, Agriculture & Environment, 5,
       pp. 317-327.
 [4]   Al-Jufaili, S.M., Al-Azri, A.R., and Al-Shuaily, S.S., 2006, A Preliminary
Seasonal and Interannual Variations of Sardine Catches along the Omani Coast 95
Investigation on the Omani Sardines and Anchovies Stock Fluctuation;
Recommendations for Future Studies. Pakistan Journal of Biological
Sciences, 9, pp. 1073-1082.
[5] Al-Jufaili, S., and Piontkovski, S.A., 2019, Seasonal and interannual variations
of Yellowfin Tuna catches along the Omani shelf. International Journal of
Oceans and Oceanography,13, 2, pp.427-454.
[6] Armstrong, M. J., Chapman, P., Dudley, S. F. J., Hampton, I., and Malan, P.
E., 1991, Occurrence and population structure of pilchard Sardinops ocellatus,
round herring Etrumeus whiteheadi and anchovy Engraulis capensis off the
east coast of southern Africa. South African Journal of Marine Sciences, 11,
pp. 227–249.
[7] Arur, A., Krishmam, P., George, G., Bharathi, M.P.G., Kaliyamoorthy, M.,
Shaeb, K.H.B., Suryavanshi, A.S., Kumar, T.S., and Joshi, A.K., 2014, The
influence of mesoscale eddies on commercial fishery in the coastal waters of
the Andaman and Nicobar Islands, India. International Journal of Remote
Sensing, 35, 17, pp. 6418-6443.
[8] Baumgartner, T. R., Soutar, A., and Ferrira-Bartina, V., 1992, Reconstruction
of the history of pacific sardine and northern anchovy populations over the
past two millennia from sediments of the Santa Barbara basin, California.
CalCOFI Report, 33, pp. 24-40.
[9] Charabi, Y, and Abdul-Wahab, S.A., 2009, Synoptic aspects of the summer
monsoon of southern Oman and its global teleconnections Journal of
Geophysical Research, 114, D07107, doi:10.1029/2008JD010234.
[10] Chavez, F. P., J. Ryan, S., Lluch-Cota, E., a n d Ñiquen, M. , 2003, From
anchovies to sardines and back: multidecadal change in the Pacific Ocean.
Science, 299, pp. 217-221.
[11] Chelton, D.B., Schlax, M.G., and Samelson, R.M., 2011, Global observations
of nonlinear mesoscale eddies. Progress in Oceanography, 91, pp. 167-216.
[12] Chidambaram, K., 1950, Studies on the length frequency of oil sardine,
Sardinella longiceps Cuv.&Val. and on certain factors influencing their
appearance on the Calicut coast of the Madras Presidency. Proceedings of
Indian Academy of Sciences, 31, pp. 252-286.
[13] Dorr III, J.A., Al-Bulushi, M., Al-Hijri, M., and Al-Lawatiya, M., 1990, Stock
assessment and management of Sardinella longiceps in the Sultanate of
Oman. Research Report. Marine Science and Fisheries Center. Ministry of
Agriculture and Fisheries. Muscat, Sultanate of Oman.
[14] FAO, 2016, Fishery and Aquaculture Statistics Yearbook, 2014, Food and
Agriculture Organization, 105. Rome.
[15] Fishery Statistics Book, 2011, Sultanate of Oman. Ministry of Fisheries.
Muscat, 156p.
[16] Fishery Statistics Book, 2013, General Directorate of Planning
&Development. Fisheries Statistics Department. Ministry of Agriculture and96 Saud M. Al Jufaili and Sergey A. Piontkovski
Fisheries. Muscat, 248p.
[17] Fishery Statistics Book, 2018, General Directorate of Planning
&Development. Fisheries Statistics Department. Ministry of Agriculture and
Fisheries. Muscat, 240p.
[18] Gauthier, S., Dunford, A., Macaulay, G., O’Driscoll G., and Divine, J., 2009,
NIWA survey-Fish resources assessment survey of the Arabian Sea coast of
Oman. Technical Report 3, Small pelagic fish resources of the Arabian Sea
coast of Oman. Bruce Shallard and Associates, 319 p.
[19] George, G., Meenakumari, B., Raman, M., Kumar, S., Vethamony, P., Babu,
M., and Verlecar, X., 2012, Remotely sensed chlorophyll: a putative trophic
link for explaining variability in Indian oil sardine stocks. Journal of Coastal
Research, 28, pp. 105-113.
[20] Gregg, W.W., 2008, Assimilation of SeaWiFS ocean chlorophyll data into a
three-dimensional global ocean model. Journal of Marine Systems, 69, pp.
205-225.
[21] Gregg, W.W., and Casey, N., 2007, Modeling cpccolithophores in global
oceans. Deep Sea Research, part II, 54, pp. 447-477.
[22] Haleem, S. Z. A., Jayabalan, N., Al-Kiyumi, F., Al-Kharusi, L., Al-Habsi, S.,
and Al-Marzouqi, A., 2011, Fishery, biology and population dynamics of
three small pelagic fish species (Indian oil sardine Sardinella longiceps,
Indian mackerel Rastrelliger kanagurta and Indian scad Decapterus russeli)
from the Sultanate of Oman. Project Final Report, Part II, p. 126-167. Marine
Science and Fisheries Center, Ministry of Agriculture and Fisheries Wealth,
Muscat.
[23] Jayaprakash, A.A., and Pillai, N.G.K., 2000, The indian oil sardine. In:
“Marine fisheries research and management” (V.N.Pillai and N.G.Menon,
eds). Central Marine Fisheries Research Institute, Kerala, India, pp. 259-291.
[24] Jia,F., Wu, L., Lan, J., and Qiu, B., 2011, Interannual modulation of eddy
kinetic energy in the southeast Indian Ocean by Southern Annular Mode.
Journal of Geophysical Research, 116, C02029, doi:10.1029/2010JC006699.
[25] Johannesson, K.A., 1995, Oman fish resources assessment survey. Assessment
of major marine fish stocks of demersal, small pelagic and mesopelagic
species. R/V Rastrelliger acoustic ad trawling survey results. November 1989
– November 1990. FAO/UNDP Project. (FI:DP/OMA/88/005 Technical
Report 1), Oman Resources Assessment Survey.
[26] Khalfallah, M., Zylich, K., Zeller, D., and Pauly, D., 2016, Reconstruction of
domestic marine fisheries catches for Oman (1950-2015). Frontiers in Marine
Science, 3, article 152, doi:10.3389/fmars.2016.00152.
[27] Kistler, R., Kalnay, E., Collins, W., Saha, S., White, G., Woollen, J., Chelliah,
M., Dool, W., Jenne, R., and Fiorino, M., 2001, The NCEP-NCAR 50-Year
Reanalysis: Monthly Means CD-ROM and Documentation. Bulletin of the
American Meteorological Society, 82, pp. 247-268.Seasonal and Interannual Variations of Sardine Catches along the Omani Coast 97
[28] Kripa, V.,.Kolliyil, M, Koya, K.P.S., Jeyabaskaran, R., Prema, D., Padua, S.,
Kuriakose, S., Anilkumar, P.S., Preetha, G.N., Ambrose, T.V., Dhanya, A.M.,
Abhilash, K.S, Bose, J., Divya, N.D., Shara, A.S. and Vishnu, P.G., 2018,
Overfishing and climate drives changes in biology and recruitment of the
Indian Oil Sardine Sardinella longiceps in the southern Arabian Sea. Frontiers
in Marine Science, 5: 443; doi:10.3389/fmars.2018.00443.
[29] Kripa, V., D., Prema, R., Jeyabaskaran, L. R., Khambadkar, A., Nandakumar,
P. S., Anilkumar, T., Ambrose, V., Bose, J., Preetha, G.N., and Pillai, V. N.,
2015, Inter-annual variations of selected oceanographic parameters and its
relation to fishery of small pelagics off Kochi, southwest coast of India.
Journal of Marine Biological Association of India, 57, 2, pp. 1861-1878.
[30] Kuzmenko, L.V., 2006, The phytoplankton level in the ecosystem of the
Arabian Sea. In: “The mesoscale structure of the epipelagic ecosystem of the
open northern Arabian Sea”. K.Banse and S.A.Piontkovski (Eds.), Universities
Press, Hyderabad, pp. 93-114.
[31] Latasa, M., Bidigare, R.R., 1998, A comparison of phytoplankton populations
of the Arabian Sea during the Spring Intermonsoon and Southwest Monsoon
of 1995 as described by HPLC-analyzed pigments. Deep-Sea Research, II, 45,
pp. 2133-2170.
[32] Logerwell, E., Lavaniegos, B., and Smith, P., 2001, Spatially-explicit
bioenergetics of Pacific sardine in the Southern California Bight: are
mesoscale eddies areas of exceptional prerecruit production? Progress in
Oceanography, 49, pp. 391–406.
[33] Logerwell, E., and Smith, P., 2001, Mesoscale eddies and survival of late
stage Pacific sardine (Sardinops sagax) larvae. Fisheries Oceanography, 10,
pp. 13–25.
[34] Longhurst, A. R., and Wooster, W. S., 1990, Abundance of oil sardine
(Sardinella longiceps) and upwelling on the southwest coast of India.
Canadian Journal of Fisheries and Aquatic Sciences, 47, pp. 2407-2419.
[35] Longhurst, A., 1998, Ecological geography of the sea. Academic Press, N.Y.,
398pp.
[36] Lluch-Belda, D., Crawford, R.J.M., Kawasaki, T., MacCall, A.D., Parrish,
R.H. and. Schwartzlose, R.A., 1989, Worldwide fluctuations of sardine and
anchovy stocks-the regime problem. South African Journal of Marine Science,
8, pp. 195–205.
[37] McKoy, J., Bagley, N., Gauthier, S., and Devine, J., 2009, Fish Resources of
the Arabian Sea coast of Oman: Project summary. In Technical Report 1.
Bruce Shallard and Associates. Muscat.
[38] Nair, R. , 1958, The sardines. In:“ Fisheries of the west coast of India”. S.
Jones (Ed.), Central Marine Fisheries Research Station. Mandapam, pp. 31-
37.
[39] O’Donoghue, S. H., Drapeau, L., Dudley, S.F.J., and Peddemors, V. M., 2010,
The KwaZulu-Natal sardine run: shoal distribution in relation to nearshore98 Saud M. Al Jufaili and Sergey A. Piontkovski
environmental conditions, 1997–2007. African Journal of Marine Science, 32,
pp. 293-307.
[40] Peck, M. A., Reglero, P., Takahashi, M., and Catalan, I. A., 2013, Life cycle
ecophysiology of small pelagic fish and climate-driven changes in
populations. Progress in Oceanography, 116, pp. 220-245.
[41] Piontkovski, S.A., and Banse, K., 2006, Overview of results. In: “The
mesoscale structure of the epipelagic ecosystem of the open northern Arabian
Sea”. K.Banse and S.A.Piontkovski (Eds.), Universities Press, Hyderabad, pp.
1-9.
[42] Piontkovski, S.A., Al-Oufi, H.S., and Al-Jufaili, S., 2014, Seasonal and
interannual changes of sardine landings in the Sea of Oman. Marine Fisheries
Review, 76, 3, pp. 50-59.
[43] Piontkovski, S.A, and Chiffings, T., 2014, Long-term changes of temperature
in the Sea of Oman and the western Arabian Sea. International Journal of
Oceans and Oceanography, 8, pp. 53-72.
[44] Piontkovski, S.A., Al-Tarshi, M.H., Al-Ismaili, S.M., Al-Jardani, S.S.H., and
Al-Alawi, Y.H.A., 2019, Monitoring mesoscale eddies in the western Arabian
Sea. International Journal of Oceans and Oceanography, 13, pp. 1-23.
[45] Prasad, R. P., 1953, Swarming of Noctiluca in the Palk Bay and its effect on
the “Choodai” fishery with a note on the possible use of Noctiluca as an
indicator species. Proceedings of Indian Academy of Sciences, 38, pp. 40-47.
[46] Qasim, S.Z., 1977, Biological productivity of the Indian Ocean. Indian
Journal of Marine Sciences, 6, pp. 122-137.
[47] Remya, R., Vivekanandan, E., Manjusha, U., and Nair, P. G., 2013, Seasonal
variations in the diet of the Indian oil sardine, Sardinella longiceps
Valenciennes off Cochin, Kerala. Indian Journal of Fisheries, 60, pp. 55–59.
[48] Saji, N.H., Goswami, B.N., Vinayachandran, P.N., and Yamagata, T., 1999, A
dipole mode in the tropical Indian Ocean. Nature, 401, pp. 360-363.
[49] Sajna, V.H., Zacharia, P.U., Liya, V.B., Rojith, G., Somy, K., Joseph, D., and
Grinson, G., 2019, Effect of climatic variability on the fishery of indian oil
sardine along Kerala coast. Journal of Coastal Research, S1, 86, pp. 184-192.
[50] Schwartzlose, R. A., Alheit, J., Bakun, A., Baumgartner, T. R., Cloete, R.,
Crawford,
R. J. M., Fletcher, W.J., Green-Ruiz, Y., Hangen, E., Kawasaki, T., Lluch-
Belka, D., Lluch-Cota, S.E., MacCall, A.D., Matsuura, Y., Nevárez-Martínez,
M.O., Parrish, R.H., Roy, C., Serra, R., Shust, K.V., Ward, M.N., and
Zuzunaga, J.Z., 1999, Worldwide large-scale fluctuations of sardine and
anchovy populations. South African Journal of Marine Science, 21, pp. 289–
347.
[51] Sekharan, K. V., 1966, On the food of the sardines, Sardinella albella (VAL.)
and S. gibbosa (BLEEK.) of the Mandapam area. Indian Journal of Fisheries,
13, pp. 96-141.Seasonal and Interannual Variations of Sardine Catches along the Omani Coast 99
[52] Shinoda, T., Alexander, M.A., and Hendon, H.H., 2004, Remote response of
the Indian Ocean to interannual SST variations in the tropical Pacific. Journal
of Climate, 17, pp. 362-371.
[53] Sugimoto, T., a n d Tameishi, H., 1992, Warm-core rings, streamers and
their role on the fishing ground formation around Japan. Deep-Sea Research,
Part A, 39, pp. S183-S201.
[54] Tameishi, H., Naramura, Y., and Shinomiya, H., 1994, Role of warm
streamers in the northward migration of Japanese sardine (Sardinops
melanostictus) off Sanriku (Japan). Bulletin of the Japanese Society of
Scientific Fisheries, 60, pp. 45-50.
[55] Tang, D.L., Kawamura, H., and Luis, A.J., 2002, Short-term variability of
phytoplankton blooms associated with a cold eddy in the northwestern
Arabian Sea. Remote Sensing of Environment, 81, pp. 81-89.
[56] Vivekanandan, E., Rajagopalan, M., and Pillai, N.G.K., 2009, Recent trends in
sea surface temperature and its impact on oil sardine.In: “Global Climate
Change and Indian Agriculture”. Indian Council of Agricultural Research,
New Delhi, pp. 89-92.
[57] Wada, T., and Kashiwai, M., 1991, Changes in growth and feeding ground
of Japanese sardine with fluctuation in stock abundance. In: “Long-term
variability of pelagic fish populations and their environment”, K. Kawasaki, et
al. (Eds.), Pergamon Press, N.Y., pp. 181–190.100 Saud M. Al Jufaili and Sergey A. Piontkovski
You can also read