Human costs of the first wave of the COVID-19 pandemic in the major epicentres in Italy
←
→
Page content transcription
If your browser does not render page correctly, please read the page content below
Vienna Yearbook of Population Research 2022 (Vol. 20), pp. 1–32

Human costs of the first wave of the COVID-19
pandemic in the major epicentres in Italy

Simone Ghislandi1 , Raya Muttarak2                         , Markus Sauerberg3
and Benedetta Scotti1,∗

Abstract

Deaths from COVID-19 can be miscounted due to under-reporting and inaccurate
death registration. Mortality is often reported at the national level, which can
result in the underestimation of the true scale of the impact of the pandemic since
outbreaks tend to be localised. This study exploits all-cause daily death registration
data provided by the Italian Statistical Office (ISTAT) from 1 January to 31 October
to estimate the excess mortality and the corresponding changes in life expectancy
during the first wave of the COVID-19 pandemic. Focusing on the five most severely
hit provinces in Italy (Bergamo, Brescia, Cremona, Lodi and Piacenza), we calculate
the excess mortality in 2020 compared to the average mortality of the years 2015
to 2019. Moreover, we estimate the excess mortality in the first quadrimester of
2020, and the annual life expectancy at birth. The estimated excess deaths show
that during this period, mortality was significantly higher than the official mortality
statistics for COVID-19. According to our estimates for the first quadrimester, life
expectancy in the five provinces declined by 5.4 to 8.1 for men and by 4.1 to 5.8
years for women. In addition, we find that annual life expectancy decreased by 2.4
to 4.1 years for men and by 1.9 to 2.8 years for women compared to the 2015–2019
average. Thus, we conclude that the first wave of the COVID-19 pandemic had a
substantial impact on population health in the hardest hit areas in Italy.
Keywords: COVID-19; death registration; excess mortality; first wave; Italy; life
expectancy; pandemic

1
    Department of Social and Political Sciences, Bocconi University, Milan, Italy
2
 International Institute for Applied Systems Analysis (IIASA), Wittgenstein Centre for Demography
and Global Human Capital (IIASA, OeAW, University of Vienna), Schlossplatz, Laxenburg, Austria
3
 Vienna Institute of Demography (OeAW), Wittgenstein Centre for Demography and Global Human
Capital (IIASA, OeAW, University of Vienna), Vienna, Austria
Authors are listed in alphabetical order.
∗
    Correspondence to: Benedetta Scotti, benedetta.scotti@unibocconi.it

                                                https://doi.org/10.1553/populationyearbook2022.res2.1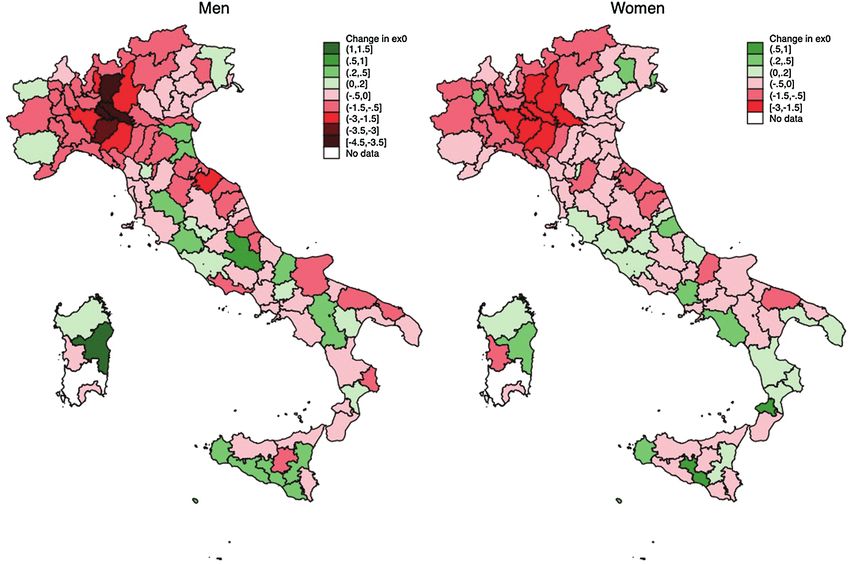
2

1 Introduction

As European countries are struggling to contain the third wave of the coronavirus
disease 2019 (COVID-19) pandemic and limit the spread of the more infectious and
deadlier new variants of the virus, governments face a difficult trade-off between
supporting the economy and protecting public health. Therefore, it is crucial that
officials understand the direct and indirect health effects of the pandemic when
making policy decisions.
   COVID-19-related mortality is one key indicator that is widely used to track the
severity and the public health effects of the pandemic. When the pandemic began
in early 2020, most of the existing literature on the impact of the pandemic relied
on case-fatality rates (CFR) as a measure of mortality (CDC COVID-19 Response
Team, 2020; Giangreco, 2020; Khafaie and Rahim, 2020; Onder et al., 2020). How-
ever, CFR are not informative for international and historical comparisons. Since
they are calculated as the number of deaths divided by the number of confirmed
cases, the absence of an accurate estimation of the infection rates in a reference
population makes the denominator in the CFR reliant on testing strategies and
capacities.
   There is no uniform way of classifying, recording and reporting COVID-19
deaths (Garcia-Basteiro et al., 2020). Moreover, when the epidemic worsens, the
counting of fatalities becomes more difficult. People who die at home or in long-
term care facilities might not be tested at all simply because resource allocation
prioritises emergency operations (Iacobucci, 2020; O’Dowd, 2020). Likewise, there
may be indirect mortality effects due to congestion in healthcare services (The
Lancet Oncology, 2020), or to patients with chronic conditions avoiding visiting
health facilities because they are concerned about the risk of COVID-19 infection
(Weinberger et al., 2020). Therefore, COVID-19 mortality reports that rely on
data on COVID-19-attributed deaths are likely to undercount the pandemic’s death
toll.
   With the release of mortality surveillance data, such as all-cause mortality
data from vital statistics systems for various countries, recent studies have used
the “excess deaths” approach to estimate the mortality burden of the COVID-19
pandemic (Rivera et al., 2020; Rossen, 2020; Stang et al., 2020; Vandoros, 2020).
Excess mortality counts the total number of persons who have died, regardless of
the cause of death, relative to the number of deaths that would have normally been
expected for a given place and time. For instance, Modi et al. (2020) compared
excess mortality data for Lombardy with the official fatality statistics for Italy, and
found that the estimated excess mortality in Lombardy between January and April
2020 was about three times higher than the COVID-19 death rate reported in the
official data. Thus, this measure allowed the authors to capture both under-reported
COVID-19-related deaths and fatalities that could be indirectly attributed to a lack
of health care access, economic deprivation or other causes.
   While excess mortality is a useful measure of the health impact of the COVID-
19 pandemic, using overall crude death rates or the proportion of deaths for
3

cross-national or historical comparisons is not very informative, because these
indicators are affected by the age distribution of the populations studied. By contrast,
life expectancy, which is calculated based on human mortality data aggregated in
life tables, is insensitive to the age structure of the population, and can therefore
reflect differences in mortality reasonably well. Against this background, this study
aims to measure the impact of the first wave of COVID-19 on life expectancy at
birth by focusing on the hardest hit areas in Italy. As Italy was the first western
country severely affected by a large COVID-19 outbreak, this approach allows
us to reasonably capture the human cost of the first wave of the COVID-19
pandemic, especially in a context in which non-pharmaceutical interventions were
delayed.
   In particular, this study focuses on specific geographical areas in Italy that were
the most severely affected by the early stages of the COVID-19 pandemic: four
provinces in Lombardy (Bergamo, Lodi, Cremona, Brescia) and one province in
Emilia Romagna (Piacenza). In modelling the spread of COVID-19 in Italy, Gatto
et al. (2020) highlighted the importance of considering the spatial nature of the
progress of the wave of infections. The selected provinces experienced the highest
numbers of excess deaths in Italy in the observation period compared to the average
mortality levels in the years 2015–2019. The highly clustered nature of local
transmission resulted in a high concentration of severe illnesses and deaths in one
area (Jia et al., 2020). Therefore, the direct impact of COVID-19 on mortality and
average life expectancy was likely felt at the sub-national level, rather than at the
national level. Indeed, our results suggest that even in Lombardy – which was the
hardest hit region in Italy during the first wave of the pandemic (Sebastiani et al.,
2020) – the reduction in life expectancy due to COVID-19 was significantly lower
than in Bergamo, the province that contributed one-third of the total excess mortality
in the Lombardy region. Thus, spatial granularity is needed to assess the full scale
of the impact of the pandemic on human life.
   Drawing on daily death registration data published by the Italian Statistical
Office (ISTAT) for the period of 1 January to 31 October 2020, the present study
compares the mortality rates in 2015–2019 and in 2020 across age and gender
categories, and provides estimates of the changes in life expectancy following the
first wave of the COVID-19 pandemic. While measures such as mortality rates are
no doubt useful, they need to be collapsed in an index that is universal enough
to provide a reliable measure of all of the human lives lost. By contrast, life
expectancy is significantly related to the overall wellbeing of the population, and
can therefore provide a simple, objective and immediate measure of the human
casualties associated with unprecedented shocks, such as the COVID-19 pandemic
(Aburto et al., 2020; Ghislandi et al., 2019; Sen, 1998). Furthermore, as reliable
measures of life expectancy are available for some countries from the 19th century
onwards, we can use life expectancy for historical comparisons of the human costs
associated with major events.
4

2 Institutional and geographical contexts of the hardest
hit areas

In the early hours of 21 February 2020, the first severe case of local transmission of
COVID-19 was diagnosed in Europe at a small hospital in Codogno, a municipality
in the province of Lodi, south-east of Milan (Paterlini, 2020). Initially, authorities
reacted by tracing the connections of patient one, but ultimately failed to identify
a patient zero. As early as 24 February 2020, 11 municipalities in the province of
Lodi were placed under strict measures to contain the spread of the disease, and
were declared a quarantine “red zone”. Meanwhile, another cluster of COVID-19
cases emerged in Alzano Lombardo and Nembro, two municipalities in the province
of Bergamo, north-east of Milan. In response to the rapid rise in the number of
detected cases, especially in the municipalities surrounding these two epicentres,
the Italian government announced on 8 March 2020 that it was imposing a (partial)
nationwide lockdown starting on 9 March, followed by a total lockdown of all
non-essential activities starting on 23 March (Galizzi and Ghislandi, 2020). While
the Italian government was praised by the World Health Organization (WHO) for
implementing such drastic measures (i.e., restrictions that had not been employed
in modern democratic nations since World War II), the virus had already been
spreading undetected in the northern part of the country since December 2019 (La
Rosa et al., 2021). Thus, it appears that these containment measures were imposed
a little too late (Signorelli et al., 2020). During this first wave of the pandemic, the
outbreak put an unprecedented burden on the Italian healthcare system, resulting in
an exceptionally high number of coronavirus deaths.
   Geographically, Lodi and Codogno – two of the 12 provinces in Lombardy – are
close to the other two provinces included in our sample: Cremona and Piacenza (see
Figures A.1 and A.2 in the Appendix for the geographical location of the provinces
being studied). The epidemic wave involving these provinces is thus considered as
part of the Lodi-Codogno cluster. Bergamo and Brescia are located north-east of
Milan, and, even though the first severe cases of COVID-19 were detected in these
provinces just one day after patient one was identified in Lodi, they experienced
a week-long delay in the arrival of the first epidemic wave (Galizzi and Ghislandi,
2020).
   Of the regions in Italy, Lombardy is the most populated, and it has the highest
Gross Domestic Product (GDP). Overall, one-sixth of the Italian population live
in Lombardy, and the region produces one-fifth of the country’s GDP. Lombardy is
relevant for our analysis, because it was the region in Italy that was hardest hit by the
COVID-19 pandemic during the first wave, accounting for almost 50% of the human
casualties in the entire country (Odone et al., 2020). Indeed, with the exception
of Piacenza (located in the Emilia Romagna region), a province that borders the
Lombardy region, all of the other four hardest hit provinces included in the analysis
are located in Lombardy. Thus, in the following, we will also present statistics for
the region of Lombardy.
5

3 Materials and methods

3.1 Data

We rely on a compendium of administrative data provided by the Italian National
Institute of Statistics (ISTAT) that covers all municipalities in Italy (7,903 as of
2020). Specifically, we combine three main datasets. First, we compile daily death
counts for all causes at the municipality level, disaggregated by sex and five-year
age classes, between 2015 and 2020. For the calendar year 2020, they cover the
period between 1 January and 31 October; while for the calendar years 2015–2019,
they cover the period between 1 January and 31 December. Second, we obtain
data on the resident population at the municipality level, disaggregated by sex and
single-year age classes, on 1 January of the years 2015–2020. We reclassify the
age classes to five-year age groups to match those used by ISTAT for daily death
counts, and aggregate the data accordingly. Third, we use data on monthly (live)
births and deaths, disaggregated by sex, at the municipality level from January 2015
to December 2019.

3.2 Estimation procedure for excess mortality

Excess mortality is measured in any day t of 2020 as the difference between the
observed and the expected number of deaths in 2020 in t. The expected number of
deaths in t is defined as the average number of deaths observed in t over the period
2015–2019:
                                                                 expected
                   excess
                n Dx      (t2020 )   = n Dobserved
                                          x        (t2020 ) − n D x         (t2020 )   (1)

with
                           expected   1X
                        n Dx        (t2020 )   =
                                            n D x (t2015–2019 )               (2)
                                      5
where the number of deaths in the age interval x to x + n at time t is defined as
n D x (t).

3.3 Estimate procedures for life expectancy

Life expectancy is calculated for two different reference periods: the life expectancy
for the first quadrimester (i.e., life expectancy for the first four months of the year),
and the period (annual) life expectancy (i.e., life expectancy for the entire calendar
year).
   Since the excess mortality wave was over by the end of April in all of
the provinces (Blangiardo et al., 2020), we calculate the first quadrimester life
expectancy for the period of 1 January to 30 April for the years 2015–2020
(for men and women separately). To do so, we calculate the first quadrimester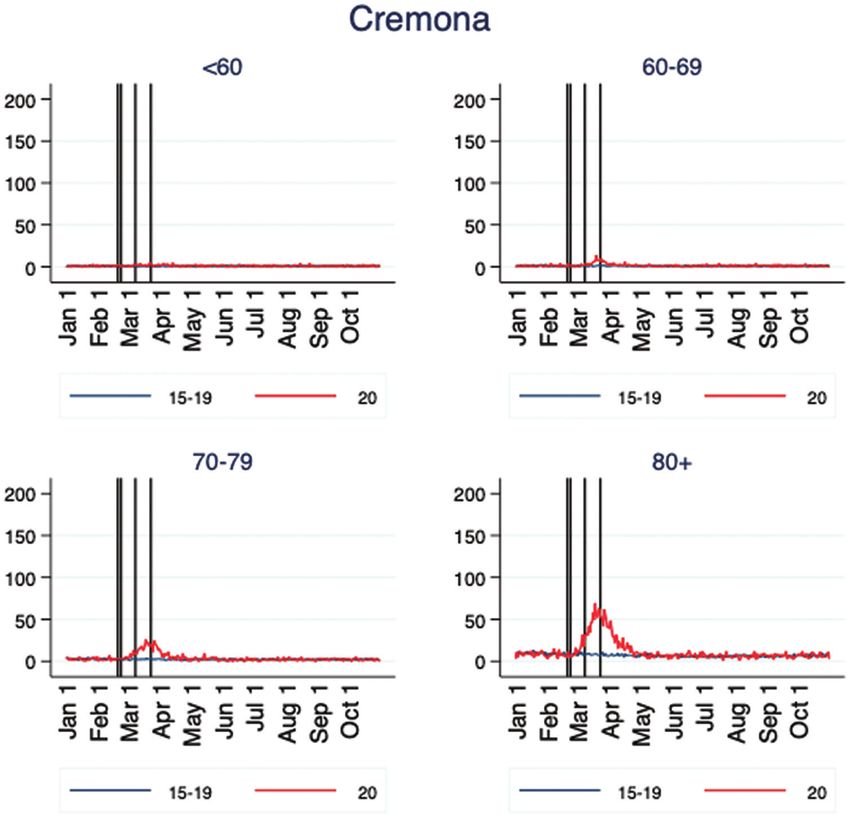
6

age- and sex-specific mortality rates for each year. We aggregate the daily death
counts (the numerators) over the period of 1 January to 30 April at the provincial
level (and at the regional level for Lombardy). The corresponding exposures (i.e.,
the denominators) are estimated as follows. Starting from the estimated resident
population on 1 January, we count the age-specific person-days up to 30 April of
each year. Theoretically, these counts are a function of four demographic events:
namely, births, ageing, migration and deaths. The daily inflow of births is estimated
by using monthly birth data, and assuming that these births are uniformly distributed
throughout the month. Since the monthly births for 2020 are not available, we
estimate monthly births over 2020 in each province by sex by means of linear
extrapolation using province-specific data on monthly live births by sex between
January 2015 and December 2019. The effect of ageing – i.e., individuals might
be in transition into and out of a given age interval – is modelled by giving each
individual the probability of 1/365 of turning one year older during the observation
period. The outflows due to deaths are straightforward, as the age-specific death
counts are known on a daily basis. We assume no migration.1 Formally, the exposed
population at day t in age group x in province p is given by the population alive at
day t − 1 in age group x in province p plus those who age into age group x at day t
minus those who either die in age group x or age out of the age group x in day t in
province p:
                       p           p                 p          p             p
                   n E x (t)   = P x (t − 1) + n Ageinx (t) − D x (t) − n Ageoutx (t)                (3)

We express the obtained daily exposure values in terms of person-years by multi-
plying them by 1/365 (1/366 for leap years). Then, we derive age-specific mortality
                                                            p          p
rates for the period of 1 January to 30 April by dividing D x (t) by E x (t). Finally, life
tables are built following the standard procedures outlined by the Human Mortality
Database protocol (Wilmoth et al., 2019).
   While first quadrimester life expectancy does not require any assumptions and
relies entirely on observed data, annual life expectancy needs assumptions on
mortality trends for the rest of the year 2020 after 31 October when the available
ISTAT data on all-cause mortality at the municipality level end. Given the timing
of the second wave, which hit Italy in mid-October 2020, harvesting (i.e., the
reduction in mortality rates following peak mortality associated with shock events)
can be excluded. Thus, we assume that in November and December 2020, mortality
returned to the average levels recorded in 2015–2019. It should be noted that this
is a conservative approach, since the mortality levels in November and December
are expected to be higher than in 2015–2019 due to the unfolding of the second
epidemic wave. As we do not know the daily distribution of deaths after 31

1
   The no-migration assumption is fairly realistic. Due to the travel restrictions to and from Italy, and
also within the country, it may be expected that migration flows declined. Indeed, the existing data
suggest that labour migration as well as refugee admissions were far lower in 2020 than in 2019 (EASO,
2020; EMN/OECD, 2020; OECD, 2020).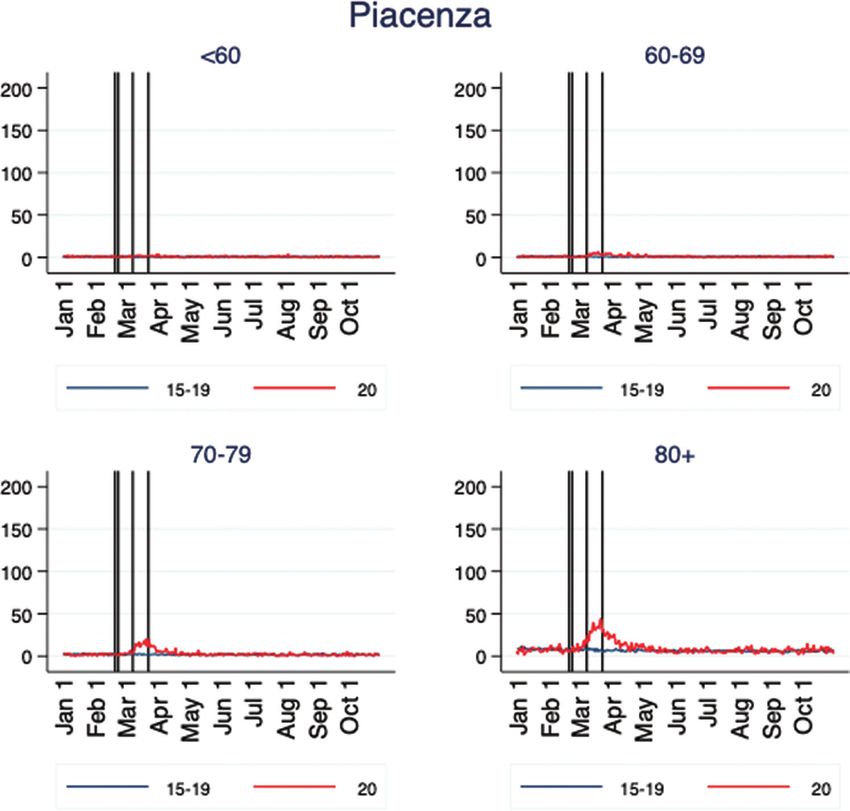
7
October, we assume that the deaths were distributed uniformly across November
and December 2020.
We then proceed with the estimation of population exposure for each day between
1 January and 31 December 2020 following the same procedure detailed above
(sex- and age-specific population estimates by province are reported in Table A.1).
Finally, we aggregate the death counts and population exposure values over the
entire year to derive the age-specific mortality rates and life expectancies under both
scenarios. For the calendar years 2015–2019, we compute the age-specific mortality
rates by dividing the total annual death counts over the mid-year population, and
derive the life expectancies accordingly.
We estimate confidence intervals for both the first quadrimester and the annual life
expectancies by bootstrapping using Monte Carlo simulation methods, assuming the
death counts follow a binomial distribution (Andreev and Shkolnikov, 2010; Chiang,
1984).
4 Results
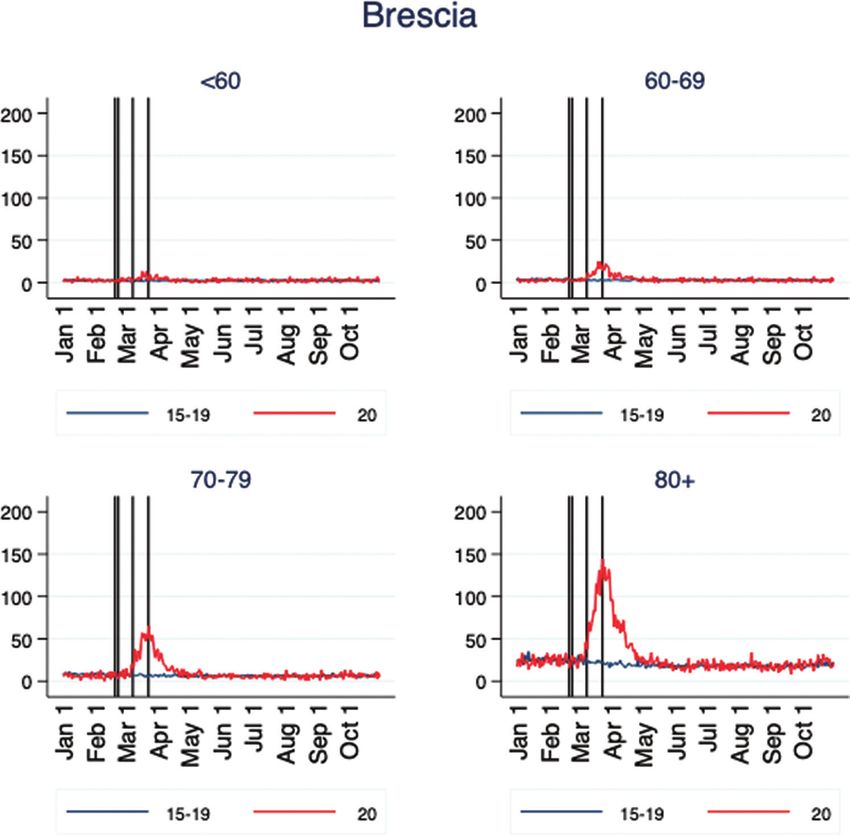
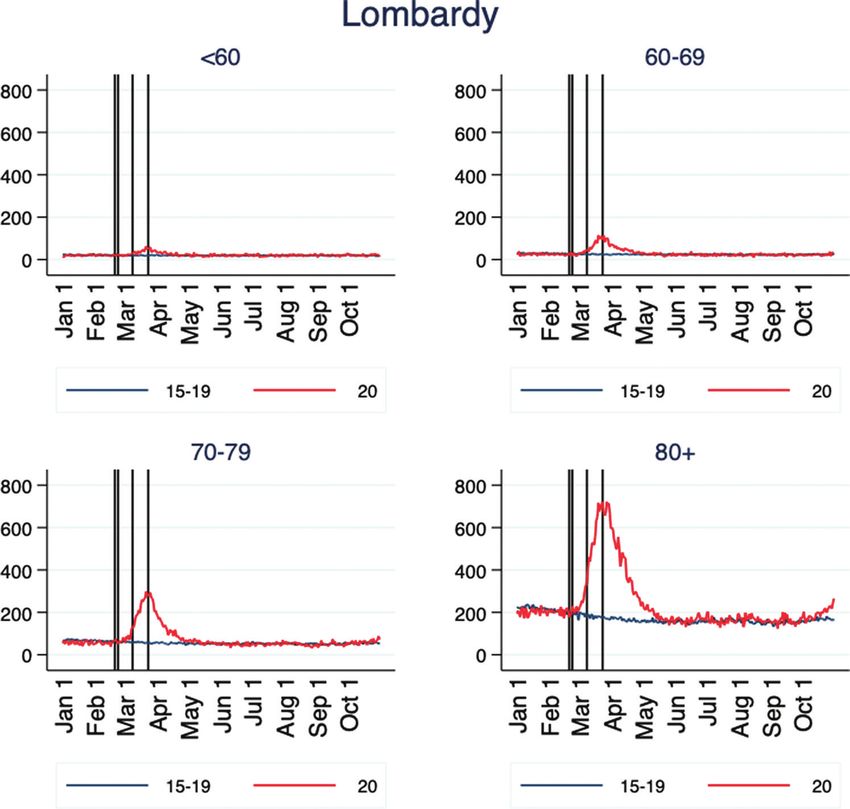
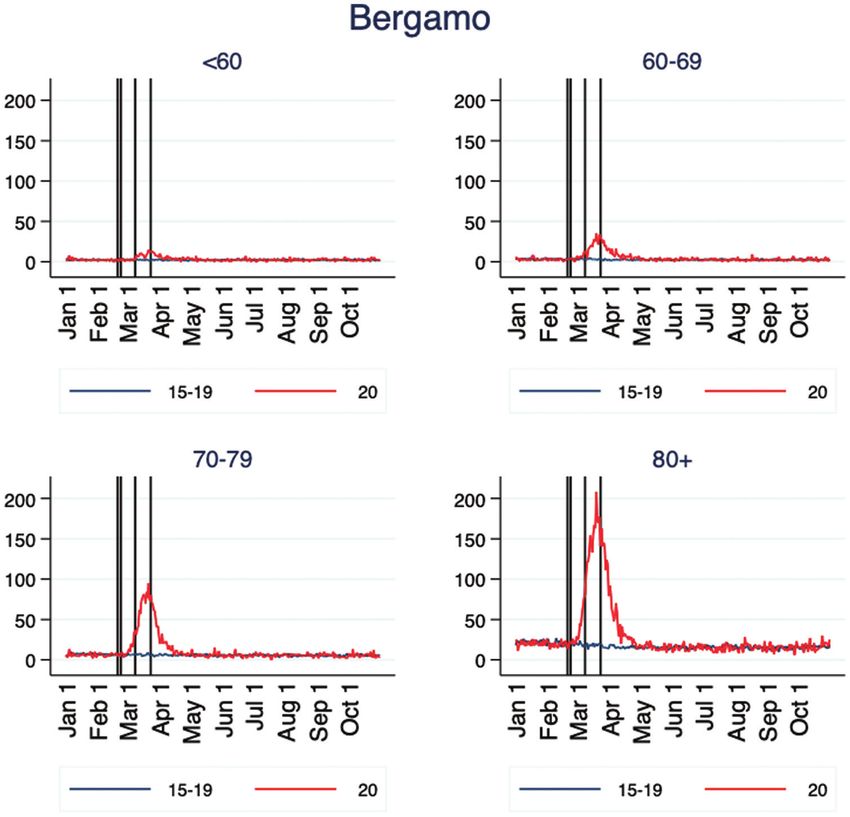
Figures 1(a)–1(f) show the trends in daily mortality for the five provinces with the
highest numbers of declared cases in Italy and in the whole Lombardy region.2
Plotting the mortality distribution by age groups allows us to fully capture the
progression of the first epidemic wave. It is evident that the epidemic curve inflated
with age across all provinces. It is also clear that by 30 April, the daily mortality
in all selected provinces approached the pre-pandemic values (i.e., no excess
mortality). Hence, the wavelength of the epidemic in these provinces was between
six and eight weeks, with the peak happening around two weeks after the onset of
the outbreak.
The vertical lines show four relevant dates for the evolution of the first epidemic
wave. After the case of patient one was first identified in Codogno, located in the
province of Lodi, the authorities quickly locked down 11 municipalities in the area
on 24 February 2020. The containment measures associated with the lockdown
were not implemented in other provinces until after 8 March. Although the earlier
lockdown enabled Lodi to flatten the curve more effectively than other severely
affected provinces (Figure 1), the province still experienced a notable increase in
excess mortality. Considering that the incubation period – i.e., the time between the
exposure and the onset of symptoms – can be up to 24 days, it is evident that the
lockdown was imposed too late in these provinces. While political reasons prevented
the authorities from implementing the lockdown earlier in the provinces where the
number of cases had been rising rapidly, like in Bergamo, there is recent evidence
showing that COVID-19 had already been circulating undetected in northern Italy
2
All figures for the Lombardy region cover all 12 provinces in the region.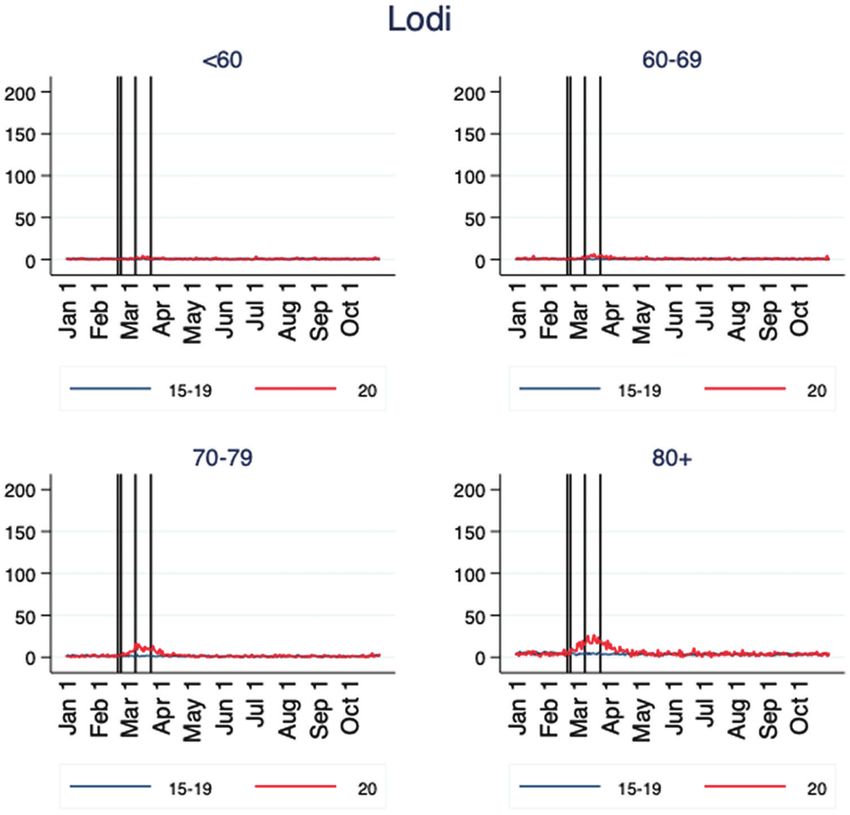
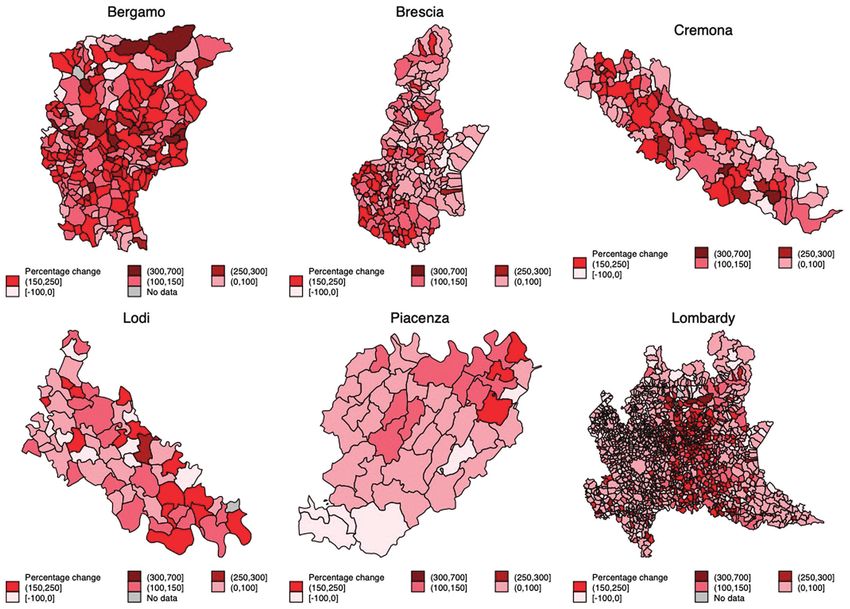
8

Figure 1(a):
Trends in total daily death counts in the province of Bergamo January 1 and October
31 2020 vs. 2015–2019 average

Note: The vertical lines show relevant dates for the evolution of the epidemic. The vertical lines indicate the
following relevant days: 20 February = patient one found in Codogno; 23 February = red zones in Codogno.
Schools and Universities in affected regions are closed; 8 March = orange zones were established in Lombardy and
Piacenza; 23 March = all non-essential economic activities were closed.

since December 2019 (La Rosa et al., 2021). Thus, our study proxies the impact of
the COVID-19 outbreak in the absence of containment interventions.
   The geographical distribution of excess deaths in the first quadrimester across
Italy (Figure 2) matches the distribution of confirmed cases (which comprise the
deceased, the recovered individuals and the active cases) provided by the Italian
Civil Protection Department, which publishes the official surveillance data on
COVID-19.3 This geographical pattern indicates that the excess mortality observed
in our data represents mortality directly and indirectly related to COVID-19.
   Note that in Figure 2, we focus on the 1 January-30 April period only in order to
better capture the impact of the first wave of the COVID-19 pandemic. Compared
to the average number of people who died in the same period in the previous
five years (2015–2019), the excess number of deaths (for those aged 40 or older)

3
   Official statistics on COVID-19 cases and deaths provided by the Italian Civil Protection Department
are available at http://www.protezionecivile.gov.it/home (Situation Map).
9

Figure 1(b):
Trends in total daily death counts in the province of Brescia January 1 and October
31 2020 vs 2015–2019 average

Notes: The vertical lines show relevant dates for the evolution of the epidemic. The vertical lines indicate the
following relevant days: 20 February = patient one found in Codogno; 23 February = red zones in Codogno. Schools
and Universities in affected regions are closed; 8 March = orange zones were established in Lombardy and Piacenza;
23 March = all non-essential economic activities were closed.

between 1 January and 30 April 2020 sums to 6,084 in Bergamo, 3,969 in Brescia,
2,030 in Cremona, 905 in Lodi and 1,170 in Piacenza. For the entire region of
Lombardy, the excess number of deaths is approximately 23,649 (Table 1). The total
number of COVID-19 deaths reported by the Italian Civil Protection Department
for Lombardy as of 30 April 2020 is 13,772. This implies that the overall death
toll of the first epidemic wave was about 70% higher than that suggested by official
statistics on COVID-19 deaths. The mortality rate in the first quadrimester of 2020
increased substantially in all provinces and for all age groups, with the largest
increase being observed for men aged 70–79 in Bergamo (a 347% increase). Age
clearly represented a risk factor for excess mortality, in line with the age gradient
in COVID-19 CFR observed in Italy and elsewhere. For instance, among the excess
deaths observed in Bergamo, the mortality rate was much higher among older men
aged ≥70 years. A similar ratio is found in the other provinces.
   When we only consider the distribution of excess mortality without adjusting for
population size in each age-sex category, we observe slightly more excess mortality
10

Figure 1(c):
Trends in total daily death counts in the province of Cremona January 1 and October
31 2020 vs. 2015–2019 average

Notes: The vertical lines show relevant dates for the evolution of the epidemic. The vertical lines indicate the
following relevant days: 20 February = patient one found in Codogno; 23 February = red zones in Codogno. Schools
and Universities in affected regions are closed; 8 March = orange zones were established in Lombardy and Piacenza;
23 March = all non-essential economic activities were closed.

in men than in women (53% of excess deaths involved male subjects). However,
when we consider the mortality risk ratio between the sexes, we find that the excess
mortality for males was consistently higher than that for females across all age
groups and provinces (relative risk ≥1).
   The trends in the first quadrimester and the annual life expectancies are illustrated
in Figures 3 and 4. When we look at the trends in the first quadrimester of 2020,
it is evident that the drop in life expectancy was significant for both men and
women in all provinces. Compared to the average life expectancy of the 2015–
2019 period, the reduction for men ranged from 5.5 years in Brescia to 8.1 years
in Bergamo, and the reduction for women ranged from 4.1 years in Piacenza to 5.8
years in Bergamo. The larger reduction in the first quadrimester life expectancy for
men was due to sex differentials in the COVID-19 mortality risk, as both the official
case fatality data and our death registration data consistently show. Indeed, when we
decompose the loss in life expectancy to identify which age groups contributed the
most to the reduction in life expectancy (Figure A.3 in Appendix), it becomes clear
11

Figure 1(d):
Trends in total daily death counts in the province of Piacenza January 1 and October
31 2020 vs 2015–2019 average

Notes: The vertical lines show relevant dates for the evolution of the epidemic. The vertical lines indicate the
following relevant days: 20 February = patient one found in Codogno; 23 February = red zones in Codogno. Schools
and Universities in affected regions are closed; 8 March = orange zones were established in Lombardy and Piacenza;
23 March = all non-essential economic activities were closed.

that the older populations, and especially men aged 60–79 years, played a major
role.
   When life expectancy is extrapolated for the whole year, the loss in life expectancy
is diluted over a longer period. Thus, the drop in life expectancy due to COVID-19-
related excess mortality was less steep than that observed in the first quadrimester
life expectancy.
   In the most severely hit province of Bergamo, life expectancy dropped by 4.1
years for men and 2.8 years for women when compared to life expectancy for the
years 2015–2019. In the slightly less affected provinces of Brescia, Cremona, Lodi
and Piacenza, the reduction in life expectancy ranged between 2.4 in Brescia and 3.8
in Cremona for men, and between 1.9 in Piacenza and 2.6 in Cremona for women.
As expected, the reduction in life expectancy was smaller in Lombardy, at 1.9 years
for males and 1.5 years for females.
   When we turn to the national level, we see that the results are extremely
heterogeneous (Figure 5). It is evident that the higher excess mortality experienced
in the northern part of Italy, particularly in Lombardy, was not experienced in most
12

Figure 1(e):
Trends in total daily death counts in the province of Lodi January 1 and October 31
2020 vs. 2015–2019 average

Notes: The vertical lines show relevant dates for the evolution of the epidemic. The vertical lines indicate the
following relevant days: 20 February = patient one found in Codogno; 23 February = red zones in Codogno. Schools
and Universities in affected regions are closed; 8 March = orange zones were established in Lombardy and Piacenza;
23 March = all non-essential economic activities were closed.

of the provinces of the central part and the south of the country. For example,
in provinces like Sassari and Nuoro in Sardegna and Cosenza in Calabria, the
lockdown reduced mortality in the first four months of the year, resulting in an
estimated increase in life expectancy up to two years for both men and women.

5 Discussion

By avoiding the inconsistencies in the classification of causes of death and in testing
practices, and by focusing on the five areas in Italy that were most severely affected
by the first wave of the pandemic, this study provided an assessment of the full
impact of the first wave of the COVID-19 pandemic on human life.
  Two empirical regularities clearly emerged when we looked at demographic
differentials. First, the age gradient in excess mortality was steep, and age was the
most evident risk factor for COVID-19 mortality. In Lombardy, men and women
13

Figure 1(f):
Trends in total daily death counts in the region of Lombardy January 1 and October
31 2020 vs. 2015–2019 average

Notes: The vertical lines show relevant dates for the evolution of the epidemic. The vertical lines indicate the
following relevant days: 20 February = patient one found in Codogno; 23 February = red zones in Codogno. Schools
and Universities in affected regions are closed; 8 March = orange zones were established in Lombardy and Piacenza;
23 March = all non-essential economic activities were closed.

over age 70 were 23 times more likely to die than their counterparts under age 70.
These patterns were replicated in all five provinces. Therefore, areas where older
people made up a high proportion of the population (e.g., 17% of the population
were over age 70 in the Lombardy region in 2019) had a higher burden of COVID-
19 mortality (Dowd et al., 2020). Second, within each province, the risk of dying
was consistently higher for men than for women for all age classes and provinces
considered. Evidence that men are more likely than women to suffer from COVID-
19, as measured by hospitalisations, admissions to intensive care units and fatality
rates, has been consistently reported for other countries across different studies
and subsamples (Gebhard et al., 2020; Peckham et al., 2020; Scully et al., 2020).
Higher mortality rates for men than for women translate into a larger reduction in
life expectancy for men than for women.
   Although these data provided evidence of the severity of the first wave of
the COVID-19 pandemic in Europe, a further measurement effort was needed,
particularly for geographical and historical comparability purposes. In terms of
life expectancy, we showed that for the period of 1 January to 30 April 2020, the
14

reduction in the first quadrimester life expectancy, compared with the average of
the years 2015–2019, was as high as 8.1 years for men and 5.8 years for women in
Bergamo.
   When the analysis was extended to the whole year, under the assumption that the
mortality rates from November onwards were back to “normal”, life expectancy
was reduced by up to four years (for men in Bergamo). However, significant
uncertainties remain about the longer-term effects of the pandemic on health
conditions among, for instance, patients who recovered from COVID-19 with major
co-morbidities and mental health issues, and pregnant women. It is also possible
that indirect physical and mental health consequences of changing socio-economic
conditions affected the mortality patterns in 2020.
   What can we say regarding the validity of the no harvesting assumption? Figure 1
provides evidence that after the end of the first wave, the mortality patterns in all
age-provinces groups were largely similar to those in the previous years. This result
is not consistent with harvesting, which would require negative excess mortality
to compensate for the high levels of mortality registered in the first quadrimester. It
should also be noted that since November 2020, Italy has been experiencing a severe
second wave of infections that has not fully finished. Moreover, since March 2021,
the country has been bracing for a third wave. Therefore, mortality in Italy is likely
to increase even further. Thus, the figures provided can be considered estimates of
the human life lost only for the first wave of the COVID-19 epidemic in the affected
provinces.
   It should also be noted that in the first quadrimester, some provinces in Italy
experienced an improvement in life expectancy thanks to a reduction in mortality
compared to the average of the previous years. There may have been spill-over
benefits of the lockdown measures that contributed to a decline in premature deaths,
such as from road traffic fatalities, alcohol consumption, violence and injuries at
work (Qi et al., 2020; Qureshi et al., 2020). Moreover, our observation that the
epidemic had a differential impact across different regions within Italy shows the
importance of considering specific geographic areas when estimating the effect of
the COVID-19 pandemic on human life. Indeed, focusing on national-level statistics
only would further bias downward the estimation of the impact of the virus. Thus,
our explicit focus on a local context can be considered the main strength of this
analysis. Because the COVID-19 outbreaks have been geographically concentrated,
looking at country-level life expectancy is misleading, and underestimates the actual
impact of the pandemic.
   Along with Italy, other European countries have been experiencing sharp
declines in life expectancy due to the COVID-19 pandemic. Estimating weekly life
expectancy for Spain, Trias-Llimós et al. (2020) found a particularly large drop at
the beginning of April 2020, with a decline of up to 7.6 years at the national level.
At the regional level, the authors reported an even more pronounced drop in life
expectancy, with Madrid in particular experiencing a large reduction, ranging from
11.2 years in week 13 to 14.8 years in week 14 for both men and women. Moreover,
the findings of a study for Sweden based on mortality data for the first 33 weeks
Figure 2:
Excess mortality between January 1 and April 30 2020 by municipalities in selected provinces and in Lombardy

Notes: The maps plot the percentages change in total number of deaths recorded between 1 January and 30 April 2020 with respect to the 2015–2019 average.
                                                                                                                                                            15
16
Table 1:
Total population as of January 1 2020, excess mortality and male to female relative risk (RR) for selected provinces and
Lombardy region, by age and sex (1 January–30 April 2020)
Population Population Excess deaths Excess deaths Increase MR Increase MR
Age males females males females Males Females RR
BERGAMO
40–49 87798 83447 18 11 1.419 1.418 1.555
50–59 90465 87550 130 41 2.230 1.586 3.069
60–69 65932 67646 456 123 2.910 1.967 3.804
70–79 48938 55601 1109 473 3.399 2.465 2.664
80–89 23213 35807 1398 1088 2.936 2.329 1.982
90+ 2878 8995 391 846 2.623 2.233 1.444
BRESCIA
40–49 100560 96071 6 2 1.148 1.104 2.866
50–59 100949 98976 81 31 1.748 1.427 2.562
60–69 72690 76000 241 76 1.909 1.558 3.315
70–79 56544 64688 728 304 2.364 1.858 2.740
80–89 27054 42900 934 757 2.085 1.800 1.956
90+ 3575 11875 277 809 1.804 1.926 1.137
CREMONA
40–49 27269 26207 7 6 1.539 1.906 1.121
50–59 28706 28163 42 5 2.241 1.192 8.241
60–69 22333 23107 109 27 2.349 1.569 4.177
70–79 17463 19921 336 136 2.804 2.092 2.818
80–89 8941 14449 388 411 2.346 2.162 1.526
90+ 1278 4068 168 395 2.475 2.249 1.354
ContinuedTable 1:
Continued
Population Population Excess deaths Excess deaths Increase MR Increase MR
Age males females males females Males Females RR
LODI
40–49 18554 17694 4 1 1.431 1.232 3.815
50–59 18757 18214 20 0 1.837 0.974
60–69 13548 14073 73 23 2.485 1.859 3.297
70–79 10264 11802 215 76 2.967 1.983 3.253
80–89 4770 7890 184 131 2.128 1.667 2.323
90+ 587 1940 34 148 1.549 1.988 0.759
PIACENZA
40–49 21381 21089 3 −5 1.363 0.293 −0.592
50–59 22926 22790 29 7 2.001 1.370 4.118
60–69 17373 18099 83 16 2.377 1.416 5.404
70-79 14041 16290 207 99 2.367 2.093 2.426
80–89 7945 12234 275 185 2.063 1.595 2.289
90+ 1258 3598 78 193 1.656 1.695 1.156
LOMBARDY
40–49 734989 715954 69 34 1.200 1.167 1.977
50–59 711601 716834 440 94 1.535 1.176 4.715
60–69 518652 560324 1312 400 1.705 1.377 3.544
70-79 414020 494374 3609 1560 1.906 1.565 2.762
80–89 205659 331869 5338 4592 1.891 1.652 1.876
90+ 27458 85968 1835 4366 1.814 1.718 1.316
Notes: Excess deaths: (Number of deaths 1 January-30 April 2020) – (Average number of deaths 1 January 1–30 April 2015–2019). RR(M/F): Risk Ratio (Male/Female) =
(excess deaths males/pop males)/(excess deaths females/pop females).
1718
Figure 3:
Estimates of the first quadrimester (1 January–April 30) by sex in selected provinces
and in Lombardy (95% confidence intervals in grey)
Life expectancy at birth
Calendar year Life expectancy at birth Calendar year
Life expectancy at birth
Life expectancy at birth
Calendar year Calendar year
Life expectancy at birth
Life expectancy at birth
Calendar year Calendar year
Notes: Confidence intervals (95%) for life expectancies are estimated by bootstrapping using Monte Carlo simulation
methods, assuming death counts follow a binomial distribution.
of the pandemic suggest that life expectancy at age 50 in Stockholm decreased
by about two years for men and about 1.5 years for women (Modig et al., 2021).
At the national level, the reduction in annual life expectancy during the COVID-19
pandemic is expected to be smaller. Similarly, a study that calculated life expectancy
at birth in England and Wales on the basis of data for the first 47 weeks of the19
Figure 4:
Estimates of the annual life expectancies by sex in selected provinces of Lombardy
and in the Lombardy region as a whole (95% confidence intervals in grey)
Life expectancy at birth
Calendar year Life expectancy at birth Calendar year
Life expectancy at birth
Life expectancy at birth
Calendar year Calendar year
Life expectancy at birth
Life expectancy at birth
Calendar year Calendar year
Notes: Confidence intervals (95%) for life expectancies are estimated by bootstrapping using Monte Carlo simulation
methods, assuming death counts follow a binomial distribution.
pandemic found that it declined by 0.9 years for women and 1.2 years for men
between 2019 and 2020 (Aburto et al., 2021). Our results are in line with those of
these previous studies, as we also found the largest declines in life expectancy at a
local level; in our case, in the north of Italy.20 Figure 5: Differences between life expectancy at birth (ex0) in 2020 in Italian provinces and 2015–2019 average, by sex Under normal conditions, life expectancy at birth is calculated with mortality data for one calendar year, and provides an estimate of mean longevity for a hypothetical group of individuals who experience the mortality regime of a given period over their entire life course. Obviously, in reality, no group of people will be exposed over their life course to the mortality regime of the worst hit regions in Italy during the first wave of the COVID-19 pandemic. With the development, approval and rollout of several vaccines and the implementation of protective measures, it is highly likely that in the future, mortality in these regions will bounce back to lower levels. Still, life expectancy is a powerful tool for summarising and comparing mortality rates between regions and over time, especially because it accounts for differences in age-specific mortality (Marois et al., 2020; Trias-Llimós et al., 2020). As the results of this study show, the cost in terms of human life of the delays in public interventions to reduce the transmission of the virus was disturbingly high. As European countries struggle to manage the successive waves of the coronavirus by striking a balance between protecting public health and reducing the economic effects of restriction measures, it is important to keep in mind the potential risk of viral reintroduction, and the direct and indirect dangers it poses to human life. Well-planned government measures aimed at flattening the epidemic curve while
21

preventing a new wave of infections, along with public cooperation in maintaining
physical distancing, wearing a face mask and practicing proper hygiene until there
is widespread access to vaccination for the novel coronavirus, are key to achieving
a balance between protecting public health and sustaining the economy.

Author contributions

SG and BS designed the research; BS acquired data, performed the analysis and
created the display items with the help of MS. SG, RM, MS and BS contributed to
the writing of the manuscript.

ORCID

Simone Ghislandi         https://orcid.org/0000-0003-2335-7304
Raya Muttarak        https://orcid.org/0000-0003-0627-4451
Markus Sauerberg         https://orcid.org/0000-0001-9524-446X
Benedetta Scotti       https://orcid.org/0000-0001-5528-3659

References
Aburto, J. M., Kashyap, R., Schöley, J., Angus, C., Ermisch, J., Mills, M. C., and Dowd, J. B.
   (2021). Estimating the burden of the COVID-19 pandemic on mortality, life expectancy
   and lifespan inequality in England and Wales: A population-level analysis. Journal of
   Epidemiology and Community Health. https://doi.org/10.1136/jech-2020-215505
Aburto, J. M., Villavicencio, F., Basellini, U., Kjærgaard, S., and Vaupel, J. W. (2020).
   Dynamics of life expectancy and life span equality. Proceedings of the National Academy
   of Sciences, 117(10), 5250–5259. https://doi.org/10.1073/pnas.1915884117
Andreev, E. M., and Shkolnikov, V. (2010). Spreadsheet for calculation of confidence limits
   for any life table or healthy-life table quantity (MPIDR Technical Report 2010-005). Max
   Planck Institute for Demographic Research. https://doi.org/10.4054/MPIDR-TR-2010-
   005
Blangiardo, M., Cameletti, M., Pirani, M., Corsetti, G., Battaglini, M., and Baio, G. (2020).
   Estimating weekly excess mortality at sub-national level in Italy during the COVID-19
   pandemic. PLOS ONE, 15(10), Article e0240286. https://doi.org/10.1371/journal.pone.
   0240286
CDC COVID-19 Response Team. (2020). Severe outcomes among patients with Coronavirus
   disease 2019 (COVID-19)—United States, February 12-March 16, 2020. MMWR.
  Morbidity and Mortality Weekly Report, 69(12), 343–346. https://doi.org/10.15585/mmwr.
   mm6912e2
22

Chiang, C. L. (1984). The life table and its applications (Original ed.). Krieger Publishing
   Company.
Dowd, J. B., Andriano, L., Brazel, D. M., Rotondi, V., Block, P., Ding, X., Liu, Y., and Mills,
   M. C. (2020). Demographic science aids in understanding the spread and fatality rates
   of COVID-19. Proceedings of the National Academy of Sciences, 117(18), 9696–9698.
   https://doi.org/10.1073/pnas.2004911117
EASO. (2020). Asylum applications remain 31% lower than in 2019. European Asylum
   Support Office. https://www.easo.europa.eu/news-events/asylum-applications-remain-31-
   lower-2019
EMN/OECD. (2020). Impact of COVID-19 on remittances in EU and OECD countries –
   EMN-OECD Inform. European Migration Network. https://ec.europa.eu/home-affairs/
   sites/homeaffairs/files/docs/pages/00 eu inform4 remittances 2020 en 0.pdf
Galizzi, M. M., and Ghislandi, S. (2020). Bergamo’s response to the coronavirus pandemic.
   Cambridge Core Blog, 18 April, 2020. https://www.cambridge.org/core/blog/2020/04/18/
   bergamos-response-to-the-coronavirus-pandemic/
Garcı́a-Basteiro, A. L., Chaccour, C., Guinovart, C., Llupià, A., Brew, J., Trilla, A., and
   Plasencia, A. (2020). Monitoring the COVID-19 epidemic in the context of widespread
   local transmission. The Lancet Respiratory Medicine, 8(5), 440-442. https://doi.org/10.
   1016/S2213-2600(20)30162-4
Gatto, M., Bertuzzo, E., Mari, L., Miccoli, S., Carraro, L., Casagrandi, R., and Rinaldo, A.
   (2020). Spread and dynamics of the COVID-19 epidemic in Italy: Effects of emergency
   containment measures. Proceedings of the National Academy of Sciences, 117(19), 10484–
   10491. https://doi.org/10.1073/pnas.2004978117
Gebhard, C., Regitz-Zagrosek, V., Neuhauser, H. K., Morgan, R., and Klein, S. L. (2020).
   Impact of sex and gender on COVID-19 outcomes in Europe. Biology of Sex Differences,
   11(1), 29. https://doi.org/10.1186/s13293-020-00304-9
Ghislandi, S., Sanderson, W. C., and Scherbov, S. (2019). A simple measure of human
   development: The Human Life Indicator. Population and Development Review, 45(1),
   219–233. https://doi.org/10.1111/padr.12205
Giangreco, G. (2020). Case fatality rate analysis of Italian COVID-19 outbreak. Journal of
   Medical Virology, 92(7), 919–923. https://doi.org/10.1002/jmv.25894
Iacobucci, G. (2020). Covid-19: Care home deaths in England and Wales double in four
   weeks. BMJ, 369, Article m1612. https://doi.org/10.1136/bmj.m1612
Jia, J., Hu, X., Yang, F., Song, X., Dong, L., Zhang, J., Jiang, F., and Gao, R. (2020).
   Epidemiological characteristics on the clustering nature of COVID-19 in Qingdao City,
   2020: A descriptive analysis. Disaster Medicine and Public Health Preparedness, 14(5),
   643–647. https://doi.org/10.1017/dmp.2020.59
Khafaie, M. A., and Rahim, F. (2020). Cross-country comparison of case fatality rates of
   COVID-19/SARS-COV-2. Osong Public Health and Research Perspectives, 11(2), 74–80.
   https://doi.org/10.24171/j.phrp.2020.11.2.03
La Rosa, G., Mancini, P., Bonanno Ferraro, G., Veneri, C., Iaconelli, M., Bonadonna, L.,
   Lucentini, L., and Suffredini, E. (2021). SARS-CoV-2 has been circulating in northern
   Italy since December 2019: Evidence from environmental monitoring. Science of the
   Total Environment, 750, Article 141711. https://doi.org/10.1016/j.scitotenv.2020.141711
23

Marois, G., Muttarak, R., and Scherbov, S. (2020). Assessing the potential impact of COVID-
  19 on life expectancy. PLoS ONE, 15(9), Article e0238678. https://doi.org/10.1371/journal.
   pone.0238678
Modi, C., Böhm, V., Ferraro, S., Stein, G., and Seljak, U. (2020). How deadly is COVID-19?
   A rigorous analysis of excess mortality and age-dependent fatality rates in Italy. MedRxiv.
   https://doi.org/10.1101/2020.04.15.20067074
Modig, K., Ahlbom, A., and Ebeling, M. (2021). Excess mortality from COVID-19: Weekly
   excess death rates by age and sex for Sweden and its most affected region. European
   Journal of Public Health, 31(1), 17–22. https://doi.org/10.1093/eurpub/ckaa218
Odone, A., Delmonte, D., Scognamiglio, T., and Signorelli, C. (2020). COVID-19 deaths
   in Lombardy, Italy: Data in context. The Lancet Public Health, 5(6): Article E310.
   https://doi.org/10.1016/S2468-2667(20)30099-2
O’Dowd, A. (2020). Covid-19: Care home deaths in England and Wales rise sharply. BMJ,
   369, Article m1727. https://doi.org/10.1136/bmj.m1727
OECD. (2020). International migration outlook 2020. OECD Publishing. https://doi.org/10.
  1787/ec98f531-en
Onder, G., Rezza, G., and Brusaferro, S. (2020). Case-fatality rate and characteristics of
   patients dying in relation to COVID-19 in Italy. JAMA 313(18), 1775–1776. https://doi.
   org/10.1001/jama.2020.4683
Paterlini, M. (2020). On the front lines of coronavirus: The Italian response to Covid-19.
   BMJ, 368, Article m1065. https://doi.org/10.1136/bmj.m1065
Peckham, H., de Gruijter, N. M., Raine, C., Radziszewska, A., Ciurtin, C., Wedderburn, L. R.,
   Rosser, E. C., Webb, K., and Deakin, C. T. (2020). Male sex identified by global COVID-
  19 meta-analysis as a risk factor for death and ITU admission. Nature Communications,
  11(1), Article 6317. https://doi.org/10.1038/s41467-020-19741-6
Qi, J., Zhang, D., Zhang, X., Yin, P., Liu, J., Pan, Y., Takana, T., Xie, P., Wang, Z., Liu, S.,
   Gao, G. F., He, G., and Zhou, M. (2020). Do lockdowns bring about additional mortality
   benefits or costs? Evidence based on death records from 300 million Chinese people.
   MedRxiv. https://doi.org/10.1101/2020.08.28.20183699
Qureshi, A. I., Huang, W., Khan, S., Lobanova, I., Siddiq, F., Gomez, C. R., and Suri, M. F. K.
   (2020). Mandated societal lockdown and road traffic accidents. Accident; Analysis and
   Prevention, 146, Article 105747. https://doi.org/10.1016/j.aap.2020.105747
Rivera, R., Rosenbaum, J., and Quispe, W. (2020). Excess mortality in the United States
   during the peak of the COVID-19 pandemic. MedRxiv. https://doi.org/10.1101/2020.05.
   04.20090324
Rossen, L. M. (2020). Excess deaths associated with COVID-19, by age and race and
   ethnicity—United States, January 26–October 3, 2020. MMWR Morbidity and Mortality
  Weekly Report, 69, 1522–1527. https://doi.org/10.15585/mmwr.mm6942e2
Scully, E. P., Haverfield, J., Ursin, R. L., Tannenbaum, C., and Klein, S. L. (2020).
   Considering how biological sex impacts immune responses and COVID-19 outcomes.
   Nature Reviews Immunology, 20, 442–447. https://doi.org/10.1038/s41577-020-0348-8
Sebastiani, G., Massa, M., and Riboli, E. (2020). Covid-19 epidemic in Italy: Evolution,
   projections and impact of government measures. European Journal of Epidemiology,
   35(4), 341–345. https://doi.org/10.1007/s10654-020-00631-6
24

Sen, A. (1998). Mortality as an indicator of economic success and failure. The Economic
   Journal, 108(446), 1–25. https://doi.org/10.1111/1468-0297.00270
Signorelli, C., Scognamiglio, T., and Odone, A. (2020). COVID-19 in Italy: Impact of
   containment measures and prevalence estimates of infection in the general population.
   Acta Bio Medica Atenei Parmensis, 91(3-S), 175–179. https://doi.org/10.23750/abm.
   v91i3-S.9511
Stang, A., Standl, F., Kowall, B., Brune, B., Böttcher, J., Brinkmann, M., Dittmer, U., and
   Jöckel, K.-H. (2020). Excess mortality due to COVID-19 in Germany. The Journal of
   Infection, 81(5), 797–801. https://doi.org/10.1016/j.jinf.2020.09.012
The Lancet Oncology. (2020). Safeguarding cancer care in a post-COVID-19 world. The
   Lancet Oncology, 21(5), 603. https://doi.org/10.1016/S1470-2045(20)30243-6
Trias-Llimós, S., Riffe, T., and Bilal, U. (2020). Monitoring life expectancy levels during the
   COVID-19 pandemic: Example of the unequal impact of the first wave on Spanish regions.
   PLoS ONE, 15(11), Article e0241952. https://doi.org/10.1371/journal.pone.0241952
Vandoros, S. (2020). Excess mortality during the Covid-19 pandemic: Early evidence from
   England and Wales. Social Science & Medicine, 258, Article 113101. https://doi.org/10.
   1016/j.socscimed.2020.113101
Weinberger, D. M., Chen, J., Cohen, T., Crawford, F. W., Mostashari, F., Olson, D., Pitzer, V.
   E., Reich, N. G., Russi, M., Simonsen, L., Watkins, A., and Viboud, C. (2020). Estimation
   of excess deaths associated with the COVID-19 pandemic in the United States, March
   to May 2020. JAMA Internal Medicine, 180(10), 1336–1344. https://doi.org/10.1001/
   jamainternmed.2020.3391
Wilmoth, J. R., Andreev, K., Jdanov, D., Glei, A., and Riffe, T. (2019). Methods protocol
   for the human mortality database. The Human Mortality Database. https://www.mortality.
   org/Public/Docs/MethodsProtocol.pdf
25

Appendix
Figure A.1:
Distribution of excess mortality in March–April 2020 across Italian provinces. The
provinces in Lombardy are highlighted by the bold black line. The province of
Piacenza is indicated by the blue arrow. Excess mortality is calculated as the
percentage difference with respect to baseline mortality (2015–2019 average)
26

Figure A.2:
Distribution of excess mortality in March–April 2020 across municipalities in
Lombardy and in the province of Piacenza
27

Figure A.3:
Decomposition of the loss of life expectancy in the first quadrimester, by age and sex
and province

Note: For decomposing changes in life expectancy into age-specific contributions, the method proposed by Arriaga
(1984)3 is applied. This approach is used to assess which age-groups have primary contributed to the change in the
first quadrimester life expectancy between 2019 and 2020

3
   Arriaga, E.E. (1984). Measuring and Explaining the Change in Life Expectancies. Demography
21(1):83–96. doi: 10.2307/2061029.
28

Table A.1:
Population exposure by province, year 2020

         Pop 2020 Pop 2020   Exposure      Pop 2020 Pop 2020    Exposure
Age        males    males      males        females   females    females
class   (beginning) (end)  (person-years) (beginning)  (end)  (person-years)
                                   BERGAMO
0            4140     4127         4133       4112      4100        4106
1–4         19110    19109        19110      17998     17995       17997
5–9         28054    28051        28052      26278     26277       26277
10–14       30073    30068        30070      28448     28445       28446
15–19       29875    29866        29871      27856     27854       27855
20–24       29701    29687        29694      27304     27300       27302
25–29       29134    29124        29129      27849     27845       27847
30–34       30332    30315        30323      30035     30029       30032
35–39       34293    34272        34283      33522     33512       33517
40–44       41078    41036        41057      39572     39537       39554
45–49       46720    46623        46671      43875     43822       43848
50–54       47710    47547        47628      45497     45399       45448
55–59       42755    42490        42622      42053     41917       41985
60–64       35011    34594        34802      35498     35304       35401
65–69       30921    30258        30589      32148     31859       32003
70–74       27929    26875        27402      30184     29695       29939
75–79       21009    19661        20335      25417     24570       24994
80–84       15480    13775        14627      21472     20105       20789
85–89        7733     6227         6980      14335     12483       13409
90–94        2463     1696         2080       6901      5272        6087
95–99         396      212          304       1918      1189        1554
100+           19        2           10        176        62         119

Continued
29
Table A.1:
Continued
Pop 2020 Pop 2020 Exposure Pop 2020 Pop 2020 Exposure
Age males males males females females females
class (beginning) (end) (person-years) (beginning) (end) (person-years)
BRESCIA
0 4823 4810 4816 4504 4496 4500
1–4 21513 21509 21511 20613 20610 20611
5–9 30953 30952 30952 29459 29457 29458
10–14 33484 33483 33483 31670 31669 31669
15–19 32860 32853 32856 30250 30245 30248
20–24 33324 33312 33318 30213 30206 30210
25–29 33204 33192 33198 31884 31878 31881
30–34 34943 34927 34935 34248 34243 34246
35–39 39634 39598 39616 38994 38975 38984
40–44 47140 47093 47116 45568 45537 45552
45–49 53420 53340 53380 50503 50457 50480
50–54 53368 53208 53288 51550 51451 51501
55–59 47581 47314 47447 47426 47295 47360
60–64 38707 38337 38522 39872 39701 39787
65–69 33983 33421 33702 36128 35840 35984
70–74 31695 30752 31223 34845 34372 34608
75–79 24849 23609 24229 29843 29061 29452
80–84 18232 16602 17417 25725 24384 25054
85–89 8822 7382 8102 17175 15335 16255
90–94 3022 2192 2607 9114 7157 8135
95–99 516 292 404 2514 1621 2068
100+ 37 10 24 247 107 177
Continued30
Table A.1:
Continued
Pop 2020 Pop 2020 Exposure Pop 2020 Pop 2020 Exposure
Age males males males females females females
class (beginning) (end) (person-years) (beginning) (end) (person-years)
CREMONA
0 1299 1294 1297 1186 1181 1183
1–4 5567 5567 5567 5185 5185 5185
5–9 8152 8152 8152 7417 7417 7417
10–14 8674 8673 8673 7897 7896 7897
15–19 8414 8411 8412 7685 7684 7684
20–24 9036 9032 9034 8038 8035 8037
25–29 9189 9188 9189 8693 8692 8693
30–34 9684 9674 9679 9321 9320 9320
35–39 10738 10735 10737 10267 10261 10264
40–44 12943 12922 12932 12463 12451 12457
45–49 14326 14298 14312 13744 13730 13737
50–54 15146 15091 15118 14494 14461 14477
55–59 13560 13458 13509 13669 13623 13646
60–64 11665 11537 11601 12120 12058 12089
65–69 10668 10444 10556 10987 10883 10935
70–74 9967 9623 9795 10787 10625 10706
75–79 7496 7015 7256 9134 8821 8977
80–84 5986 5399 5692 8541 8018 8279
85–89 2955 2411 2683 5908 5141 5524
90–94 1065 710 887 3095 2338 2716
95–99 204 104 154 895 536 716
100+ 9 3 6 78 33 55
Continued31
Table A.1:
Continued
Pop 2020 Pop 2020 Exposure Pop 2020 Pop 2020 Exposure
Age males males males females females females
class (beginning) (end) (person-years) (beginning) (end) (person-years)
LODI
0 855 851 853 836 835 836
1–4 3987 3984 3986 3827 3827 3827
5–9 5576 5576 5576 5213 5213 5213
10–14 5973 5973 5973 5470 5470 5470
15–19 5503 5503 5503 5331 5330 5330
20–24 5728 5723 5726 5275 5275 5275
25–29 5908 5906 5907 5742 5742 5742
30–34 6544 6542 6543 6338 6335 6336
35–39 7323 7320 7322 7085 7083 7084
40–44 8678 8671 8675 8410 8405 8407
45–49 9876 9856 9866 9284 9270 9277
50–54 10106 10069 10087 9737 9716 9727
55–59 8651 8604 8627 8477 8459 8468
60–64 7209 7128 7169 7444 7410 7427
65–69 6339 6213 6276 6629 6565 6597
70–74 5958 5737 5847 6429 6324 6377
75–79 4306 4031 4168 5373 5206 5289
80–84 3216 2875 3046 4828 4555 4691
85–89 1554 1284 1419 3062 2710 2886
90–94 501 356 428 1491 1128 1309
95–99 78 42 60 422 254 338
100+ 8 5 6 27 9 18
Continued32
Table A.1:
Continued
Pop 2020 Pop 2020 Exposure Pop 2020 Pop 2020 Exposure
Age males males males females females females
class (beginning) (end) (person-years) (beginning) (end) (person-years)
PIACENZA
0 997 995 996 1058 1055 1056
1–4 4661 4660 4660 4241 4241 4241
5–9 6339 6338 6339 5984 5984 5984
10–14 6579 6579 6579 6273 6273 6273
15–19 6516 6515 6516 6060 6060 6060
20–24 7113 7110 7111 6202 6201 6201
25–29 7584 7580 7582 7059 7057 7058
30–34 7692 7685 7689 7516 7516 7516
35–39 8388 8385 8386 7950 7945 7947
40–44 9921 9908 9914 9596 9590 9593
45–49 11460 11445 11452 11493 11484 11489
50–54 11967 11919 11943 11736 11717 11727
55–59 10959 10893 10926 11054 11012 11033
60–64 9444 9331 9388 9725 9677 9701
65–69 7929 7797 7863 8374 8298 8336
70–74 7605 7358 7481 8583 8427 8505
75–79 6436 6069 6252 7707 7494 7600
80–84 5079 4597 4838 7076 6689 6882
85–89 2866 2397 2631 5158 4562 4860
90–94 1043 753 898 2685 2055 2370
95–99 202 126 164 831 526 678
100+ 13 5 9 82 37 59
Note: Population at the beginning of 2020 is provided by ISTAT. Population at the end of 2020 is estimated
following the procedure outlined in the Methods section. Exposure (person-years) is given by the rounded average
of population at the beginning and at the end of the year.
Open Access This article is published under the terms of the Creative Commons
Attribution 4.0 International License (https://creativecommons.org/licenses/by/4.0/)
that allows the sharing, use and adaptation in any medium, provided that the user
gives appropriate credit, provides a link to the license, and indicates if changes were
made.You can also read