Current Approaches to Tactical Performance Analyses in Soccer Using Position Data
←
→
Page content transcription
If your browser does not render page correctly, please read the page content below
Sports Med
DOI 10.1007/s40279-016-0562-5

    LEADING ARTICLE

Current Approaches to Tactical Performance Analyses in Soccer
Using Position Data
Daniel Memmert1 • Koen A. P. M. Lemmink2 • Jaime Sampaio3

Ó Springer International Publishing Switzerland 2016

Abstract Tactical match performance depends on the
quality of actions of individual players or teams in space       Key Points
and time during match-play in order to be successful.
Technological innovations have led to new possibilities to       Position data can be used to develop collective
capture accurate spatio-temporal information of all players      performance indicators capable of describing and
and unravel the dynamics and complexity of soccer mat-           understanding the dynamics of the match. Processing
ches. The main aim of this article is to give an overview of     measures such as the distance to positional-centroid
the current state of development of the analysis of position     and speed facilitate assessment of inter-player
data in soccer. Based on the same single set of position data    coordination and depict different predictabilities in
of a high-level 11 versus 11 match (Bayern Munich against        players’ movement behaviour that ultimately
FC Barcelona) three different promising approaches from          contribute to the overall team organization.
the perspective of dynamic systems and neural networks
will be presented: Tactical performance analysis revealed        Position data can be used to explore the dynamic
inter-player coordination, inter-team and inter-line coordi-     patterns before critical events such as goal-scoring
nation before critical events, as well as team-team inter-       opportunities and goals. Variability of distances
action and compactness coefficients. This could lead to a        between centroids of teams and lines can be used to
multi-disciplinary discussion on match analyses in sport         shed light on inter-team and inter-line coordination
science and new avenues for theoretical and practical            in these critical periods and might help to understand
implications in soccer.                                          the process of scoring goals or to prevent this.
                                                                 With a hierarchy of several artificial neural networks,
                                                                 it is possible to automatically classify complex and
                                                                 characteristic tactical patterns, formations of tactical
                                                                 groups and their dynamic changes (e.g. compactness)
                                                                 and interactions on the basis of position data.
& Daniel Memmert                                                 ‘Compactness’ is defined as the movement speed of
  memmert@dshs-koeln.de                                          all players targeted at recovering ball possession as
                                                                 fast as possible.
1
     Institute of Cognitive and Team/Racket Sport Research,
     German Sport University, Am Sportpark Müngersdorf 6,
     50933 Cologne, Germany
2
     Center for Human Movement Sciences, University Medical     1 Introduction
     Center Groningen/University of Groningen, Groningen, The
     Netherlands
3
                                                                While there do exist review articles about the assessment of
     Research Center for Sports Sciences, Health Sciences and
     Human Development (CIDESD), University of Trás-os-
                                                                technical skills [1], the assessment of tactical behaviour in
     Montes and Alto Douro, Vila Real, Portugal                 team sports has not been paid a lot of attention until a

                                                                                                                   123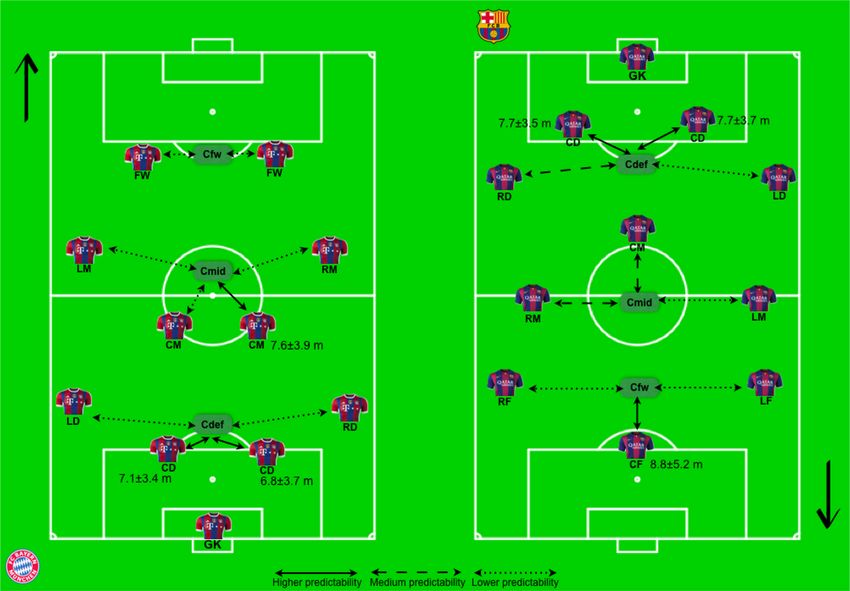
D. Memmert et al.

couple of years ago [2–7]. State-of-the-art research as well             be a dramatic speed advantage concerning the evaluation of
as public interest is calling for a detailed and objective               the position data (reducing from 6–8 h to several minutes).
scientific analysis of soccer matches [8–11]. The primary                The small effort for data acquisition will enable the accu-
aim of this leading article is the discussion of some novel              mulation of enormous amounts of data and thus bring new
objective analysis tools to evaluate tactical performance                opportunities for theory construction and practice in sports.
patterns in high-level men’s soccer. Therefore, we present                  While physical parameters such as distance covered or
and discuss three different recent approaches based on one               speed have been automatically analysed for a few years,
single set of position data, namely the Champions League                 there are only few approaches doing this with tactical
Quarterfinal of Bayern Munich against FC Barcelona from                  parameters in team sports (see Table 1). In this article we
the 2008/2009 season (14 April 2009).                                    introduce and discuss three current approaches: measuring
   The traditional and present standard is to assess tactical            inter-player coordination [30, 33], measuring inter-team
performance during game play by means of the method of                   coordination before critical events [34, 35] and measuring
game observation [12]. Qualitative game observations are                 team-team interaction and compactness coefficients
less objective and systematic (e.g. structured and compre-               [36, 37]—all of which are presented in the light of the
hensive), use subjective impressions of the observers, are               results of a single set of position data from a high-level 11
very slow in analysis processes (4–6 h), and take advantage              versus 11 match (Bayern Munich against FC Barcelona).
of the experiences and ‘know-how’ of experts. In contrast,
quantitative game observations proceed very objectively by
using predefined observation schedules (category systems)                2 Tactical Performance Analysis in Soccer
to collect the data of game behaviour [13]. Subsequently,                  by Measuring Inter-Player Coordination
these data are evaluated and indices are calculated to value
the whole player performances or individual performance                  Match performance in soccer results from the players’ indi-
components [6, 14, 15]. Just over the past years, progress of            vidual and multidimensional skills, expressed within a collec-
computer science made it possible to provide position data               tive organisation. These tactical organisations mainly refer to
and thus track the players‘ movements [16–18]. Position                  how teams are distributed in the pitch across time and, anec-
tracking systems determine the positions of the 22 players               dotally, are held responsible either for increasing or decreasing
and the ball in x- (parallel to sidelines) and y-coordinates at          the overall productivity of the players. Therefore, the position
25 frames per second, which amounts to approximately                     data can be used to develop collective performance indicators
135,000 positions per object and match, and a total of about             capable of describing and understanding the dynamics of these
3,100,000 positions for all players and the ball. There will             complex, non-linear and chaotic organisations.

Table 1 Candidate performance indicators for tactical performance analysis based on position data
Key performance        Method                            Description                                 References
index

Length, width, space   Distance                          Measures the average expansion of a team    Castellano et al. [19], Moura et al. [20]
                                                          in the direction of x and y or rather in
                                                          both dimensions
Space control          Voronoi                           Models space control with the help of a     Fujimura and Sugihara [21], Fonseca
                                                          Voronoi diagram                             et al. [22], Taki and Hasegawa [23],
                                                                                                      Kang et al. [24], Horton et al. [25]
Event recognition      Rule-based, decision trees        Recognizes events from position data        Gudmundsson and Wolle [26],
                                                          such as passes, goals, offside; rule-       Wei et al. [27],
                                                          based system
Route clustering       Clustering algorithms (Fréchet   Filters subgroups from movement             Gudmundsson and Wolle [26],
                        distance)                          patterns of one or more players            Hirano and Tsumoto [28]
Pass evaluation        Motion model and passable         Calculates regions, such as the ‘passable   Horton et al. [25], Gudmundsson
                        area                              area’, for every pass based on a motion     and Wolle [29]
                                                          model and evaluates passes according to
                                                          difficulty or decision quality
Distance from the      Euclidian metrics                 Calculates the players’ average, minimal    Sampaio and Maçãs [30],
 team’s centre                                            and maximal distance from the team’s        Bialkowski et al. [31]
                                                          centre
Formation              Mean average, main                Calculates the average position and thus    Bialkowski et al. [32]
                        component analysis                determines an actual tactical formation

123
Tactical Performance Analyses in Soccer
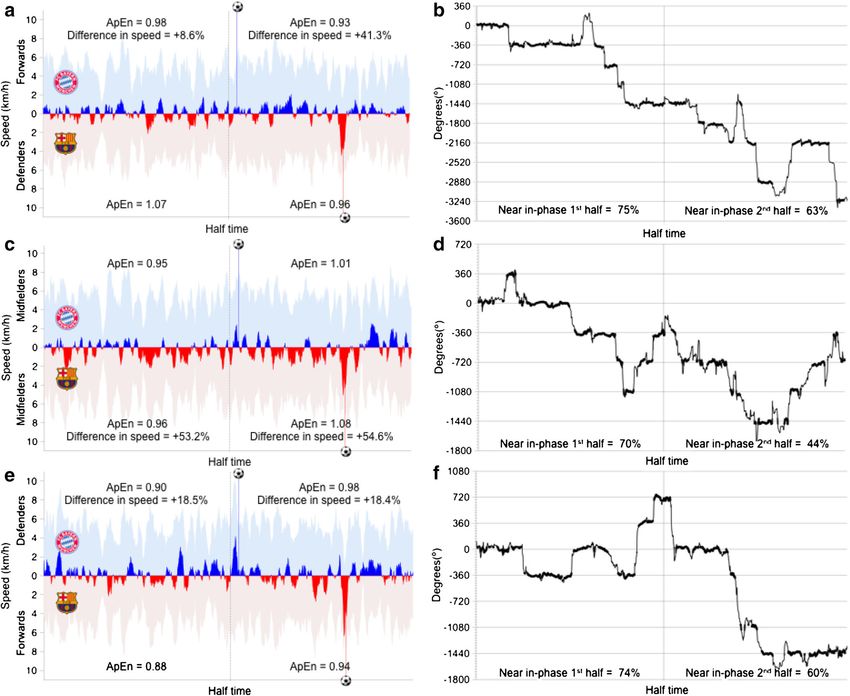
Current studies have already identified several measures consecutive observations. A higher predictability yields
that may be candidates for developing key collective smaller ApEn values, whereas greater independence among
variables, such as the team centroid, stretch index or sur- sequential values from the time series results in larger
face area [30]. The team centroid, calculated as the mean ApEn values [39].
position of all outfield players from one team, exhibits low As an operational example, Fig. 1 depicts the team
variability when used to measure inter-player coordination formation and the predictability in the distances that
at the macro level (11-a-side match). However, the inter- players maintain to their positional-centroid. For example,
action between each player and his position-specific cen- the distance between a central defender to the defensive
troid (e.g. defenders, midfielders and forwards) has been centroid (Cdef) is calculated over time. Afterwards, the
identified as a strong candidate to capture the players’ ApEn of this time series is computed and, finally, a cluster
movement behaviour more accurately [30]. The data pro- analysis automatically classifies the obtained ApEn in three
cessing techniques that can fit the purposes of identifying different groups (higher, medium and lower predictability).
these interactions can include different approaches such as In practical terms and according to Fig. 1, it can be iden-
approximate entropy (ApEn) and relative phase. The tified that both teams’ central defenders (CDs) were iden-
approximate entropy values are used to identify pre- tified as highly predictable players in terms of their pitch
dictability in players’ movement patterns, understood as positioning. In addition, the attacking player for FC Bar-
non-linear time series that incorporate both deterministic celona (the centre forward [CF]) was also classified in this
chaotic and stochastic processes [38]. The algorithm category, suggesting a double goal of marking the oppo-
quantifies predictability in a time series, by measuring the nent’s CDs and acting as a reference point for Barcelona’s
logarithmic likelihood of patterns that are close for m direct offensive plays. Finally, one of the central midfield
consecutive observations and remain close even for m ? 1 (CM) players from FC Bayern Munich was also classified
Fig. 1 Team formation and predictability of distances between described with the average ± standard deviation of the distance to
players and their positional-centroid. The results show the players’ positional-centroid. GK goalkeeper, CD central defender, LD left
predictability in relation to their positional-centroid, as measured by defender, RD right defender, CM central midfielder, LM left
the approximate entropy from the distance between each player and midfielder, RM right midfielder, FW forward, CF central forward,
their positional-centroid. A cluster analysis automatically classified RF right forward, LF left forward, Cdef defensive centroid, Cmid
the predictabilities in three different groups (higher, medium and midfield centroid, Cfw forward centroid
lower). The performance of the highly predictable players is also
123D. Memmert et al. as highly predictable, probably reflecting his role as a processing descriptor for synchronisation between two strong communicator between defenders and attackers. oscillators [40]. The relative phase calculation is often Further developments of this analysis can include exam- carried out by using a Hilbert transform [41] and the ining how these interactions change from the first to the obtained values are expressed in angles. The values close second half of the match due to increasing fatigue, strategic to 0° refer to simultaneous patterns of synchronisation, or situational changes. In addition, coaching staffs can also often referred to as in-phase, whereas values close to 180° test the effects of changing team formations (using differ- refer to asynchronous patterns of synchronisation, often ent distributions of players in defence, midfield or offence referred to as moving in anti-phase [42]. sectors, e.g., 4:3:3, 4:4:2, 4:5:1) and using different player As an example, Fig. 2 shows three different confronta- combinations for each specific position or sector. tions that occurred in the matches, namely, defenders Relative phase procedures can also be used to identify versus opponents’ forwards, midfielders versus midfielders inter-player coordination. This is a non-linear signal and forwards versus opponents’ defenders. The results Fig. 2 Depiction of confrontations between a, b defenders versus (relative phase results) and the percentage of near-in-phase represents opponents’ forwards; c, d midfielders versus midfielders; and e, the amount of time that players were synchronised in each half of the f forwards versus opponents’ defenders. a, c and e show in lighter match. The values close to 0° and 360° multiples refer to simulta- shading the average speed of the players of each team and, in darker neous patterns of synchronisation (i.e. in-phase, in which speeds are shading, the difference between both teams. The approximate entropy synchronised and both are increasing or both are decreasing), whereas (ApEN) shows the predictability from the speed time series and the values close to 180° and 360° multiples refers to asynchronous percentage (%) shows the amount of time that players in one team patterns of synchronisation (i.e. anti-phase, in which speeds are were faster or slower than their opponents in each half of the match. synchronised and present different trends, one increasing and the b, d and f show how the speeds were synchronised during the match other one decreasing or vice-versa) 123
Tactical Performance Analyses in Soccer

show the average speed of the players, which constitute         the critical period. Based on team and line centroids inter-
each positional centroid (Fig. 2a, c, e), and how these         team and inter-line distances were calculated. Variability
different speeds are synchronised during match time             was determined as the rate-of-change of these variables.
(Fig. 2b, d, f, relative phase results). The results display    Differences between variability of inter-team distances and
how Bayern Munich defenders were faster than FC Bar-            inter-line distances were determined with an independent
celona forwards, particularly in the second half (?8.6 and      sample t test (p \ 0.05). Based on a method described in an
?41.3 %, respectively). The FC Barcelona midfielders            earlier study [35], the threshold for high variability was
were faster than their counterparts for a substantial amount    defined as three times the standard deviation of the total
of time (?53.2 and ?54.6 %, respectively) and the Bayern        match variability. Additionally, the strengths of the dif-
Munich forwards were faster than FC Barcelona defenders         ferent couplings and frequencies of variability above the
(?18.9 and ?18.4 %, respectively). Figure 2b, d, f show         threshold were calculated.
that players were highly synchronised in all situations            In general, results clearly show that soccer is an in-phase
during the initial match periods. The second half was           sport with high couplings between teams and lines espe-
played with less near in-phase synchronisation [42], par-       cially in longitudinal direction, indicated by the explained
ticularly for the midfielder confrontations (Fig. 2c, d).       variance      between      team     and     line     centroids
                                                                (0.86 \ R2 \ 0.99). In total, nine critical events were
                                                                identified, seven goal attempts and two goals. In Fig. 3 the
3 Tactical Performance Analysis in Soccer                       variability of the inter-line distance between the attacking
  by Measuring Inter-Team and Inter-Line                        line and defending line of the opponent before a goal is
  Coordination Before Critical Events                           presented. The centroid of the attacking line is crossing the
                                                                centroid of the defending line (Fig. 3a) and variability rises
To explore the tactical behaviour of interacting players or     above the inter-line threshold between 20 and 10 s before
teams, there is a need for collective variables that capture    the goal is scored (Fig. 3c). This moment in time matches
the dynamics of this behaviour. Centroids, stretch indexes,     the moment of crossing of the attacking and defending line
length and widths, and surface areas of teams seem to           (Fig. 3).
provide a sound basis for collective variables that capture        Differences in variability during the 30 s prior to a goal
the dynamics of attacking and defending in soccer at team       attempt or goal were significantly higher for inter-line
level [10]. The potential of centroids to describe the          distances than for inter-team distances (p \ 0.05). As an
rhythmic flow of attacking and defending has been shown         example, in Fig. 4 the variability of the inter-line distance
in small-sided games and 11-a-side soccer matches               is especially higher in the period between 20 and 10 s
[2, 14, 34, 35]. These findings are in line with the general    before the goal compared to the inter-team distance. These
aim of the game, as such patterns reflect the two teams         differences were seen in eight out of nine critical periods
moving up and down the field to arrive in a scoring position    but at different moments in the 30-s periods.
or prevent that from happening.                                    On average, variability in the 30-s periods before a
    From a dynamic system perspective, it is expected that      critical event was not higher than the variability of a ran-
high variability in inter-team distance (distance between       dom 30-s game period. However, when focusing on the
two teams’ centroids) reflects perturbations in the balance     variability of the separate 10-s periods before a critical
between the teams’ behaviour that precede critical game         event some interesting findings were seen. On average,
events such as goal attempts or goals. However, in an 11-a-     variability seemed to increase toward the critical moments.
side soccer match periods of high variability were associ-      However, there were different patterns for the separate
ated with collective defensive actions and team reorgani-       lines. For the defending line (defenders of the attacking
sation in dead-ball moments rather than goals or goal           team vs. the attackers of the defending team) and the
attempts [35]. This may be explained by the fact that dif-      midfield line (midfielders vs. midfielders), no clear increase
ferent functional units exist within and between teams and      or decrease of variability of inter-line distances was seen
that teams switch between these functional states depend-       before the critical moments. In contrast, the attacking line
ing on the situational context to preserve balance between      (attackers of the attacking team versus the defenders of the
them. From this perspective variability in inter-line dis-      defending team), a clear increase of variability of the inter-
tances, i.e. distances between centroids of attackers, mid-     line distance was seen approaching the critical moments.
fielders and defenders of both teams before critical events,    So, the variability of the attacking line of the attacking
could shed light on this issue.                                 team and the defending line of the defending team seems
    The match Bayern Munich against FC Barcelona was            most important before a critical event. This phenomenon
first scanned for all critical events, meaning goal attempts    was also illustrated by the higher average number of
and goals. The 30 s prior to a critical event were defined as   moments of high variability for this inter-line distance

                                                                                                                   123
D. Memmert et al.
Fig. 3 Example of a critical
period (30 s) before a goal:
a 45
a position of the centroids in 40
longitudinal direction of the
attacking line of the scoring 35
team and the defending line of 30
the opposite team; b distance
between the centroids of both 25
lines (inter-line distance); c rate
20
of change (RoC) of the inter-
line distance as a measure of 15
variability: the threshold was
defined as three times the 10
standard deviation of the match 5
variability
0
Time (s)
Bayern Munich FC Barcelona
b 14
12
10
8
6
4
2
0
30 20 10 0
-2
-4
-6
Time (s)
c 0.8
0.6
0.4
0.2
0
30 20 10 0
-0.2
-0.4
Time (s)
RoC Threshold
123Tactical Performance Analyses in Soccer
Fig. 4 Example of a critical 0.8
period (30 s) before a goal: the
rate of change (RoC) (10 m/s)
as a measure of variability of 0.6
the distance between the
centroid of the scoring team and
the centroid of the opposite
team (black line) and the 0.4
centroid of the attacking line of
the scoring team and the
centroid of the defending line of 0.2
the opposite team (broken line)
in longitudinal direction
30
0.0 0
20 10
-0.2
-0.4
Team Line
during the critical periods (4.4 for the attacking line vs. 1.4 More specifically, training data contain information
for the midfielders and 0.2 for the defending line). Inter- about the spatio-temporal formation of players on the
estingly, the mean variability for the inter-team distances playing field. According to a self-organizing system this
between midfielder centroids was the highest 30 to 20 s information can be distributed to an artificial neural net-
before the critical events. This could illustrate that a higher work consisting of a number of boxes, so-called ‘artificial
variability of the inter-line distance between midfielders of neurons’. Each neuron represents a spatio-temporal variant
both teams earlier in time indicates a disturbed balance of the players’ formations on the playing field [45]. If a
between teams that leads to an increase of variability in the number of neurons represents a set of similar variants of
attacking line (attackers of the attacking team versus the that spatio-temporal type, the neurons form clusters. The
defenders of the defending team) before a critical event. result of training thus is that classes of similar input values
Future studies should incorporate different time scales and (e.g. player position) are mapped to clusters of neurons.
other functional units of players in relation to tactical This means that training input values can be classified as
strategy or ball location. belonging to specific clusters and therefore the wide variety
of data can be organised into a small set of characteristic
types.
4 Tactical Performance Analysis in Soccer To analyse tactical processes in soccer according to the
by Measuring Team-Team Interaction game’s dynamic development, it is useful to use the net
and Compactness approach and to restrict the formations to those of tactical
groups such as offence and defence. These two groups have
A self-organizing map is a type of artificial neural network, a smaller number of members and their data should not
which in particular can be used for pattern or type analysis include their location on the playing field. The data anal-
[43, 44]. Simply put, a self-organizing network consists of yses only reveal the temporal sequences of these tactical
neurons which gather information from training data: formations and represent the dynamic game process (the
During one’s learning phase, training input stimulates and position information, i.e. the mean value of the players’
influences the ‘winner’ neuron (i.e. the most connected to positions, also called ‘centroid’ is kept separately for fur-
the incoming information) by improving its receptiveness ther analyses). Hence, several specific process analyses can
for different pieces of information of incoming training be carried out, two of which are briefly introduced in the
data.). Also, the neurons of a number of neighbour shells following examples.
(i.e. those next to the winner neuron) are modified in the The frequencies of formations and their interactions can
same way, activating a larger neuronal area with the same be measured and thus can give information about which
or lower intensity of the stimulus. formations are preferred by which team, and which tactical
123D. Memmert et al.
Constellation data can be compared with other data such
as ball win, possession or loss, and therefore formations
can be valuated time-dependently as successful or unsuc-
cessful. This way, a tactical interaction of formations can
be said to be successful for a team if the respective tactical
group of the team was successful with the activity in its
constellation. The prevailing question is, which particular
team formations lead to success, for example ball posses-
sions and goals? Using these data, both the team’s player
formations over space and time as well as the formations of
the two teams as a pair, can be analysed. The respective
results deliver a statistical success-distribution according to
specific (inter)action patterns within and between the
teams. For example, team ‘compactness’ (=movement
speed of all players targeted at recovering ball possession
as fast as possible) in soccer can be calculated by a
Fig. 5 Example of a visual representation of an offensive formation dynamical process analysis with precise point-in-time
of FC Barcelona (playing from left to right) and a defensive formation selection as a measurement (see Fig. 6). The process
of FC Bayern Munich (playing from right to left) as a specific
offensive-defensive interaction pattern. Use of such visual represen-
velocity (in m/s) is calculated to show how quickly each
tations allowed the authors to determine all characteristic formations player moves towards the ball to try to win it back. For
of both teams and find the most important characteristic interaction example, in the first half, the centre striker of FC Bayern
patterns between both teams. The most frequent defensive pattern of Munich (mean = 4.9 m/s) has the weakest values, whereas
FC Bayern Munich (formation 3) was 40 % successful (i.e. obtained
possession of the ball) against the most frequently employed offensive
the other players of FC Bayern Munich are relatively
formation (formation 2) of FC Barcelona similar. Based on the individual values of all field players,
the average speed of a team, the ‘compactness’ perfor-
mance parameter of the defensive team strategy, can be
concepts are represented by those distributions [46]. Fur- calculated. Here, no significant difference between FC
thermore, the tactical responses of, for example, defence of Bayern Munich (mean = 4.5 m/s) and FC Barcelona
one team against offence activities of the other team can be (mean = 4.3 m/s) was found.
analysed and measured. Finally, if the meaning of ‘success’ The qualitative analysis of interaction now can be
is defined, success of actions and interactions can be completed for example by quantitative analysis of fre-
measured in the context of formations—or in turn, as is quencies, for instance recognising a negative rate as an
outlined in the following, can help to characterise a specific indicator of significant weakness, as insignificantly rare, or
constellation as successful or not. For example, Team A just as a creative (i.e. providing an adequate and rare
(FC Bayern Munich) defensive formation (see Fig. 5; solution) tactical variant in order to confuse the opponent
defensive and defensive midfield) is most successful if they team [36, 37]. Finally, the time series of constellation types
interact in the defensive pattern against the most frequent as a whole offers much information about the dynamic
offensive formations of Team B (FC Barcelona; offensive interaction of opponent tactical groups, containing infor-
midfield and strikers). mation about frequent stereotypical interaction patterns as
Fig. 6 A dynamic process analysis with precise point-in-time Barcelona (grey squares) as quickly as possible. The process speed is
selection as a measurement of compactness in soccer (from left to calculated (in m/s) to show how quickly each player of each team is
right). The ball (circle within square) and the pathway of the ball are running towards the ball; this can be calculated as an average
illustrated. Team A (black squares, FC Bayern Munich) lost the ball according to the team performance for the variable ‘compactness’
and all players from Team A are trying to get the ball back from FC
123Tactical Performance Analyses in Soccer
well as about rare but striking and perhaps creative ones. In analysis [47]. While this would be a challenging task it
order to better detect such interaction patterns, those time could foster performance analysis approaches based on
series—also called trajectories—again can be taken as position data from a theoretical and practical point of view.
input data and be trained to a second level network, which
then allows for recognising specific types of interaction Acknowledgements The content of this leading article is based on
three lectures given by the authors to an invited symposium at the
[46]. European College of Sport Science 2014 Congress held in Amster-
dam, The Netherlands.
5 Conclusion Compliance with Ethical Standards
Funding No financial support was received for the planning or
According to prevalent belief, a high level of tactical conduct of the research presented in this article. Preparation of the
competence is crucial for players’ effective performance in article was supported by a Grant from the German Research Council
team sports. Working with position data, the discussed (DFG, Deutsche Forschungsgemeinschaft) [ME 2678/3-3] to Daniel
Memmert.
approaches in our leading article examine how patterns
emerge from the interaction of their many degrees of Conflict of interest Daniel Memmert, Koen A.P.M. Lemmink and
freedom or constraints. For the first time, we demonstrated Jaime Sampaio declare that they have no conflicts of interest relevant
different kinds of computer science approaches that enable to the content of this article.
to obtain and analyse new parameters such as: inter-player
coordination, inter-team coordination before critical
events, and team-team interaction and compactness coef- References
ficients. All these performance analysis tools could help
coaches to modify their training methods (e.g. focusing on 1. Ali A. Measuring soccer skill performance: a review. Scand J
Med Sci Sports. 2011;11:170–83.
recent trends in game philosophy and tactics) according to 2. Walter F, Lames M, McGarry T. Analysis of sports performance
their needs and to improve the tactical behaviour of their as a dynamic system by means of relative phase. Int J Comput Sci
players. Sport. 2007;6:35–41.
Also these new approaches based on position data could 3. Memmert D. Testing of tactical performance in youth elite soc-
cer. J Sports Sci Med. 2010;9:199–205.
be an important step towards objectification of tactical 4. Vilar L, Araújo D, Davids K, et al. The role of ecological
performance components in team sports. This would be of dynamics in analysing performance in team sports. Sports Med.
great interest not only for talent selection in different kinds 2012;42:1–10.
of youth sports (basketball, team handball, soccer, field 5. Williams AM, Ford PR. Expertise and expert performance in
sport. Int Rev Sport Exerc Psychol. 2008;1:4–18.
hockey, tennis), but also for the analysis of professional 6. Brefeld U, Knauf K, Memmert D. Spatio-temporal convolution
team sports. In addition to providing information on sports kernels. Mach Learn. 2016;102(2):247–73. doi:10.1007/s10994-
performance and their interactions, the diagnostic possi- 015-5520-1.
bilities of these new position data methods should be 7. Kempe M, Grunz A, Memmert D. Detecting tactical patterns in
basketball: comparison of merge self-organising maps and
considered. This can be helpful in sports practice (e.g., for dynamic controlled neural networks. Eur J Sport Sci.
sophisticated assessments of player performances) and 2015;15:249–55. doi:10.1080/17461391.2014.933882.
science (e.g., for the evaluation of sports teaching 8. Lago C. The influence of match location, quality of opposition,
approaches). In the current era of information technology and match status on possession strategies in professional associ-
ation football. J Sports Sci. 2009;27:1463–9. doi:10.1080/
with a great amount of data available for nearly all facets of 02640410903131681.
sports, automatic and rapid assessment systems for tactical 9. Perl J, Memmert D. Special issue: Network approaches in com-
behaviour in team sports are highly desirable. Use of plex environments. Hum Mov Sci. 2012;31:267–70.
(sports-) scientific methods has provided only very limited 10. Lemmink KAPM, Frencken WGP. Tactical performance analysis
in invasion games: Perspectives from a dynamical system
scope for investigation in the past. However, collaboration approach with examples from soccer. In: McGarry T, O’Dono-
between sports sciences and computer science is expected ghue P, Sampaio J, editors. Routledge handbook of sports per-
to present considerable opportunities for synergistic bene- formance analysis. London: Routledge; 2013. p. 89–100.
fits in the future. Future research should also try to focus on 11. Memmert D. Teaching tactical creativity in team and racket
sports: research and practice. Routledge; Abingdon; 2015.
a detailed comparison of the three different type of out- 12. Franks I. Qualitative and quantitative analysis. Coach Rev.
comes resulting from the three different approaches. In 1985;8:48–50.
further analyses, for example, our findings on tactical 13. Soccer Tenga A. In: McGarry T, O’Donoghue P, Sampaio J,
performance could be directly compared with the tactical editors. Routledge handbook of sports performance analysis.
London: Routledge; 2013. p. 323–37.
performance of the defense or offensive players in some 14. Olthof SBH, Frencken WGP, Lemmink KAPM. The older, the
critical moments or phases. But these investigations would wider: on-field tactical behavior of elite-standard youth soccer
also need a general theoretical framework in performance players in small-sided games. Hum Mov Sci. 2015;41:92–102.
123D. Memmert et al.
15. Gréhaigne JF, Godbout P. Collective variables for analysing workshops (CVPRW), 2013 IEEE Conference on. IEEE.
performance in team sports. In: McGarry T, O’Donoghue P, p. 984–990.
Sampaio J, editors. Routledge handbook of sports performance 32. Bialkowski A, Lucey P, Carr P, et al. Large-scale analysis of
analysis. London: Routledge; 2013. p. 101–14. soccer matches using spatiotemporal tracking data. In: Data
16. Baca A. Tracking motion in sport—trends and limitations. In: mining (ICDM), 2014 IEEE international conference on. IEEE.
Hammond J, editor. Proc. of the 9th Australasian Conf. on p. 725–730.
Mathematics and Computers in Sport. MathSport (ANZIAM). 33. Gonçalves B, Figueira B, Maçãs V, et al. Effect of player position
2008. p. 1–7. on movement behaviour, physical and physiological perfor-
17. Perl J, Memmert D, Baca A, et al. Sensors, monitoring, and mances during an 11-a-side football game. J Sports Sci.
model-based data analysis in sports, exercise and rehabilitation. 2014;32:191–9.
In: Lai DTH, Begg RK, Palaniswami M, editors. Sensor networks – 34. Frencken WGP, Lemmink KAPM, Delleman N, et al. Oscilla-
challenges towards practical application. Boca Raton: Taylor and tions of centroid position and surface area of soccer teams in
Francis; 2012. pp. 375–405. small-sided games. Eur J Sport Sci. 2011;11:215–23.
18. Baca A, Dabnichki P, Heller M, et al. Ubiquitous computing in 35. Frencken WGP, Lemmink KAPM, van de Poel H, et al. Vari-
sports: a review and analysis. J Sports Sci. 2009;27:1335–46. ability of inter team distance associated with match events in
19. Castellano J, Figueira B, Coutinho D, et al. Identifying the effects elite-standard soccer. J Sports Sci. 2012;30:1207–13.
from the quality of opposition in a football team positioning 36. Memmert D, Perl J. Analysis and simulation of creativity learning
strategy. Int J Perform Anal Sport. 2013;13(3):822–32. by means of artificial neural networks. Hum Mov Sci.
20. Moura FA, Martins LEB, Anido RO, et al. A spectral analysis of 2009;28:263–82.
team dynamics and tactics in Brazilian football. J Sports Sci. 37. Memmert D, Perl J. Game creativity analysis by means of neural
2013;31(14):1568–77. networks. J Sport Sci. 2009;27:139–49.
21. Fujimura A, Sugihara K. Geometric analysis and quantitative 38. Richman J, Moorman J. Physiological time-series analysis using
evaluation of sport teamwork. Syst Comp Jpn. 2005;35(6):49–58. approximate entropy and sample entropy. Am J Physiol.
22. Fonseca S, Milho J, Travassos B, et al. Spatial dynamics of team 2000;278:H2039–49.
sports exposed by Voronoi diagrams. Hum Mov Sci. 39. Pincus S. Approximate entropy as a measure of system-com-
2012;31(6):1652–9. plexity. Proc Natl Acad Sci. 1991;88:2297–301.
23. Taki T, Hasegawa JI. Visualization of dominant region in team 40. Kurz M, Stergiou N. Applied dynamic systems theory for the
games and its application to teamwork analysis. In: Computer analysis of movement. In: Stergiou N, editor. Innovative analyses
graphics international, 2000. Proceedings. IEEE. p. 227–235. of human movement. Champaign: Human Kinetics; 2004.
24. Kang CH, Hwang JR, Li KJ. Trajectory analysis for soccer p. 93–119.
players. In: Data mining workshops, 2006. ICDM Workshops 41. Palut Y, Zanone P. A dynamical analysis of tennis: concepts and
2006. Sixth IEEE International Conference on. IEEE. p. 377–381. data. J Sports Sci. 2005;23:1021–32.
25. Horton M, Gudmundsson J, Chawla S, et al. Classification of 42. Folgado H, Duarte R, Fernandes O, et al. Competing with lower
passes in football matches using spatiotemporal data. level opponents decreases intra-team movement synchronisation
arXiv:1407.5093. and time-motion demands during pre-season soccer matches.
26. Gudmundsson J, Wolle T. Towards automated football analysis: PLOS One. 2014;9:e97145. doi:10.1371/journal.pone.0097145.
algorithms and data structures. In: Proc. 10th Australasian Conf. 43. Perl J, Tilp M, Baca A, et al. Neural networks for analysing sports
on mathematics and computers in sport. games. In: McGarry T, O’Donoghue P, Sampaio J, editors.
27. Wei X, Sha L, Lucey P, et al. Large-scale analysis of formations Routledge Handbook of Sports Performance Analysis. Routledge:
in soccer. In: Digital image computing: techniques and applica- Abingdon; 2013. pp. 237–47.
tions (DICTA), 2013 International Conference on. IEEE. p. 1–8. 44. Perl J. A neural network approach to movement pattern analysis.
28. Hirano S, Tsumoto S. Grouping of soccer game records by Hum Mov Sci. 2014;23:605–20.
multiscale comparison technique and rough clustering. In: Hybrid 45. Perl J, Grunz A, Memmert D. Tactics in soccer: an advanced
intelligent systems, 2005. HIS’05. Fifth International Conference approach. Int J Comput Sci Sport. 2013;12:33–44.
on. IEEE. p. 6. 46. Grunz A, Memmert D, Perl J. Tactical pattern recognition in
29. Gudmundsson J, Wolle T. Football analysis using spatio-tempo- soccer games by means of special self-organizing maps. Hum
ral tools. Comput Environ Urban Syst. 2014;47:16–27. Mov Sci. 2012;31:334–43.
30. Sampaio J, Maçãs V. Measuring tactical behaviour in football. Int 47. Glazier PS. Towards a grand unified theory of sports perfor-
J Sports Med. 2012;33:395–401. mance. Hum Mov Sci. 2016 (in press).
31. Bialkowski A, Lucey P, Carr P, et al. Recognising team activities
from noisy data. In: Computer vision and pattern recognition
123You can also read