Effects of Ambient Oxygen and Density on Primary Soot Size under Diesel-Like Conditions Using a Lagrangian Soot Tracking Model - CSE-Lab
←
→
Page content transcription
If your browser does not render page correctly, please read the page content below

Downloaded from SAE International by Reprints Desk Document Delivery Account, Monday, March 22, 2021
                                                                                                                          ARTICLE INFO
                                                                                                                          Article ID: 03-14-02-0018
                                                                                                                          © 2021 SAE International
                                                                                                                          doi:10.4271/03-14-02-0018

Effects of Ambient Oxygen and
Density on Primary Soot Size under
Diesel-Like Conditions Using a
Lagrangian Soot Tracking Model
Jiun Cai Ong,1,2 Kar Mun Pang,1 Jens Honore Walther,1,3 Jee-Hou Ho, 2 and Hoon Kiat Ng2
1
 Technical University of Denmark, Denmark
2
  University of Nottingham Malaysia Campus, Malaysia
3
  ETH Zürich, Switzerland

                                                                                                                          History
Abstract                                                                                                                  Received:      07 Aug 2020
This article investigates the effect of ambient oxygen (O2) levels and ambient density on the primary                     Revised:       23 Oct 2020
soot size under diesel engine-like conditions via the Lagrangian soot tracking (LST) method. The                          Accepted:      14 Dec 2020
numerical studies and soot analysis are carried out for an n-heptane spray flame in the Sandia                            e-Available:   10 Mar 2021
constant volume combustion chamber. Numerical studies are carried out at two O2 levels of 15%
and 12%, as well as two ambient densities of 14.8 kg/m3 and 30 kg/m3. The LST model involves                              Keywords
treating the soot particles formed in the spray flame as Lagrangian particles, and their individual                       Lagrangian soot tracking,
soot information is stored. Based on the primary soot size distribution for soot particles in the core                    Primary soot, Soot age,
of the spray jet, an increase in ambient density from 14.8 kg/m3 to 30 kg/m3 is shown to increase                         Soot size, Diesel spray
the peak and mean soot size by a factor of 1.5. Furthermore, the peak and mean primary soot size
decreases with decreasing O2 levels from 15% to 12%. The larger primary soot size at higher O2 levels                     Citation
and ambient densities can be attributed to the higher net growth rate experienced by the soot                             Ong, J., Pang, K., Walther, J.,
particles. At low density, the span of the soot cloud is shorter O2 level is low. In contrast, the high-                  Ho, J. et al., “Effects of
density cases show a comparable soot cloud span at both O2 levels before steady-state is reached.                         Ambient Oxygen and
Soot age is introduced to predict the soot residence time in the spray flame. The results show that                       Density on Primary Soot
the soot residence time is dependent on both the span of the soot cloud and the initial onset location                    Size under Diesel-Like
of the soot formed.                                                                                                       Conditions Using a
                                                                                                                          Lagrangian Soot Tracking
                                                                                                                          Model,” SAE Int. J. Engines
                                                                                                                          14(2):2021,
                                                                                                                          doi:10.4271/03-14-02-0018.

                                                                                                                          ISSN: 1946-3936
                                                                                                                          e-ISSN: 1946-3944

                                                                                                                                                        1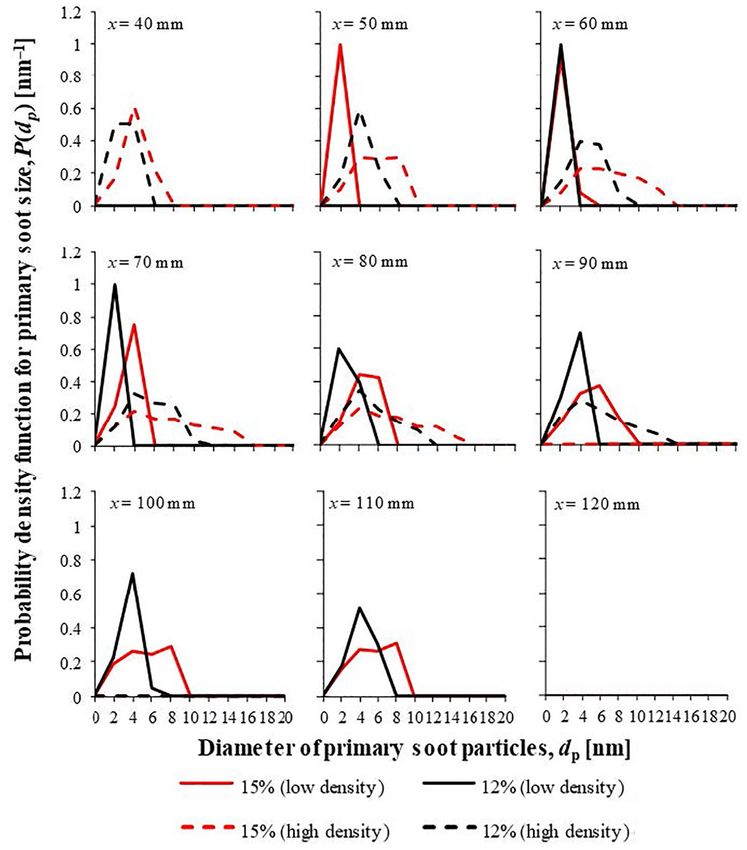
Downloaded from SAE International by Reprints Desk Document Delivery Account, Monday, March 22, 2021

2           Ong et al. / SAE Int. J. Engines / Volume 14, Issue 2, 2021

1. Introduction                                                                 by providing the instantaneous spatial or temporal informa-
                                                                                 tion of the soot formation processes.

S
        oot is one of the most distinctive and problematic emis-                       There are a few methods to model the soot size distribution.
        sions of diesel engines due to its complex formation                     One approach is the method of moments (MOM) [21], in
        and oxidation processes. Soot particles are normally                     which the evolution equations for moments of the population
formed as fractal open-structured agglomerates with large                        distribution are solved instead of explicitly solving the popula-
quantities of nanosized primary particles via incomplete                         tion distribution [22]. MOM was used by Ito et al. [23] who
combustion of hydrocarbon fuels [1, 2]. The morphological                        compared the predicted primary soot size from MOM against
characteristics and nanostructural properties of combustion-                     the measurement data from a laser-induced incandescence
generated soot particles are of paramount importance because                     experiment of n-heptane spray combustion in a constant
they are closely linked to the formation of primary soot parti-                  volume chamber. Recently, Naik et al. [24] utilized MOM in
cles and soot oxidative reactivity [3]. Furthermore, ultrafine                   their simulation study of high-pressure lifted flames in a
particle emissions from incomplete combustion are harmful                        constant volume chamber. In addition to n-heptane fuel, a
to human health [4, 5]. This concern has led to the legislation                  two-component surrogate fuel, conventional U.S. No. 2 diesel
of Euro 5/6, which aims to reduce soot mass and particle                         (D2), and world-averaged jet fuel (Jet-A) were considered in
number emissions [6, 7]. Driven by the stringent legislations                    their simulation study [24]. Another approach is the discrete-
for pollutant emissions, detailed analysis of soot morphology                    sectional method (DSM) [25, 26, 27], which discretizes the
and its evolution could provide useful insights into mitigating                  population of soot particles into discrete sections or “bins,”
the detrimental impact of particle emissions.                                    and the evolution equations are solved for each of these bins.
      Transmission Electron Microscopy (TEM) analysis of                         This method has been applied to model primary soot size
soot particles directly sampled from a diesel spray flame has                    distribution in the optical engine [28, 29]. It is important to
emerged to be a powerful and quantitative technique for                          note that MOM only predicts the ensemble-averaged quantities
studying the soot particle size. This direct soot sampling tech-                 where the exact shape of the particle size distribution is
nique has been successfully applied in reacting diesel jets,                     unknown. As for DSM, in order to achieve good accuracy, a
under high-pressure and high-temperature ambient condi-                          higher number of sections are needed to represent the particle
tions for soot study in a constant volume vessel [8, 9, 10, 11,                  size distribution, thus making it computationally expensive.
12, 13, 14], and in diesel engines [15, 16, 17]. Kook and Pickett                It is also noteworthy that both MOM and DSM can only
[8] studied the morphology of soot particles extracted from                      provide the mean primary particle soot size and do not
diesel spray flames at ambient temperature and density of                        provide information about the history of the soot particles,
1000 K and 6.7 MPa, respectively, in a constant volume vessel                    which may contain vital information to understand the
by using a thermophoretic probe. The TEM analysis of the                         soot processes.
soot samples along different in-flame axial locations revealed                         The Lagrangian tracking method is an alternative to DSM
that the diameters of primary soot increase at first, reach a                    and MOM for computing particle dynamics. It allows the
peak, and then decrease [8], in which the decrease in primary                    possibility to track an individual particle continuously along
soot size is due to the soot oxidation process. Several studies                  its trajectory and to monitor its individual interaction with
[9, 18] showed a similar trend. A similar sampling technique                     the gas-phase and other particles. No classes or sections of
and TEM analysis were used by Kuribayashi et al. [14] to study                   particles are required, thus making the calculation of the
the effect of O2 level (15% and 21%) on soot concentration,                      particle size distribution relatively straightforward. Gallen
size, number density, and morphology in a diesel spray flame.                    et al. [30] introduced a semi-deterministic Lagrangian particle
They found that lowering the ambient O2 concentration                            tracking methodology that tracks the Lagrangian soot parti-
resulted in a delayed and downstream-shifted soot processes,                     cles, as well as considers their collision process. A hybrid
as well as an increase in the aggregate size in the downstream                   Eulerian-Lagrangian method for soot modelling, which was
region. However, the primary soot size remained relatively                       developed by Dellinger et al. [31], combined a reduced gas-
stable when the O2 concentration decreased from 21% to 15%.                      phase chemistry, a sectional model for polycyclic aromatic
Besides this work, the same approach (direct sampling and                        hydrocarbons (PAH), and a Lagrangian description of soot
TEM analysis) has also been applied in other studies, such as                    particles dynamics. The Lagrangian soot particles were nucle-
fuel comparison among conventional diesel, biodiesel, and                        ated from PAH molecules and radicals. Meanwhile, a two-way
Fischer-Tropsch Diesel [11, 12], the effect of injected fuel                     coupling of the gaseous and solid phases was assumed. It is
amount [17], and nanostructure analysis of primary particles                     important to note that the aforementioned studies were both
[19, 20]. Despite successful implementation in various studies,                  related to gas turbine applications. A Lagrangian soot tracking
a major limitation of the direct soot sampling and TEM                           (LST) model based on a semi-empirical formulation was
analysis is the time resolution. Since the thermophoretic probe                  recently developed by Ong et al. [32] and was successfully
is constantly exposed to the diesel flame, the sampled soot is                   implemented for diesel spray applications. The LST model was
a time-integrated mixture of soot particles throughout the                       validated against the experimental data of n-dodecane and
injection and combustion duration. Therefore, the use of                         n-heptane spray flame from the Engine Combustion Network
Computational Fluid Dynamics (CFD) is expected to                                (ECN). Despite omitting the coagulation process, the LST
overcome the limitations of TEM analysis of the sampled soot                     model was demonstrated to be able to predict primary soot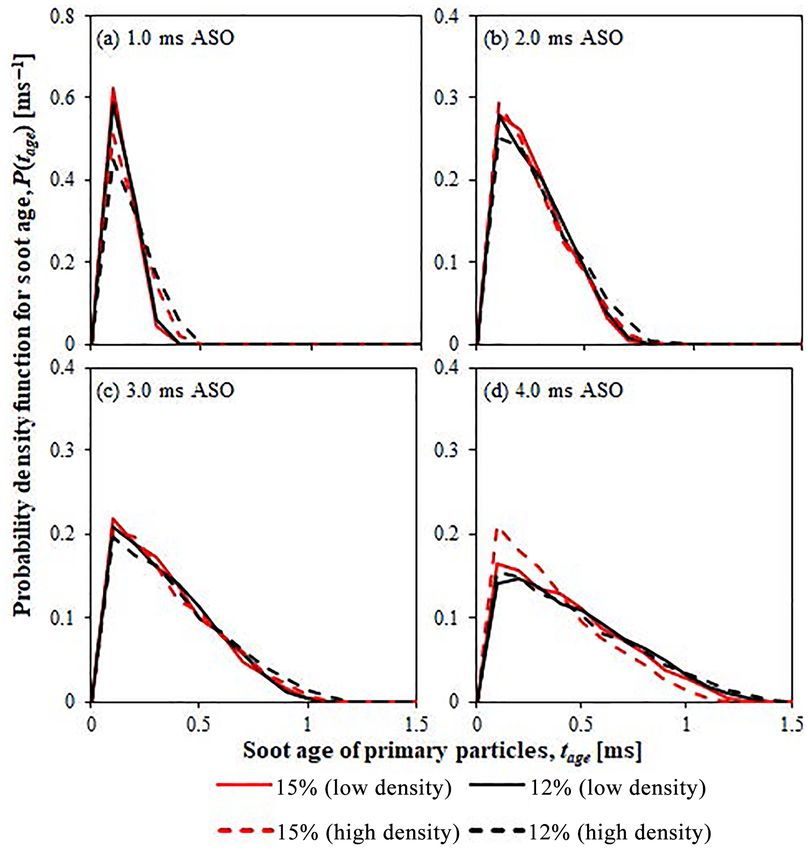
Downloaded from SAE International by Reprints Desk Document Delivery Account, Monday, March 22, 2021

                                                                                                        Ong et al. / SAE Int. J. Engines / Volume 14, Issue 2, 2021              3

                      size, track individual soot particles, and access their history                    low density and high density cases, respectively, for brevity.
                      as the soot particles evolve in the diesel spray flame.                            Injection specifications and profiles in the current simulations
                           Setting against this background, the present study is                         were set to correspond to those used in the experimental setup.
                      carried out by coupling the previously developed LST model                         Details of the experimental conditions and the injection
                      [32] with a reduced n-heptane chemical mechanism to inves-                         parameters are shown in Table 1.
                      tigate the effect of ambient O2 and density on primary soot                             The spray breakup was described using the Reitz-Diwakar
                      size in a Sandia n-heptane reacting spray. The article is struc-                   model [35]. The model constant that governs the time factor
                      tured such that the numerical formulation and setup are first                      for stripping, Cs, was set to 11.5. The turbulent flow was
                      provided. This is followed by the validation of CFD models                         modeled using the Unsteady Reynolds-Averaged Navier-
                      using the non-reacting and reacting spray experimental data                        Stokes (URANS) method with the standard k − ε model [36].
                      from ECN. The validation of the LST method is carried out                          The model constant C1ε was calibrated according to its approx-
                      by comparing the distribution of the steady-state soot volume                      imation of round jets [37, 38] and set to a value of 1.53. The
                      fraction (SVF). Following this is the study of the soot size                       initial turbulence kinetic energy k was set to 0.735 m 2/s2 ,
                      distribution for soot particles formed at the core of the jet                      which was estimated based on the measured RMS velocity in
                      during the transient and the steady-state phase.                                   the experiment [34]. The initial turbulence dissipation
                                                                                                         rate ε was set to 5.67 m2/s3 based on the turbulence integral
                                                                                                         length scale of 0.01 mm. The choice of the initial k and ε are
                                                                                                         similarly used in Refs. [38, 39, 40]. The average velocity in the
                      2. Numerical Formulation                                                          combustion chamber prior to spray injection is approximately
                                                                                                         0.7 m/s as provided in ECN [34]. This gas velocity is too low
                         and Setup                                                                       to cause a significant effect on the spray development as the
                                                                                                         spray velocity is 400-600 m/s. Therefore, the initial velocity
                                                                                                         field for all cases was set to be zero. A similar treatment of the
                      2.1. Mesh and Numerical                                                           initial velocity field can be seen in Ref. [39]. Soot radiation
                            Models                                                                       modeling was neglected in all test cases [41]. Collision and
                                                                                                         coalescence of the liquid spray were omitted in all studies as
                      The computational study was performed using the spray                              these processes have a negligible influence on the liquid and
                      combustion solver in an open-source code, OpenFOAM                                 vapor fuel penetration of the evaporating spray [42]. In
                      version 2.0.x [33]. Experimental data from the Sandia combus-                      addition, the Ranz-Marshall correlation [43] was implemented
                      tion vessel [34] was used for the model validation of the                          to calculate the droplet heat transfer with the surrounding
                      n-heptane spray and its combustion characteristics. Detailed                       gas-phase, while the Frossling correlation [44] was used to
                      descriptions of the experimental setup are available in [34].                      model the evaporation of droplet fuel. The skeletal n-heptane
                      The constant volume combustion vessels were represented by                         mechanism developed by Pang et al. [45] was implemented to
                      a cylinder during simulation studies. For computational expe-                      describe the chemical kinetics of n-heptane spray combustion.
                      diency, the cylindrical chamber was simplified to a 4-degree                       Details about the mechanism can be referred to in [45]. In this
                      axisymmetric wedge with a single layer of cells in the tangen-                     current study, the spray combustion solver was incorporated
                      tial direction. Details of the mesh and geometry can be found                      with an LST model [32]. The LST model is explained in detail
                      herein [32]. The time-step size was fixed at 0.2 μs. The non-                      in our previous study [32], but for completeness, the essential
                      reacting spray case was studied at an ambient temperature of                       features are outlined here.
                      1000 K and ambient density of 14.8 kg/m3 with the absence
                      of oxygen (0% O2 in ambient gas composition). As for the
                      reacting spray case, there were a total of four cases with two                     2.2. LST Model for Soot
                      O2 concentrations (15% and 12%) and two ambient densities
                      (14.8 kg/m3 and 30 kg/m3), while having the same initial
                                                                                                               Particles
                      ambient temperature of 1000 K. Cases with an ambient density                       The LST model treats soot particles as Lagrangian particles,
                      of 14.8 kg/m3 and 30 kg/m3 were henceforth addressed as                            and the particles are tracked via the Lagrangian method, in

                      TABLE 1 Experimental conditions for Sandia n-heptane test cases. Data taken from Ref. [34].
                      Spray                                                                Injection              Nozzle orifice          Injection pressure   Total fuel mass
                      configuration     Tam [K]        ρam [kg/m3]       O2 [%]            duration [ms]          diameter [mm]           drop [MPa]           [mg]
                      Non-reacting      1000           14.8               0                6.8                    0.1                     150                  17.8
© SAE International

                      Reacting          1000           14.8               15               6.8                    0.1                     150                  17.8
                                                                          12               6.8                    0.1                     150                  17.8
                                        1000           30.0               15               6.8                    0.1                     150                  18.0
                                                                          12               6.8                    0.1                     150                  17.8
                      Tam: ambient temperature; ρam: ambient density; O2 %: ambient oxygen concentration (in mole fraction).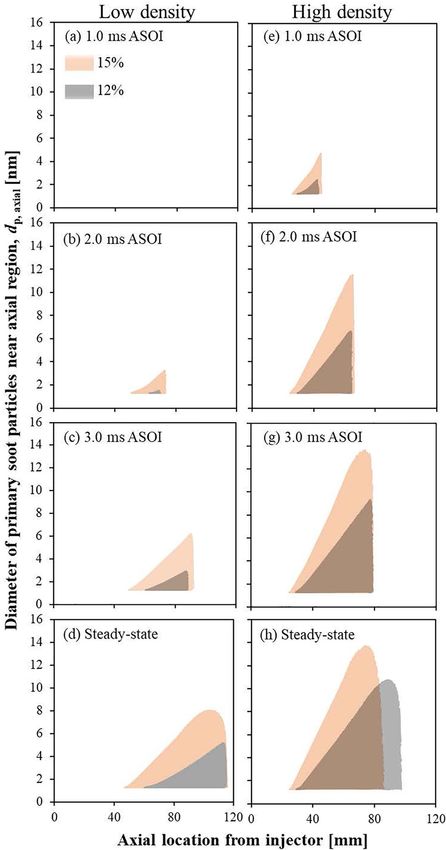
Downloaded from SAE International by Reprints Desk Document Delivery Account, Monday, March 22, 2021
4 Ong et al. / SAE Int. J. Engines / Volume 14, Issue 2, 2021
which the motion of the soot particles is computed using hydroxyl radicals (OH) and O2. The rate of change of the soot
Newton’s second law of motion. The dispersion of Lagrangian diameter due to surface growth is governed by Equation 4,
particles due to turbulence
is influenced by the instantaneous whereas the diameter change due to oxidation is given by
fluctuating velocity u′ [46, 47], which is modeled by the Equations 5 and 6.
discrete random walk model [46, 47]. It correlates with the
flow turbulent kinetic energy k predicted by the standard k − ε
d X P 1 Tγ
model and is expressed by ( di ) = α 2Csg sg exp − Eq. (4)
dt SG RT ρ soot T
1
u′ = ζ 2k / 3 1 Eq. (1) d X P T
1
( di ) = 2COH ηcoll OH Eq. (5)
dt ox via OH RT ρ soot
where ζ is a Gaussian random number [45, 46] with zero mean d XO P T TO
and unit variance. ( di ) = 2CO2 2 exp − 2 Eq. (6)
The LST model also considers the inception, surface
dt ox via O2 RT ρ soot T
growth, and oxidation processes of the soot particles. It is
important to note that the coagulation process is omitted in The mole fraction for the surface growth species is denoted
the LST model as the soot surface growth is the relatively as Xsg. The mole fractions for soot oxidants, OH and O2, are
dominant process in affecting the primary soot particle size represented by XOH and XO2, respectively. It is important to
[48, 49]. The inception, surface growth, and oxidation rates note that acetylene is chosen here as the surface growth species
in the LST model are adapted from the semi-empirical, multi- and soot precursor species. Although PAH is also an important
step Moss-Brookes (MB) soot model [50]. The MB soot model soot precursor. To accurately predict the formation of PAH, a
is chosen due to its flexibility in implementing different larger chemical mechanism that includes PAH formation
surface aging models, as shown in Ref. [51]. pathways is required, which will incur a higher computational
The inception rate ωinc is given by cost. Furthermore, there are numerous numerical studies of
soot formation in diesel spray flame that consider only acety-
X prec P Tinc lene as their soot precursor, e.g., Refs. [38, 55-57]. Therefore,
ωinc = Cinc M P exp − Eq. (2) only acetylene is chosen in this study as the soot precursor to
RT T achieve a balance between accuracy and computational effi-
where Xprec denotes the mole fraction of the soot precursor, ciency. Furthermore, a one-way coupling is assumed between
whereas Cinc is the model constant for soot incipient rate and the Lagrangian soot particles and the gaseous species. This
is given as 54 s−1. T, P, and R denote the gas temperature, implies that the gaseous species affects the Lagrangian soot
pressure, and universal gas constant, respectively. The activa- particles, but not the other way around. The soot model
tion temperature of soot inception Tinc is given as 21,000 K. constants, their descriptions, and values are shown in Table
The constant MP represents the mass of an incipient soot 2. The α in Equation 4 denotes the surface aging factor, which
particle, which is set to 1200 kg/kmol. In the LST model, is assumed to be a function of temperature and is expressed as
Lagrangian particles are formed when a formation criterion
in a computational cell is met. The formation criterion at cell 1 8168
α = tanh − 4.57 + 1 Eq. (7)
j is given as 2 T
m inc , j > m inc ,min Eq. (3)
TABLE 2 The soot model constants. Data taken from Refs.
where minc,j denotes the total incipient soot mass at cell j and [50, 52].
minc,min denotes the minimum mass of incipient soot. minc,j is Soot
calculated by taking the product of ωinc,j and the time step ∆t. model
Meanwhile, minc,min is calculated to be 2.0 × 10⁻²⁴ kg, based on constants Descriptions Value [unit]
the assumption that the minimum diameter of incipient soot Csg Surface growth rate 11,700 [kg m kmol−1 s−1]
is 1.24 nm [52], with the soot density of 2000 kg/m3 [52, 53]. scaling factor
The single formed Lagrangian particle is assumed to represent COH Model constant for soot 105.81 [kg m kmol−1
the total number of incipient soot particles in that particular oxidation due to OH K−0.5 s−1]
computational cell at that time instance. It is also assumed CO2 Model constant for soot 8903.51 [kg m kmol−1
that all particles formed in that cell, at that instant, follow the oxidation due to O2 K−0.5 s−1]
same pathway [54] and size change as the existing Lagrangian Tsg Activation temperature of 12,100 [K]
particle. The initial velocity of the new particle formed follows surface growth
© SAE International
the mean velocity of the cell it is formed in. TO2 Activation temperature of 19,778 [K]
The newly formed Lagrangian particles then undergo soot oxidation due to O2
mass addition and increase in size through the surface growth ηcoll Collision efficiency 0.13 [—]
process and decrease in size due to oxidation processes via parameter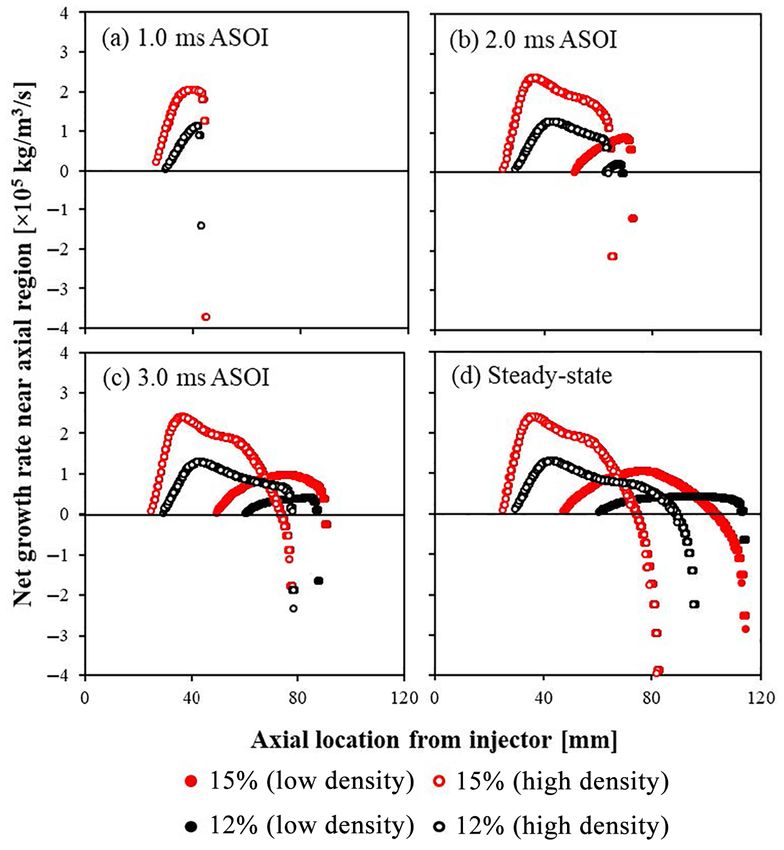
Downloaded from SAE International by Reprints Desk Document Delivery Account, Monday, March 22, 2021
Ong et al. / SAE Int. J. Engines / Volume 14, Issue 2, 2021 5
Once a Lagrangian soot particle is reduced below a mass is found, while the VPL is taken as the maximum
threshold diameter, it is assumed to be fully oxidized and is distance from the nozzle outlet to where the fuel mass fraction
removed from the computational cell. The threshold value is (or mixture fraction) is 0.1%. As for the LOL, it is defined as
set to 1.24 nm, which is the same as the initial incipient soot the first axial location of the Favre-averaged OH mass fraction,
particle size. which reaches 2% of its maximum value in the domain. The
time-averaging of the simulated LOL is carried out from 3.0
ms to 6.0 ms. This corresponds to the experimental definition.
3. Results and Discussion The IDT is defined as the time when the greatest rise of
dT
maximum temperature is observed, max , and this defi-
dt max
3.1. Validation of Numerical nition remains consistent throughout the study. Although
Models there are other definitions for the IDT, it is shown that there
is no significant discrepancy in the IDT between different IDT
The first part of this section compares the simulation results definitions [39]. Moreover, this definition is in accordance
of the non-reacting fuel spray against experimental measure- with the recommendation by the ECN [34].
ments, in terms of liquid (LPL) and vapor penetration (LPL)
lengths as well as radial profiles of the mixture fraction. This 3.1.1. Non-reacting Spray Simulations Compari-
is followed by the validation of the computed ignition delay sons between the computed and measured penetration
times (IDT) and lift-off lengths (LOL) of the reacting spray to lengths are depicted in Figure 1(a) using the default and
the experimental data [34]. The non-reacting and reacting calibrated model constant. In general, the tuned model
spray validation cases are carried out to ensure that the fuel-air shows an improved VPL and LPL prediction as compared to
distribution and combustion characteristics are reasonably the measurement. Computed and measured mean radial
simulated, and the uncertainties induced by these elements mixture fraction profiles are next compared in Figure 1(b).
can be minimized prior to studying the soot formation events. The overall trend of the mixture fraction profiles agrees with
The validation of the LST model is carried out by comparing the experimental data, which implies that the fuel-air distri-
the predicted SVF profiles with measured data during steady- butions are reasonably predicted by the model.
state combustion under different ambient conditions.
In the current work, the LPL is taken as the axial location 3.1.2. Reacting Spray Simulations Figure 2 shows
from the injector to the location where 99% of the total liquid the comparison of the experimental and predicted IDT/LOL
FIGURE 1 (a) Comparison of liquid and vapor penetration length for the non-reacting n-heptane spray case. (b) Comparison of
the simulated and experimental radial mixture fraction of the non-reacting n-heptane spray case at different axial locations and
time after injection.
100 0.25
Fuel penetration lengths (mm)
(a) (b)
Mixture fraction, Z [–]
VPL
80 0.2
60 0.15
40 0.1
20 0.05
LPL
0 0
0 1 2 3 0 2 4 6 8 10
Time [ms] Radial distance from spray axis
Measurement [mm]
Simulation with default parameters (Cs = 10.0, C1ε = 1.44) x = 17 mm, t = 0.49 ms (Simulation)
Simulation with tuned parameters (Cs = 11.5, C1ε = 1.53) x = 17 mm, t = 0.49 ms (Measurement)
© SAE International
x = 20 mm, t = 6.00 ms (Simulation)
x = 20 mm, t = 6.00 ms (Measurement)
x = 40 mm, t = 6.00 ms (Simulation)
x = 40 mm, t = 6.00 ms (Measurement)
Downloaded from SAE International by Reprints Desk Document Delivery Account, Monday, March 22, 2021

6           Ong et al. / SAE Int. J. Engines / Volume 14, Issue 2, 2021

 FIGURE 2 Comparison of the simulated ignition delay time                                       reaches a quasi-steady state at t ≥ 4 ms. Therefore, the pre-
and lift-off length for the reacting n-heptane spray cases with                                 dicted steady-state SVF using the LST model is obtained by
experimental results at different ambient oxygen levels and                                     time-averaging the computed SVF from 4 ms to 6 ms. In ad-
ambient densities. (Hollow symbols represent measured data;                                     dition, normalization is carried out by normalizing the sim-
Filled symbols represent simulation data.)                                                      ulated and measured SVF with their respective peak SVF at
                                                                                                15% O2 and 30.0 kg/m3 density. The normalized SVF profiles
                                                                                                for different O2 levels and ambient densities along the spray
                                                                                                axis are shown in Figure 4. The simulated SVF for the 12%
                                                                                                O2, 30.0 kg/m3 density case is underpredicted by approxi-
                                                                                                mately 30% relative to the measured data. At the low density
                                                                                                condition, the predicted SVF at 15% O2 is overpredicted by a
                                                                                                factor of two as compared to the measured result. The larger
                                                                                                discrepancy at 15% O2 is likely due to the underpredicted
                                                                                                LOL, which leads to less air entrainment into the spray and
                                                                                                subsequently higher soot formation (cf. Figure 2). Despite
                                                                                                these discrepancies, the predicted SVF using the LST model
                                                                                                is shown to increase with increasing O2 level and ambient
                                                                                                density, which corresponds with the experimental observa-
                                                                                                tion as depicted in Figure 4. The spatial location of the pre-
                                                                                                dicted SVF is further downstream than the measured SVF.
                                                                                                This can be attributed to the use of the Moss-Brookes soot
                                                                                                model in the formulation of the LST model, which is dis-
                                                                                                cussed in [32]. It is shown in Ref. [39] that considering the
                                                                                                surface-aging effect in the surface growth model can cause
                                                                                                the spatial location of the soot cloud to be more upstream.
                                                                                                Therefore, it is expected that implementing a more advanced
                                                                          © SAE International

                                                                                                surface-aging model than the one implemented in the pres-
                                                                                                ent study will likely improve the spatial prediction of the
                                                                                                LST model. Despite the overprediction, the LST model is
                                                                                                able to capture the variation of the spatial location of SVF
                                                                                                towards the upstream location of the spray as O2 level in-
                                                                                                creases and ambient density increases, which coincide with
for the reacting n-heptane spray cases at different O2 levels                                   the experimental observation (cf. Figure 4). It is important to
and ambient densities. At a low density, the predicted IDTs                                     note that a single simulation case using the LST model re-
correspond well with the measured IDT for 15% and 12% O2                                        quires approximately 170 hours to reach 6.0 ms after start of
levels with a maximum relative difference of 7.3%. A maxi-                                      fuel injection when running in serial on an HP Z200 Work-
mum relative difference of 17.5% is obtained for the predict-                                   station with Quad-Core Intel Xeon Processor 3400 at
ed IDT at a higher ambient density of 30.0 kg/m3. At a high                                     2.40 GHz.
density condition (30.0 kg/m3), the predicted LOLs at both O2
levels are within a relative difference of 7% as compared to the
experimental LOL. At a low density condition (14.8 kg/m3),
the predicted LOL at 12% O2 and 15% O2 are underpredicted                                       3.2. In the Spray Core Jet
by 6% and 20%, respectively. Nevertheless, the simulated
LOLs are shown to correspond well with the measured data                                        3.2.1. Sampling of Individual Lagrangian Soot
for all the reacting spray cases by capturing the LOL trend,                                    Particles The soot sampling experiment was conducted by
where the LOL increases with increasing ambient density                                         Aizawa and colleagues, in which full details of the experi-
and decreasing O2 levels.                                                                       mental methodology can be seen in Refs. [11-13]. For complete-
                                                                                                ness of the present article, only the essential steps are high-
3.1.3. Steady-State SVF Distribution In this section,                                           lighted here. The soot sampling experiment involves placing
the predicted SVF results using the LST model are compared                                      a probe in parallel to the spray axis to skim the gas containing
against the measured SVF for different O2 levels and ambient                                    soot from the spray flame while minimizing the flow distur-
densities. The experimental SVF is obtained from the time-                                      bance to the other half of the spray flame. As the reacting flow
averaged line-of-sight extinction (KL) data [34]. Predicted                                     passes the probe, soot particles are deposited onto the carbon-
SVF using the LST model is calculated based on the total                                        coated copper grid inside the probe via thermophoresis. The
number of Lagrangian soot particles in the domain. Figure 3                                     sampled soot particles correspond to the soot present at that
shows the temporal evolution of the number of Lagrangian                                        position. Sampled soot particles at different locations along
soot particles under different ambient densities and O2 levels.                                 the spray axis can be obtained by repeating the experiment
It is depicted in the figure that the number of soot particles                                  with the probe being at different locations along the spray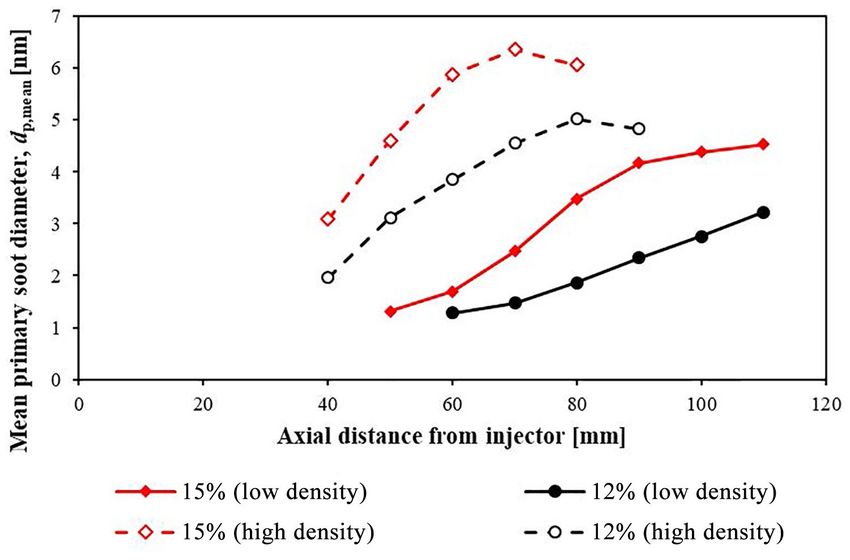
Downloaded from SAE International by Reprints Desk Document Delivery Account, Monday, March 22, 2021

 FIGURE 3         Temporal evolution of the number of computational particles for soot under different ambient densities and
oxygen levels.

                                                                             1.0E+5

                                   Number of particles [–]

                                                                             1.0E+4

                                                                             1.0E+3

                                                                             1.0E+2
                                                                                      0            1          2          3          4           5                 6     7
                                                                                                                          Time (ms)
             © SAE International

                                                                                                       15% O2, low density            12% O2, low density

                                                                                                       15% O2, high density           12% O2, high density

 FIGURE 4 Normalized SVF as a function of the axial distance from the injector at oxygen levels of 15% and 12% with ambient
densities of 14.8 kg/m3 (low density) and 30.0 kg/m3 (high density).

                                                                           1.2
                                     Normalized soot volume fraction [–]

                                                                            1

                                                                           0.8

                                                                           0.6

                                                                           0.4

                                                                           0.2

                                                                            0
                                                                                 0            20              40              60         80                 100        120
                                                                                                            Axial distance from injector [mm]

                                                                                 Simulation (15% O2, low density)                  Simulation (12% O2, low density)
             © SAE International

                                                                                 Simulation (15% O2, high density)                 Simulation (12% O2, high density)
                                                                                 Measurement (15% O2, low density)                 Measurement (12% O2, low density)
                                                                                 Measurement (15% O2, high density)                Measurement (12% O2, high density)

                                                                                                                                                                             7
Downloaded from SAE International by Reprints Desk Document Delivery Account, Monday, March 22, 2021
8 Ong et al. / SAE Int. J. Engines / Volume 14, Issue 2, 2021
axis. The sampled soot particles are then observed under a carried out in subsequent sections to obtain the primary soot
High-Resolution Transmission Electron Microscope. The size distribution and study its relation to soot processes.
diameter of each primary soot particle is finally obtained by
manually processing the TEM images. 3.2.2. Primary Soot Size Distribution The effect of
To replicate the same sampling technique along the spray ambient O2 and density on primary soot size distribution at
axis in our CFD studies, Lagrangian particles, which are the core of the spray jet for the n-heptane spray cases are in-
±1.5 mm axially and ±0.5 mm radially about the sampling vestigated here. The probability density function (PDF) of pri-
locations, are assumed to be deposited onto the sampler, and mary soot size for various ambient O2 levels and ambient den-
thus, their information is recorded. A similar analysis was sities cases are shown in Figure 5. It is observed that the onset
carried out in our previous work [32]. Information of the location of soot moves downstream as the O2 level d ecreases.
deposited Lagrangian particles, such as size, position, velocity, Soot is present at x = 50 mm for the 15% O2, low density case,
etc., are gathered from the start of ignition (SOI) to 6.0 ms while soot is only present further downstream at x = 60 mm for
after start of ignition (ASOI). The analysis of the information the 12% O2, low density case. This phenomenon is similarly
gathered for the individual Lagrangian particles is later captured in the high-density case (not shown in the figure).
FIGURE 5 Probability density function of the primary soot size predicted along various axial locations from the injector location
for different ambient oxygen level and density cases.
© SAE International
Downloaded from SAE International by Reprints Desk Document Delivery Account, Monday, March 22, 2021

                                                                                                     Ong et al. / SAE Int. J. Engines / Volume 14, Issue 2, 2021       9

The variation of soot onset location with the O2 level coin-                                               The results presented in Figures 5 and 6 are time-inte-
cides with the experimental observation in [58, 59, 60] and in                                        grated results of all the collected Lagrangian particles along
Section 3.1.3. Furthermore, Figure 5 also shows that, in all the                                      the core of the spray jet from the SOI to 6.0 ms ASOI. To gain
cases, the primary soot diameters increase as soot particles                                          a better insight into the effect of ambient O2 and density on
migrate downstream. This is caused by the soot undergoing                                             the primary soot size, the instantaneous primary soot size
surface growth process and is consistent with experimental                                            and the corresponding net growth rates experienced by the
observations [8, 9, 18].                                                                              soot particles are analyzed next. The temporal evolution of
     The mean primary soot diameter is computed from the                                              the net growth rates in all the cases is presented in Figure 7.
collected Lagrangian particles along the core of the spray jet                                        Moreover, their corresponding evolution of the primary soot
from the SOI to 6.0 ms ASOI and is shown in Figure 6. The                                             size distribution with respect to the axial distance is presented
mean primary soot size predicted at the O2 level of 15% and                                           in Figure 8.
ambient density of 30 kg/m3 is in reasonable agreement with                                                At low density (14.8 kg/m3), the maximum net growth
the measured mean primary soot size using n-dodecane fuel                                             rates in the 15% O2 and 12% O2 cases are 1 × 10⁵ kg/m3/s and
[61]. In the low density case, the mean primary soot size                                             0.25 × 10⁵ kg/m3/s, respectively. The span of the soot cloud in
reaches a peak value of approximately 4.5 nm and 3.2 nm for                                           the 12% O2 case is shorter than the 15% O2 case from 1.0 ms
O2 levels of 15% and 12%, respectively. As the ambient density                                        ASOI to the steady-state period, as depicted in Figures 7(a)-(d).
increases to 30.0 kg/m3, the peak value of the predicted mean                                         The evolution of the primary soot size is shown in Figure 8 to
primary soot size increases to 6.2 nm and 4.5 nm for oxygen                                           correspond to the net growth rates for the 15% O2 and 12%
levels of 15% and 12%, respectively. This implies that an                                             O2 cases, where a larger soot size is achieved in the former
increase in the ambient density resulted in the primary soot                                          case due to having higher net growth rates.
size to increase by a factor of 1.5. Furthermore, it is also                                               At high density, the net growth rates for the 15% O2 case are
evidently shown in Figure 6 that the mean primary soot size                                           higher than the 12% O2 case (cf. Figure 7). Contrary to that in
decreases with decreasing O2 levels. There have been no exper-                                        the low density case, the span of the soot cloud at both O2 levels
imental studies on the effect of ambient O2 and density on                                            is comparable to one another during the early ignition stage (t ≤
primary soot size in diesel spray flame for n-heptane fuel.                                           2 ms ASOI). However, the span of the soot cloud in the 12% O2
However, experimental studies on SVF have shown that                                                  case becomes longer than that in the 15% O2 case at later times
decreasing ambient O2 [58] and increasing ambient density                                             (t ≥ 3 ms ASOI). During the steady-state period, the span of the
[62] can increase the SVF in the diesel spray flame. In addition,                                     soot cloud for the 12% O2 case is 10 mm longer than that in the
measurement of the primary soot size in canonical flame                                               15% O2 case. The evolution of the primary soot size at high density
setups also showed similar findings regarding the effect of O2                                        condition shows a similar trend to the ones at the low density
[63] and ambient density [64, 65, 66] on primary soot sizes.                                          condition, where the primary soot size is larger for the 15% O2

 FIGURE 6 Mean primary soot size as a function of axial distance from the injector for different ambient oxygen level and
density cases. The filled symbols refer to low density cases; hollow symbols refer to high density cases.
                © SAE International
Downloaded from SAE International by Reprints Desk Document Delivery Account, Monday, March 22, 2021

10           Ong et al. / SAE Int. J. Engines / Volume 14, Issue 2, 2021

 FIGURE 7 Temporal evolution of the net growth rates at the core of the spray jet for different ambient oxygen levels and
density cases at different timings. The filled symbols refer to low density cases; hollow symbols refer to high density cases.

                                                                                                                                     © SAE International

(cf. Figure 8). In addition, increasing the ambient density while                 to the point where the maximal SVF is present at the soot
keeping the ambient O2 constant leads to an increase in primary                   onset time. From Table 3, it is shown that the soot onset time
soot sizes. This is likely due to the higher net growth rate achieved             and location increase as the O2 level decreases at both ambi-
at higher ambient density condition, as depicted in Figure 7.                     ent densities. Shorter soot onset time and a more upstream
                                                                                  soot onset location are obtained when the ambient density
3.2.3. Soot Age Distribution As the previous section                              increases. These results agree qualitatively with the experi-
has clearly demonstrated that the soot cloud span varies with                     mental and numerical findings in [59], which uses n-dodec-
different ambient conditions, it is expected that the longer                      ane as fuel.
span of the soot cloud would imply a longer soot residence                             Figure 9 shows the predicted temporal evolution of the
time in the spray flame. The use of the LST model allows the                      soot age distribution of the primary soot particles at the core
ability to analyze the residence time of soot in the spray flame                  of the spray jet with different ambient O2 levels and densities.
by tracking the soot particles from the time of formation to                      From 1.0 ms to 3.0 ms ASO, the soot age distributions at
the time of oxidation. The time duration of the soot particle                     different O2 levels and ambient densities are similar to one
from formation till oxidation is henceforth known as soot                         another. A narrower distribution is obtained in the 15% O2
age [67]. It is important to note that the transient analysis of                  case at high density as compared to the other cases at 4.0 ms
soot age is carried out after soot onset (ASO), where the soot                    ASO, which implies that the soot particles in the 15% O2, high
onset time and soot onset location are tabulated in Table 3.                      density case have a relatively shorter soot age than the
The soot onset time is defined here as the earliest time after                    other cases.
SOI when the total number of Lagrangian soot particles                                 It is mentioned in Section 3.2.2 that the soot cloud span
present in the domain are more than 100 particles. The soot                       for the 12% O2, low density case is shorter than the 15% O2,
onset location is taken as the axial distance from the nozzle                     low density case before reaching the steady-state period.
Downloaded from SAE International by Reprints Desk Document Delivery Account, Monday, March 22, 2021
FIGURE 8 Primary soot size distribution at the core of the spray jet for different ambient oxygen level and density cases.
(a)–(d) refer to low density cases and (e)–(f) refer to high density cases.
© SAE International
11Downloaded from SAE International by Reprints Desk Document Delivery Account, Monday, March 22, 2021
12 Ong et al. / SAE Int. J. Engines / Volume 14, Issue 2, 2021
TABLE 3 Soot onset time and onset location for different along the spray flame is shorter. Meanwhile, the soot onset
ambient oxygen levels and densities of n-heptane spray cases. location for the 12% O2 case is further downstream. The lower
flow velocity experienced by the soot particles consequently
Ambient Ambient Soot onset Soot onset leads to particles traveling more slowly through the
density [kg/m3] oxygen [%] time [ms] location [mm]
spray flame.
© SAE International
14.8 15 0.94 48 In the high density case, the 15% O2 case has a much
12 1.38 58 narrower soot age distribution at 4.0 ms ASO [cf. Figure 9(d)]
30.0 15 0.41 27 and a shorter soot cloud span than that in the 12% O2 case
12 0.57 30 during the steady-state period [cf. Figure 8(h)]. This observa-
tion can also be attributed to the soot onset location. The
soot onset location for both O2 levels is close to one another,
Despite having a shorter soot cloud span, the soot age distri- as shown in Table 3. This implies that the flow velocities
bution in Figure 9 shows no significant difference between experienced by the soot particles at both O2 levels are not
both O2 level cases. This can be explained by the difference significantly different. Therefore, the shorter soot cloud span
in the soot onset location in both cases. As mentioned earlier, in the 15% O2 case would yield a shorter soot age as predicted
the soot onset location for the 15% O2, low density case is in Figure 9(d). The results above also show that a longer soot
more upstream than the 12% O2 case (as shown in Table 3). cloud span does not necessarily equate to longer soot resi-
As the soot particles are formed nearer to the nozzle, the flow dence time. The residence time of the soot particles in a spray
velocity experienced by the soot particles is higher than the flame is dependent on both the soot cloud span and the soot
ones further downstream. Therefore, the time taken to travel onset location.
FIGURE 9 Soot age distribution of soot particles at the core of the spray jet for different ambient oxygen levels and densities at
different timing ASO. Solid lines refer to low density cases; dashed lines refer to high density cases.
© SAE InternationalDownloaded from SAE International by Reprints Desk Document Delivery Account, Monday, March 22, 2021
Ong et al. / SAE Int. J. Engines / Volume 14, Issue 2, 2021 13
4. Conclusion 3. Kazemimanesh, M., Moallemi, A., Olfert, J.S., and Kostiuk,
L.W., “Probe Sampling to Map and Characterize
Nanoparticles along the Axis of a Laminar Methane Jet
The effect of ambient O2 level and density on the prediction of Diffusion Flame,” Proc Combust Inst 36:881-888, 2017.
soot volume fraction (SVF) and soot size distribution is carried 4. Bockhorn, H., “Combustion Generated Fine Carbonaceous
out using a Lagrangian Soot Tracking (LST) method on Sandia Particles,” in Proceedings of an International Workshop, Villa
n-heptane spray cases. The simulated SVF for the 12% O2, 30.0 Orlandi, Anacapri, May 13-16, 2007 (KIT Scientific
kg/m3 density case is underpredicted by approximately 30% Publishing, 2009).
relative to the measured data. At low density condition, the
5. Schwartz, J., “Air Pollution and Daily Mortality: A Review
predicted SVF at 15% O2 is overpredicted by a factor of two. and Meta Analysis,” Environ Res 64:36-52, 1994.
Despite these discrepancies, the qualitative trend of the
measured SVF where the SVF increases with the increasing 6. European Parliament, Council of the European Union,
REGULATION (EC) No. 715/2007 OF THE EUROPEAN
O2 level and ambient density is captured by the simulated SVF.
PARLIAMENT AND OF THE COUNCIL of 20 June 2007
The peak primary soot size achieved in the core of the
on type approval of motor vehicles with respect to emissions
spray jet at an ambient density of 14.8 kg/m3 and O2 levels of
from light passenger and commercial vehicles (Euro 5 and
15% and 12% are 14 nm and 10 nm, respectively. Based on the Euro 6) and on access to vehicle repair and mai,” Off J Eur
primary soot size distribution in the core of the spray jet, an Union 2007; L171:1-16, OJEU 29.6.2007 L171.
increase in ambient density from 14.8 kg/m3 to 30 kg/m3 is
7. Le Coq, L., “Élimination Des Particules,” Tech l’Ingénieur
shown to increase the peak and mean primary soot size by a
33:20, 2006.
factor of 1.5. Furthermore, the peak and mean primary soot
size decrease with decreasing O2 levels from 15% to 12%. A 8. Kook, S. and Pickett, L.M., “Soot Volume Fraction and
higher O2 level and ambient density lead to a higher net Morphology of Conventional and Surrogate Jet Fuel Sprays
growth rate experienced by the soot particles, resulting in at 1000-K and 6.7-MPa Ambient Conditions,” Proc Combust
larger primary soot sizes. At low density condition, the soot Inst 33:2911-2918, 2011.
cloud span is shorter in the 12% O2 case as compared to that 9. Yamaguchi, T., Kondo, K., Nishigai, H., Takano, S. et al.,
in the 15% O2 case. On the contrary, the high density cases “Direct Sampling, TEM Analysis and Optical Measurement
show comparable soot cloud span for both O2 levels before the of Soot Particles at Different Axial Locations in a Transient
steady-state period. With the introduction of the soot age, the Spray Flame,” SAE Int. J. Fuels Lubr. 5(1):316-328, 2011,
present study shows that a longer span of the soot cloud does https://doi.org/10.4271/2011-01-2051.
not equate to a longer soot residence time in the spray flame. 10. Kondo, K., Yamaguchi, T., Nishigai, H., Takano, S. et al.,
Despite having different soot cloud spans, the soot age “High-Resolution Transmission Electron Microscopy of Soot
distributions at different O2 levels and ambient densities are Directly Sampled at Different Axial Locations in Diesel
similar to one another from 1.0 ms to 4.0 ms after soot onset Spray Flame,” SAE Technical Paper 2011-24-0068, 2011,
time. The reason for this is likely due to the soot onset location. https://doi.org/10.4271/2011-24-0068.
Soot particles that form upstream of the spray will experience 11. Aizawa, T., Nishigai, H., Kondo, K., Yamaguchi, T. et al.,
a higher flow velocity, thus leading to a shorter soot age when “Transmission Electron Microscopy of Soot Particles
the span of the soot cloud is short. Directly Sampled in Diesel Spray Flame - A Comparison
between US#2 and Biodiesel Soot,” SAE Int. J. Fuels Lubr.
5(2):665-673, 2012, https://doi.org/10.4271/2012-01-0695.
Acknowledgements 12. Aizawa, T., Takahata, N., Okabe, K., and Mizutani, Y.,
This research was conducted under the generous financial “Effect of Fuel Aromatics on In-Flame Diesel Soot
Nanostructure via HRTEM,” SAE Technical Paper 2015-01-
support from the University of Nottingham Malaysia Campus,
1829, 2015, https://doi.org/10.4271/2015-01-1829.
by providing the Dean’s Scholarship. JHW wishes to acknowl-
edge support from the Independent Research Fund Denmark 13. Kuribayashi, M., Ishizuka, Y., and Aizawa, T., “Sizing of Soot
under the grant number 8022-00143B. Particles in Diesel Spray Flame - A Qualitative Comparison
between TEM Analysis and LII/Scattering Laser
Measurements,” SAE Int. J. Fuels Lubr. 6(3):641-650, 2013,
https://doi.org/10.4271/2013-01-2576.
References 14. Kuribayashi, M., Mizutani, Y., Ishizuka, Y., Taki, N. et al.,
“Effects of Ambient Oxygen Concentration on Soot
1. Chen, L., Liang, Z., Zhang, X., and Shuai, S., “Characterizing Processes in Diesel Spray Flame - A Qualitative Comparison
Particulate Matter Emissions from GDI and PFI Vehicles between TEM Analysis and LII/Scattering Laser
under Transient and Cold Start Conditions,” Fuel 189:131- Measurements,” SAE Int. J. Fuels Lubr. 7:693-703, 2014,
140, 2017. https://doi.org/10.4271/2014-01-2642.
2. Liu, H., Ma, X., Li, B., Chen, L. et al., “Combustion and 15. Kook, S., Zhang, R., Szeto, K., Pickett, L.M. et al., “In-Flame
Emission Characteristics of a Direct Injection Diesel Engine Soot Sampling and Particle Analysis in a Diesel Engine,”
Fueled with Biodiesel and PODE/Biodiesel Fuel Blends,” Fuel SAE Int. J. Fuels Lubr. 6(1):80-97, 2013, https://doi.
209:62-68, 2017. org/10.4271/2013-01-0912.Downloaded from SAE International by Reprints Desk Document Delivery Account, Monday, March 22, 2021
14 Ong et al. / SAE Int. J. Engines / Volume 14, Issue 2, 2021
16. Zhang, R. and Kook, S., “Structural Evolution of Soot Proceedings of the Combustion Institute 37(4):5429-
Particles during Diesel Combustion in a Single-Cylinder 5436, 2019.
Light-Duty Engine,” Combust Flame 162:2720-2728, 2015. 31. Dellinger, N., Bertier, N., Dupoirieux, F., and Legros, G.,
17. Wang, Y., Liu, H., Li, T., Jiang, H. et al., “Characterization of “Hybrid Eulerian-Lagrangian Method for Soot Modelling
the Morphology and Nanostructure of the Soot Particles Applied to Ethylene-Air Premixed Flames,” Energy
Produced within Transient Diesel Reacting Jet Flame by 194:116858, 2020.
Using Thermophoretic Sampling Technique,” Energy & Fuels 32. Ong, J.C., Pang, K.M., Walther, J.H., Ho, J.-H. et al.,
33:9124-9137, 2019. “Evaluation of a Lagrangian Soot Tracking Method for the
18. Nerva, J.G., Yamaguchi, T., Iguma, H., Nishigai, H. et al., Prediction of Primary Soot Particle Size under Engine-Like
“Transmission Electron Microscopy of Soot Particles Conditions,” J Aerosol Sci 115:70-95, 2018.
Sampled Directly from a Biodiesel Spray Flame,” 33. Weller, H.G., Tabor, G., Jasak, H., and Fureby, C., “A
SAE Technical Paper 2011-01-2046, 2011, Tensorial Approach to Computational Continuum
https://doi.org/10.4271/2011-01-2046. Mechanics Using Object-Oriented Techniques,” Comput
19. Sakai, M., Iguma, H., Kondo, K., and Aizawa, T., Phys 12:620-631, 1998.
“Nanostructure Analysis of Primary Soot Particles Directly 34. ECN, “Engine Combustion Network 2020,” www.sandia.gov/
Sampled in Diesel Spray Flame via HRTEM,” SAE Technical ecn/, accessed 20 Aug. 2020.
Paper 2012-01-1722, 2012, https://doi.org/10.4271/2012-01-
35. Reitz, R.D. and Diwakar, R., “Effect of Drop Breakup on Fuel
1722.
Sprays,” SAE Trans. 1:218-227, 1986.
20. Jiang, H., Li, T., Wang, Y., He, P. et al., “The Evolution of Soot
36. Launder, B.E., and Spalding, D.B., “The Numerical
Morphology and Nanostructure along Axial Direction in
Computation of Turbulent Flows,” Comput Methods Appl
Diesel Spray Jet Flames,” Combust Flame 199:204-212, 2019.
Mech Eng 3:269-289, 1974, https://doi.org/10.1016/0045-
21. Frenklach, M., “Method of Moments with Interpolative 7825(74)90029-2.
Closure,” Chem Eng Sci 57:2229-2239, 2002.
37. Novella, R., García, A., Pastor, J.M., and Domenech, V., “The
22. Mueller, M.E., Blanquart, G., and Pitsch, H., “A Joint Role of Detailed Chemical Kinetics on CFD Diesel Spray
Volume-Surface Model of Soot Aggregation with the Method Ignition and Combustion Modelling,” Math Comput Model
of Moments,” Proc Combust Inst 32:785-792, 2009. 54:1706-1719, 2011.
23. Ito, T., Hosaka, T., Ueda, M., Senda, J. et al., “Detailed 38. Pang, K.M., Jangi, M., Bai, X.-S., and Schramm, J.,
Kinetic Modeling and Laser Diagnostics of Soot Formation “Investigation of Chemical Kinetics on Soot Formation Event
Process in Diesel Jet Flame,” SAE Trans. 113(4):602-613, of n-Heptane Spray Combustion,” SAE Technical Paper
2004, https://doi.org/10.4271/2004-01-1398. 2014-01-1254, 2014, https://doi.org/10.4271/2014-01-1254.
24. Naik, C.V., Puduppakkam, K.V., and Meeks, E., “Simulation 39. Pang, K.M., Jangi, M., Bai, X.-S., and Schramm, J.,
of Soot Volume Fraction and Size in High-Pressure Lifted “Evaluation and Optimisation of Phenomenological Multi-
Flames Using Detailed Reaction Mechanisms,” in ASME Step Soot Model for Spray Combustion under Diesel Engine-
Turbo Expo 2014 Turbine Tech Conf Expo, Düsseldorf, Like Operating Conditions,” Combust Theory Model 19:279-
Germany, 2014, V04BT04A025. 308, 2015.
25. Gelbard, F. and Seinfeld, J.H., “Simulation of 40. Varna, A., Wehrfritz, A., Hawkes, E.R., Cleary, M.J. et al.,
Multicomponent Aerosol Dynamics,” J Colloid Interface Sci “Application of a Multiple Mapping Conditioning Mixing
78:485-501, 1980. Model to ECN Spray A,” Proceedings of the Combustion
26. Gelbard, F., Tambour, Y., and Seinfeld, J.H., “Sectional Institute 37(3):3263-3270, 2019.
Representations for Simulating Aerosol Dynamics,” J Colloid 41. Skeen, S., Manin, J., Pickett, L., Dalen, K. et al.,
Interface Sci 76:541-556, 1980. “Quantitative Spatially Resolved Measurements of Total
27. Pope, C.J. and Howard, J.B., “Simultaneous Particle and Radiation in High-Pressure Spray Flames,” SAE Technical
Molecule Modeling (SPAMM): An Approach for Combining Paper 2014-01-1252, 2014, https://doi.org/10.4271/2014-01-
Sectional Aerosol Equations and Elementary Gas-Phase 1252.
Reactions,” Aerosol Sci Technol 27:73-94, 1997. 42. Jangi, M., D’Errico, G., Bai, X.-S., and Lucchini, T.,
28. Aubagnac-Karkar, D., Michel, J.-B., Colin, O., Noël, L. et al., “Numerical Simulation of the ECN Spray A Using
“A Sectional Soot Model for RANS Simulation of Diesel Multidimensional Chemistry Coordinate Mapping:
Engines,” SAE Technical Paper 2014-01-1590, 2014, https:// n-Dodecane Diesel Combustion,” SAE Technical Paper
doi.org/10.4271/2014-01-1590. 2012-01-1660, 2012, https://doi.org/10.4271/2012-01-1660.
29. Aubagnac-Karkar, D., Michel, J.-B., Colin, O., Vervisch- 43. Ranz, W.E. and Marshall, W.R., “Evaporation from Drops,”
Kljakic, P.E. et al., “Sectional Soot Model Coupled to Chem Eng Prog 48:141446, 1952.
Tabulated Chemistry for Diesel RANS Simulations,” 44. Frossling, N., “Evaporation, Heat Transfer, and Velocity
Combust Flame 162:3081-3099, 2015. Distribution in Two-Dimensional and Rotationally
30. Gallen, L., Felden, A., Riber, E., and Cuenot, B., “Lagrangian Symmetrical Laminar Boundary-Layer Flow,” DTIC
Tracking of Soot Particles in LES of Gas Turbines,” Document, 1956.Downloaded from SAE International by Reprints Desk Document Delivery Account, Monday, March 22, 2021
Ong et al. / SAE Int. J. Engines / Volume 14, Issue 2, 2021 15
45. Pang, K.M., Ng, H.K., and Gan, S., “Development of an 57. Chishty, M.A., Bolla, M., Hawkes, E.R., Pei, Y. et al., “Soot
Integrated Reduced Fuel Oxidation and Soot Precursor Formation Modelling for n-Dodecane Sprays Using the
Formation Mechanism for CFD Simulations of Diesel Transported PDF Model,” Combustion and Flame 192:101-
Combustion,” Fuel 90:2902-2914, 2011. 119, 2018.
46. Kitanidis, P.K., “Particle-Tracking Equations for the Solution 58. Idicheria, C.A. and Pickett, L.M., “Soot Formation in Diesel
of the Advection-Dispersion Equation with Variable Combustion under High-EGR Conditions,” SAE Trans.
Coefficients,” Water Resour Res 30:3225-3227, 1994. 114(4):1559-1574, 2005, https://doi.org/10.4271/2005-01-3834.
47. Zhang, Z. and Chen, Q., “Comparison of the Eulerian and 59. Cenker, E., “Imaging Measurements of Soot Particle Size and
Lagrangian Methods for Predicting Particle Transport in Soot Volume Fraction with Laser-Induced Incandescence at
Enclosed Spaces,” Atmos Environ 41:5236-5248, 2007. Diesel Engine Conditions,” PhD thesis, Ecole Centrale
48. Bolla, M., Wright, Y.M., Boulouchos, K., Borghesi, G. et al., Paris, 2014.
“Soot Formation Modeling of n-Heptane Sprays under Diesel 60. Pandurangi, S.S., Bolla, M., Wright, Y.M., Boulouchos, K.
Engine Conditions Using the Conditional Moment Closure et al., “Onset and Progression of Soot in High-Pressure
Approach,” Combustion Science and Technology 185(5):766- n-Dodecane Sprays under Diesel-Engine Conditions,”
793, 2013. Int J Engine Res. 18(5-6):436-452, 2017.
49. Haynes, B.S. and Wagner, H.G., “The Surface Growth 61. Kook, S., Zhang, R., Chan, Q.N., Aizawa, T. et al., “Automated
Phenomenon in Soot Formation,” Zeitschrift für Detection of Primary Particles from Transmission Electron
Physikalische Chemie 133(2):201-213, 1982. Microscope (TEM) Images of Soot Aggregates in Diesel
50. Brookes, S.J. and Moss, J.B., “Predictions of Soot and Engine Environments,” SAE Int. J. Engines 9(1):279-296, 2016,
Thermal Radiation Properties in Confined Turbulent Jet https://doi.org/10.4271/2015-01-1991.
Diffusion Flames,” Combust Flame 116:486-503, 1999. 62. Pickett, L.M. and Siebers, D.L., “Soot in Diesel Fuel Jets:
51. Ong, J.C., “Development of Lagrangian Soot Tracking Effects of Ambient Temperature, Ambient Density, and
Method for the Study of Soot Morphology in Diesel Spray Injection Pressure,” Combust Flame 138:114-135, 2004.
Combustion,” Ph.D. thesis, University of Nottingham, 2017. 63. Oh, K.C. and Shin, H.D., “The Effect of Oxygen and Carbon
52. Leung, K.M., Lindstedt, R.P., and Jones, W.P., “A Simplified Dioxide Concentration on Soot Formation in Non-premixed
Reaction Mechanism for Soot Formation in Nonpremixed Flames,” Fuel 85:615-624, 2006.
Flames,” Combust Flame 87:289-305, 1991. 64. Vargas, A.M. and Gülder, Ö.L., “Pressure Dependence of
53. Vishwanathan, G. and Reitz, R.D., “Development of a Primary Soot Particle Size Determined Using
Practical Soot Modeling Approach and Its Application to Thermophoretic Sampling in Laminar Methane-Air
Low-Temperature Diesel Combustion,” Combust Sci Technol Diffusion Flames,” Proc Combust Inst 36:975-984, 2017.
182:1050-1082, 2010. 65. Amin, H.M.F. and Roberts, W.L., “An Experimental
54. Katta, V.R., Blevins, L.G., and Roquemore, W.M., “Dynamics Apparatus to Measure Soot Morphology at High Pressures
of an Inverse Diffusion Flame and Its Role in Polycyclic- Using Multi-Angle Light Scattering,” Meas Sci Technol
Aromatic-Hydrocarbon and Soot Formation,” Combust 30:75902, 2019.
Flame 142:33-35, 2005. 66. Amin, H.M.F. and Roberts, W.L., “Investigating Soot
55. Pei, Y., Som, S., Pomraning, E., Senecal, P.K. et al., “Large Parameters in an Ethane/Air Counterflow Diffusion
Eddy Simulation of a Reacting Spray Flame with Multiple Flame at Elevated Pressures,” Combust Sci Technol
Realizations under Compression Ignition Engine 1-16, 2020.
Conditions,” Combustion and Flame 162(12):4442-4455, 2015. 67. Singh, J., Balthasar, M., Kraft, M., and Wagner, W.,
56. Fernandez, S.F., Paul, C., Sircar, A., Imren, A. et al., “Soot and “Stochastic Modeling of Soot Particle Size and Age
Spectral Radiation Modeling for High-Pressure Turbulent Distributions in Laminar Premixed Flames,” Proc Combust
Spray Flames,” Combustion and Flame 190:402-415, 2018. Inst 30:1457-1465, 2005.
© 2021 SAE International. All rights reserved. No part of this publication may be reproduced, stored in a retrieval system, or transmitted, in any form or by any means,
electronic, mechanical, photocopying, recording, or otherwise, without the prior written permission of SAE International.
Positions and opinions advanced in this work are those of the author(s) and not necessarily those of SAE International. Responsibility for the content of the work lies
solely with the author(s).You can also read