Numerical investigation of the fluid structure acoustics interaction on a simplified car model - EDP ...
←
→
Page content transcription
If your browser does not render page correctly, please read the page content below
Acta Acustica 2021, 5, 22
Ó K. Nusser & S. Becker, Published by EDP Sciences, 2021
https://doi.org/10.1051/aacus/2021014

                                                                                                                        Available online at:
                                                                                                         https://acta-acustica.edpsciences.org

 TECHNICAL & APPLIED ARTICLE

Numerical investigation of the fluid structure acoustics interaction
on a simplified car model
Katrin Nusser* and Stefan Becker
Friedrich-Alexander University Erlangen-Nürnberg, Institute of Process Machinery and Systems Engineering (iPAT),
Cauerstr. 4, 91058 Erlangen, Germany

            Received 28 September 2020, Accepted 24 March 2021

            Abstract – Part of vehicle interior noise is caused by the complex turbulent flow field behind the a-pillar and
            side mirror. It excites the structure of the side window, which radiates noise into the interior. Both aerodynamic
            pressure excitation and acoustic sound sources in the flow play an important role. In this work, the influence of
            both excitation mechanisms is investigated numerically in a hybrid simulation on a simplified car geometry.
            The generic model allows for an exact definition of boundary conditions and good reproducibility of simulation
            results. An incompressible Large-Eddy-Simulation (LES) of the flow is conducted, from which acoustic source
            terms within the flow field and transient fluid forces acting on the surface of the side window are extracted.
            This data is used in a coupled vibroacoustic and aeroacoustic simulation of the structure and passenger cabin
            of the vehicle. A finite element (FE) approach is used for the simulations and detailed modeling of the structure
            and the influence of interior absorption properties is emphasized. The computed excitation on the side window
            and the interior noise levels are successfully validated by using experimental data. The importance and contri-
            bution of both aerodynamic and acoustic pressure excitation to the interior sound level are determined.

1 Introduction                                                              Many studies investigate isolated objects, like a simplified
                                                                            mirror model mounted on a flat plate or other wall-mounted
    Reducing interior noise levels to improve driver and                    obstacles. Numerical and experimental investigations were
passenger comfort has gained increasing importance for                      conducted for example by Siegert et al. [2], Becker et al.
researchers and acoustic engineers in the automotive                        [3], Ask and Davidson [4] and Schäfer et al. [5]. Other
industry. Since last-minute structural and design changes                   research was done on the flow around simplified car models,
due to acoustic uncertainties are costly, it is necessary to                for example by Krajnovic and Davidson [6] and Aljure et al.
be able to predict interior acoustics in an early development               [7]. Many authors investigated the separation of aerody-
phase.                                                                      namic wall-pressure fluctuations and acoustic pressure
    A significant contribution to the interior noise levels                  fluctuations on the side window and their influence on the
stems from the flow behind the side view mirror and the                      interior sound level [8]. The experimental approaches rely
a-pillar [1]. The highly turbulent flow field in this area is                 for example on wavenumber filtering on the surface, as done
characterized by velocity and pressure fluctuations with                     by Arguillat et al. [1] and Van Herpe et al. [9]. In recent
widely varying length scales. These fluctuations include                     years, many numerical investigations of the problem were
sound sources present in the flow field and sound generated                   conducted, using different methods for sound calculation.
by the interaction of the flow with solid surfaces. A combi-                 Mendonca et al. [10] simulated the fully compressible flow
nation of acoustic pressure and aerodynamic wall-pressure                   around a simplified car model and used vibroacoustic and
fluctuations excite the flexible structure of the side window,                aeroacoustic methods to compute the sound pressure level
leading to sound radiation into the interior. Both parts of                 in the interior. Similar investigations were also done on real
the pressure differ in length scale, wave number, and energy                car models, for example by Schell and Cotoni [11, 12], who
content due to the disparity of scales. Therefore, they also                used a hybrid approach consisting of an incompressible Com-
cause different vibration characteristics of the structure,                 putational Fluid Dynamics (CFD) simulation, frequency
which will be examined in this work.                                        domain finite element computations and a statistical energy
    Different analytical, experimental and numerical                        analysis (SEA) model for the interior cabin.
methods have been applied to investigate the mechanisms                         In the present work, the phenomenon of flow-induced
of wind-induced noise radiation into the interior of a car.                 noise is investigated numerically on the example of the
                                                                            SAE body, a simplified car model, with an added side view
*Corresponding author: katrin.nusser@fau.de                                 mirror. The workflow to assess this structural-acoustic
This is an Open Access article distributed under the terms of the Creative Commons Attribution License (https://creativecommons.org/licenses/by/4.0),
              which permits unrestricted use, distribution, and reproduction in any medium, provided the original work is properly cited.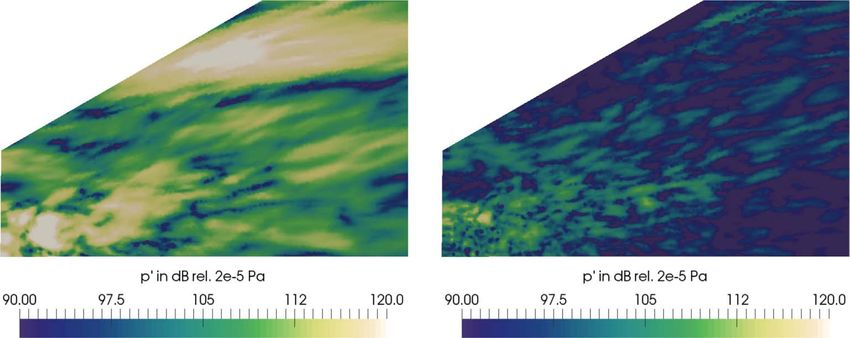
2                                    K. Nusser and S. Becker: Acta Acustica 2021, 5, 22

coupling encompasses a large eddy simulation (LES) of the          2 Methods
turbulent flow field around the car model, as well as aeroa-
coustic and vibroacoustic methods to predict the sound                 A hybrid simulation approach [13] is used in this work
propagation outside and inside the car. For the simulations        to ensure that an optimal discretization and solution
of structural dynamics and linear acoustics, the underlying        process can be selected for the underlying physical problem.
basic equations are numerically solved in the frequency            The incompressible, turbulent flow field is solved by the
domain, using an finite element (FEM) approach. No statis-          CFD software FASTEST-3D [16], which is based on a finite
tical or integral methods are employed in this work.               volume approach. The aero-acoustic and vibroacoustic sim-
Between flow and acoustics, a hybrid simulation scheme              ulations are conducted by the FEM solver CFS++ [17].
is used. One part of the coupling approach is based on             The latter simulations are executed in the frequency
aeroacoustic sound sources calculated from the flow field            domain to incorporate impedance boundary conditions for
at simulation time [13]. From these, the acoustic field on          the interior acoustic simulations and frequency-dependent
the outside of the car, the structural excitation of the side      mechanical damping of the structure. Therefore, data
window due to loading by acoustic pressure, and the acous-         from the CFD simulation had to be transformed into the
tic field on the inside of the SAE body are computed. The           frequency domain using Fast-Fourier Transformation
second coupling path investigates the excitation of the side       (FFT) before the coupling.
window by aerodynamic pressure loading and the resulting               To reproduce the different characteristics of aerody-
radiation of sound into the interior. Both excitation paths        namic and aeroacoustic pressure fluctuations in the simula-
are investigated separately. With this method, the influence        tions and to investigate their influence on the interior sound
of acoustic and aerodynamic pressure fluctuations on the            levels, two separate excitation paths are investigated. The
excitation of the structure is determined and their respec-        aerodynamic excitation path is based on pressure fluctua-
tive contribution to the interior sound level is quantified.        tions caused by the incompressible turbulent flow field.
    All investigations focus on the frequency range                These are exported from the CFD simulation and mapped
between 100 Hz and 2500 Hz. This frequency range is highly         onto the structure as pressure loading. The second excita-
relevant since it dominates the overall SPL in the interior.       tion path by acoustic pressure is based on acoustic source
A focus was placed on the close reproduction of the exper-         terms in the turbulent flow. They are computed by the
imental setup, especially in terms of the vibration behavior       CFD solver, interpolated onto the CAA grid, and subse-
of the side window and acoustical damping in the interior          quently used to calculate the acoustic wave propagation
cabin. From previous works, extensive experimental results         outside the car. A two-way coupling approach is employed
for this model are available, including surface pressure,          between the structure of the side window and the acoustic
microphone and laser-scanning vibrometer measurements              fields on the outside and inside of the SAE body. Both types
[14, 15]. Therefore, all major simulation steps are validated      of pressure loading lead to a vibration of the structure,
by experimental results.                                           which radiates sound into the interior of the car model.
    This study shows that it is possible to accurately deter-      The resulting sound field in the cabin is dependent on its
mine the SPL inside a car model at an early stage in the           geometry and the amount of damping due to acoustic
development process. The numerical methods used are solely         absorption materials.
based on the respective governing equations, without                   The instantaneous flow field is computed based on the
employing additional modeling approaches. This makes a             incompressible Navier-Stokes equations for Newtonian
high spatial and temporal resolution of the underlying phys-       fluids. These equations describe the conservation of mass
ical phenomena possible. Additionally, it was discovered           (1) and momentum (2):
that a close characterization of the vibration properties of
                                                                                                    oui
the structure and the acoustic damping in the interior cabin                                            ¼ 0;                         ð1Þ
is crucial for accurately reproducing the interior sound field                                       oxi
in the investigated frequency range. Since the influence of
aerodynamic and aeroacoustic pressure fluctuations is inves-                    ouj oðui uj Þ            op          o oui ouj
                                                                      q0          þ                ¼        q0 m        þ      :   ð2Þ
tigated separately, it is also possible to quantify the individ-               ot    oxi                oxj        oxi oxj oxi
ual contribution of each transfer paths on the resulting
interior sound pressure level, which can be used to motivate       The gravitational forces are neglected in this case. Here, ui
constructional changes during the car development process.         denotes the velocity components in the coordinate directions
    This paper is organized as follows: we begin with a short      xi, q0 is the constant density of the fluid, m the kinematic
description of the employed methods and then present the           viscosity, p the flow pressure, and t the time. To account
setup of the experiment, as well as CFD and FEM simula-            for turbulence in the flow, a large eddy simulation (LES)
tions. In the next section, we discuss the simulated flow field      with a Smagorinsky subgrid-scale model is used. It was
and compare the different contributions to the overall             shown in previous work [18, 19] that this turbulence model-
excitation of the side window. We also analyze the influence        ing approach is best suited to capture the small turbulent
of the interior configuration of the model and compare the          structures which occur around the simplified car model.
results to experimental data. Finally, we give concluding              In the acoustic regions, the propagation of sound is
remarks concerning the results and the applicability of the        calculated based on the perturbed convective wave
employed methods.                                                  equation (PCWE) [20–22]: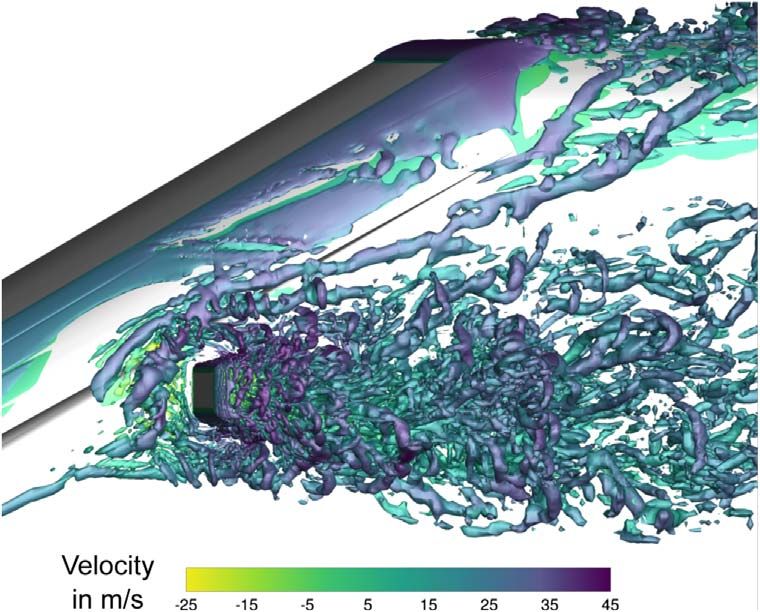
K. Nusser and S. Becker: Acta Acustica 2021, 5, 22                                         3

  1 D2 Ua         a        1 Dph                            DUa       sufficient sound insulation and to limit the influence of
           r  rU  ¼                       with pa ¼ q0       :
  c20 Dt2               c20 q0 Dt                            Dt       other sound transmission paths. Additionally, a spring-
                                                                      mass system was mounted on the interior walls of the
                                                                ð3Þ
                                                                      model. It was proven by measurements that the acoustical
Here, Ua denotes the acoustic scalar potential, pa is the             insulation of the model is effective for frequencies above
acoustic part of the pressure, ph is the incompressible,              100 Hz [14]. The dimensions of the side window were similar
                                                                      to real side windows used in passenger cars. It consisted of a
aerodynamic part of the pressure, and Dt D
                                           ¼ oto þ ui oxo i is the    glass plate with a thickness of 3 mm and was fixed to a
substantial derivative. The acoustic source term constitutes          wooden frame using silicone at every edge over a length
the right-hand side of the equation and is calculated by              of 30 mm. The corners of the frame were also connected
evaluating the material derivative of the flow pressure in             by silicone without any screws. The window lay swimming
the incompressible CFD simulation. This formulation was               in a bed of sealing material and gaps between model and
chosen since it includes the separation of acoustic and               window were sealed and closed by tape. The mounting of
aerodynamic pressure in the source region. By using the               the window into the body was designed to limit transmis-
acoustic potential instead of the acoustic pressure formula-          sion of structure-borne sound.
tion, only the first temporal derivative of the flow pressure               Additionally, the interior absorption properties of a
has to be calculated for the source term, making it less              series production car were replicated in the model. To this
sensitive to numerical noise in the flow field [20].                    end, different absorbing materials were mounted on the
    At the interfaces between mechanical and acoustic                 walls of the interior cabin. Porous absorbers with a thick-
regions, the wall-normal component of the velocity of the             ness of 30 mm were attached to the interior walls and the
solid ui must be equal to the wall-normal component of                roof. A thin felt carpet was placed on the floor. By using
the acoustic particle velocity uai :                                  these absorbing materials, a reverberation time comparable
                          ui ni ¼ uai ni :                      ð4Þ   to real cars was achieved [24].
                                                                          The experimental measurements were performed under
Since acoustic and mechanical computation are conducted               semi-free field conditions in the acoustic wind tunnel of the
simultaneously, the influence of the exterior and interior             BMW group (see Fig. 2), which has a lower cut-off
acoustic pressure on the structural displacement is consid-           frequency of 50 Hz [25]. Five 1/200 free-field condenser micro-
ered. The pressure load on the structure is included as               phones were employed for the sound measurements in the
mechanical stress rn on the surface:                                  interior cabin, e.g. at the position of the driver’s ear facing
                                                                      the side window. To investigate the correlation of different
                          rn ¼ ni pa :                         ð5Þ   pressure fluctuations at the surface, 39 piezo-resistive pres-
                                                                      sure transducers were evenly distributed on the side window.
Both coupling conditions (4) and (5) have to be fulfilled at           The sensors were inserted into drill holes in an aluminum
the interfaces between the acoustic and mechanical regions.           plate and mounted flush with the surface.
                                                                          Phase-resolved laser-scanning vibrometer measurements
                                                                      were carried out to identify the vibration modes of the side
3 Model setup                                                         window. For this purpose, a single-point laser Doppler
    The outer geometry of the simplified car model which is            velocimeter was used together with a scanning vibrometer
used in this work is identical to the SAE Type 4 body [23].           to observe the flexural modes of the glass plate at different
A side mirror with square cross section is attached to the            frequencies. This measurement yielded amplitude and
model, as shown in Figure 1.                                          phase of the window vibration at each node of the measure-
    This generic, idealized model was designed to reduce the          ment grid, which involved 1624 uniformly distributed
complexity of a real car and to focus on distinct regions of          measuring positions.
interest. It is well suited to investigate the propagation of
flow-induced noise into the interior. The whole model is               3.2 CFD simulation
assumed to be acoustically insulated, such that noise can
only be transmitted through the side window. With the                     The incompressible, three-dimensional flow field around
experimental model, this was proven to be valid for frequen-          the simplified car model was computed using the in-house
cies larger than 100 Hz [14]. The area of the side window is          CFD code FASTEST-3D [16]. It is based on a finite volume
therefore the main region of interest for the simulations.            approach and uses block-structured, co-located meshes to
The general aerodynamic, but also the aero- and vibroa-               solve the transient, incompressible Navier-Stokes equations.
coustic properties of the physical model are reproduced in                The outer dimensions of the SAE body in the CFD
detail by the simulations to ensure that their results are            simulation were identical to the physical model in Figure 1.
comparable to experimental data.                                      To reduce the computational effort, a half body grid was
                                                                      used and symmetry in the span-wise direction assumed. It
3.1 Experimental setup                                                was proven in precursor simulations that this boundary
                                                                      condition has no major influence on the flow in the area
   The experimental model was constructed using sand-                 of the side window. The computational domain measured
wich elements composed of wood and heavy layers to ensure             20.7 m in length, 5.8 m in width, and 7.0 m in height.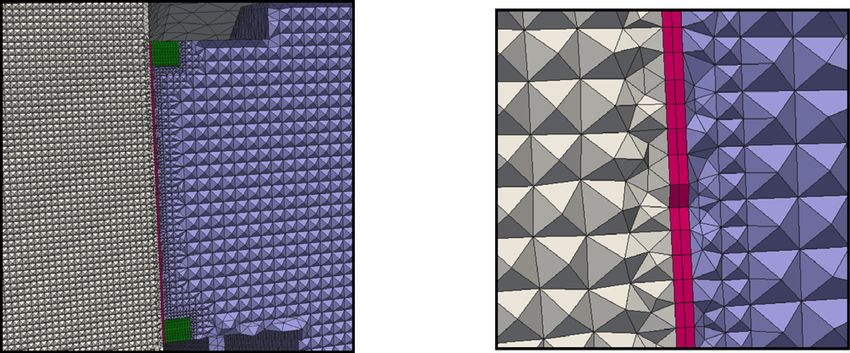
4                                   K. Nusser and S. Becker: Acta Acustica 2021, 5, 22

                                                   250

                                               445

                                                                                                          1400
                                              30
                                        673

                                                                                                        200
                                              3762.87                                    1600

Figure 1. Schematic drawing of the dimensions of the simplified car model with units in mm.

                                                                  and stored on the CFD grid. The computational grids of
                                                                  CFD and CAA simulations differed in dimensions and
                                                                  spatial resolution. Therefore, a conservative interpolation
                                                                  approach [26] is implemented to ensure an interpolation
                                                                  of the coupled quantities from the fine to the coarser grid
                                                                  without loss of information. To limit the influence of sound
                                                                  sources outside the region of interest and to prevent the
                                                                  creation of spurious sources, an additional blending func-
                                                                  tion was applied to the source terms. Outside the vicinity
                                                                  of the side window, the source terms were assumed to be
                                                                  equal to zero.

                                                                  3.3 Aero-acoustic and vibro-acoustic model

Figure 2. Simplified car model in acoustic wind tunnel [15].           The coupled aeroacoustic and vibroacoustic simulation
                                                                  was realized by using the software CFS++ [17], which is
                                                                  based on the finite element method. It simultaneously
The SAE body was placed 5.6 m upstream from the inlet.            computed the sound propagation outside the model, the
On the top, bottom and outer channel wall, a slip boundary        mechanical displacement of the side window due to acoustic
condition was imposed. A convective outlet boundary               or aerodynamic pressure loading, and the resulting sound
condition was used to prevent pressure fluctuations due            radiation into the interior cabin.
to reflections at the outlet. At the inlet, a free stream veloc-       The simulation domain is depicted in Figure 3. It
ity of u0 = 100 km/h was defined as a block profile with no         includes three distinct regions: the outside of the SAE body,
additional synthetic turbulence. This simplification had no        the interior cabin and the side window with coupling inter-
influence on the flow field behind the side mirror since the         faces on both sides. The first two are acoustic regions, the
turbulence generated by the obstacle was much more pro-           side window is modeled as a flexible structure. The outside
nounced. The flow was characterized by a Reynolds number           acoustic domain is surrounded by a perfectly matched layer
of 1.47  105 based on the mirror height.                         (PML) [27] to damp the acoustic pressure to zero and to
    The flow domain was discretized using a block-                 prevent reflections at the domain boundaries. For these
structured grid with a total size of 96.7 M hexahedral            simulations, a full model of the SAE body was used, since
control volumes. A fine near-wall resolution was achieved          the interior acoustic field cannot be assumed to be symmet-
with the help of o-grids, which resulted in an average dimen-     ric. The outer surface of the SAE body and the floor of
sionless distance of the first grid cell off the wall of y+ < 1.   the domain were modeled as acoustically hard walls. The
    In the incompressible flow simulation with FASTEST-            outer and inner surfaces of the side window constituted
3D, a large eddy simulation (LES) with a Smagorinsky              coupling interfaces between acoustic and mechanical
subgrid-scale model was used in combination with a van            regions. A conformal mesh was chosen at the interfaces,
Driest damping in the near-wall area. The Smagorinsky             such that no additional interpolation was necessary
constant was set to 0.1. A central differencing scheme was        between the different domains.
employed for the discretization in space. Time advancement            In the experimental setup, the side window consisted of
was realized via an implicit Crank-Nicolson scheme with a         a glass plate with a thickness of 3 mm mounted on a
time step of 1.0  106 s, resulting in a Courant-Friedrichs-     wooden frame that was inserted into the SAE body. This
Lewy (CFL) number of 0.5. For velocity-pressure coupling,         setup was optimized to limit the possible sound transmis-
a predictor-corrector scheme was used.                            sion paths to the free surface of the window. Since no screws
    The acoustic source terms were computed from the              were used for mounting, the boundary conditions for the
incompressible pressure ph during the CFD simulation              simulation were not clearly defined. Therefore, an iterative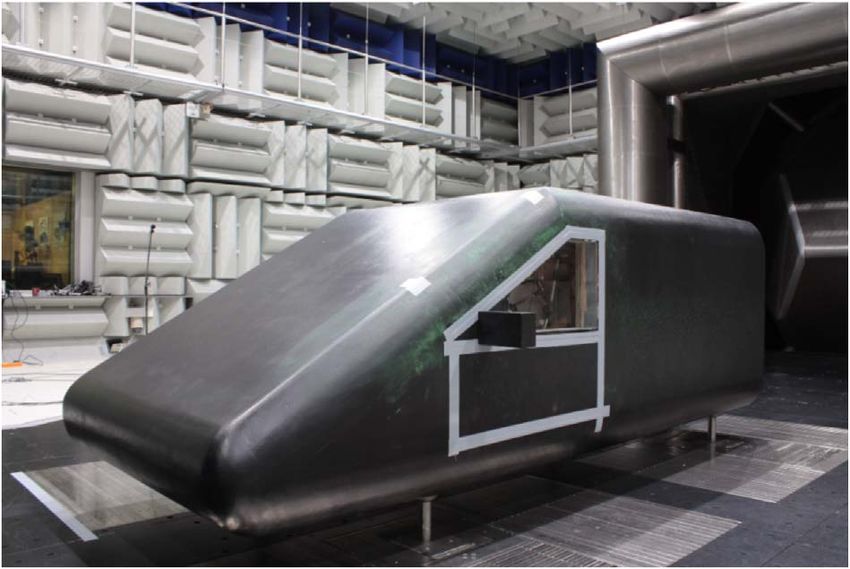
K. Nusser and S. Becker: Acta Acustica 2021, 5, 22                                            5

                                                                 Table 1. Material properties of structural mechanics regions.

                                                                 Region        Density        Young’s modulus         Poisson’s
                                                                              in kg/m3             in Pa              number
                                                                 Glass          2500              70  109              0.22
                                                                 Frame           900              85  105              0.45

                                                                 and b denoting the mass and stiffness related damping
                                                                 respectively, were determined for different frequencies x
                                                                 through experimental eigenmode analysis. Additional
                                                                 simulations showed, that using different damping factors
                                                                 for different frequencies only resulted in minor changes in
                                                                 the mechanical excitation. Therefore, a constant damping
                                                                 factor of n = 0.015 was applied for all frequencies in the
Figure 3. Schematic drawing of the simulation domain.            investigated frequency range.
                                                                     The computational domain was discretized using
                                                                 tetrahedral cells with 3.0 M nodes in total. The source
                                                                 region was meshed with a maximum element size of
                                                                 15 mm and was refined to 4 mm in the direct vicinity of
                                                                 the side window (see Fig. 5). The inside of the cabin also
                                                                 used element sizes of 15 mm. The surface of the side window
                                                                 consisted of triangles with a maximal side length of 4 mm.
                                                                 The mechanical domain inside the side window used a con-
                                                                 formal grid consisting of prisms with two elements in thick-
                                                                 ness direction. The frame on which the side window was
Figure 4. Schematic drawing of mechanical regions.               mounted was also meshed conformally with 10 elements
                                                                 in thickness direction. For the discretization of the acoustic
                                                                 regions, first-order FE basis functions were used, whereas
approach based on modal analysis was used to determine           all mechanical regions employed second-order FE basis
the relevant material properties and boundary conditions         functions to avoid locking effects. Due to the grid sizes in
for the simulation setup. Correct reproduction of the vibra-     the acoustic regions, acoustic waves with a frequency of
tion behavior of the side window was crucial, since it influ-     3000 Hz can be resolved with 7.6 elements per wavelength.
ences the interior sound pressure level to a high degree,        At least six elements per wavelength are necessary to reduce
especially in the investigated frequency range of 100 Hz to      the dispersion error to 15% [28]. The acoustic sound sources
3000 Hz. These frequencies are located below the coinci-         and also the aerodynamic forces on the side window were
dence frequency of the side window of about 3900 Hz, where       exported every 1  105 s. Acoustic waves with frequencies
the bending wavenumber of the structure is equal to the          up to 5000 Hz can therefore be resolved with 20 points per
acoustic wavenumber.                                             period. A total physical time of 0.2 s was realized.
    The material properties of the glass plate were deter-           In the experiments, the interior cabin of the SAE body
mined using the manufacturer’s data. To reproduce the            was lined with different types of absorbing material to
mounting of the window, the frame was modeled as a sec-          achieve acoustical properties comparable to a series produc-
ond mechanical region as depicted in Figure 4. Its material      tion car [14]. To emulate the acoustic characteristics of the
properties correspond to birch plywood. The material prop-       interior in the simulation, all absorbing materials were
erties of both glass plate and frame are listed in Table 1.      characterized and their damping effect was included using
The inner part of the frame was fixed in all three coordinate     normal impedance boundary conditions. The porous absor-
directions. This modeling was verified by experimental and        bers were characterized by flow resistance measurements
numerical eigenmode analysis. In the experimental setup,         and their impedance was calculated by using the Delany-
the glass window was exited by a white noise signal and          Bazley empirical model [29]. For the felt carpet, which
the exerted force was measured. The resulting surface veloc-     covered the floor of the SAE body, complex impedance
ity of the glass was captured using a single-point vibrometer    values of a similar carpet measured by Aretz [30] were used.
at 21 distributed measuring positions. The eigenmodes of         The damping behavior of the spring-mass system was diffi-
the structure and their respective damping were identified        cult to quantify due to its modular structure. Therefore, its
through the frequency response function derived from the         absorption coefficient was determined by using Eyring’s
output response of the glass to the applied force. The simu-     formula [31] with the known surface absorption values
lated eigenmodes conform with the experimentally deter-          and the measured reverberation time of the interior cabin.
mined ones with a maximum deviation of 10%. The                  The frequency-dependent impedance values of all damping
damping effect in the frame was modeled with a Rayleigh          materials are provided in the Supplementary Material.
damping model. The damping factors n ¼ 2x      a
                                                 þ bx
                                                    2
                                                      , with a   The model was validated by calculating the room transfer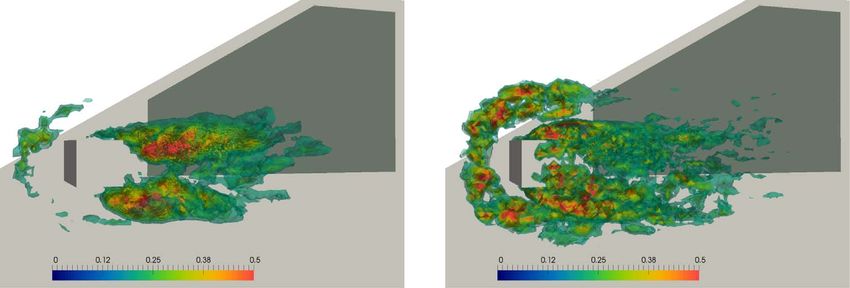
6 K. Nusser and S. Becker: Acta Acustica 2021, 5, 22
Figure 5. Section of acoustic grid in near window area. Figure 6. Isosurfaces of Q-criterium (Q = 2 105 1/s2)
coloured by velocity magnitude.
function at different positions inside the SAE body and
comparing them to experimental data. A good agreement pressure field. Therefore, it is only able to capture its broad-
was observed over the whole investigated frequency range. band characteristics, but no tonal components. A detailed
resolution of the turbulent structures in the CFD was there-
fore necessary in the low frequency range.
4 Results 4.2 Excitation mechanisms
4.1 Flow field
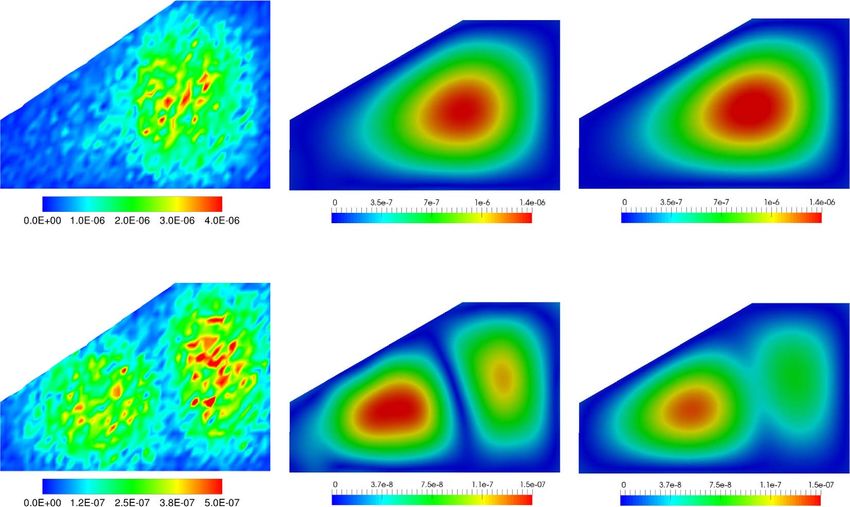
A hybrid approach was employed for the coupled acous-
To illustrate the instantaneous flow and the developing tic and mechanical simulations. For the aeroacoustic excita-
turbulent structures in the CFD simulation, the Q-criterion tion path, sound sources were computed at every time step
proposed by Hunt et al. [32] was used. Iso-surfaces of the during the incompressible CFD simulation. A formulation
second invariant of the velocity gradient tensor Q are based on the total differential of the pressure (3) was used.
depicted in Figure 6. It shows a high degree of irregularity Iso-surfaces of this source term transformed by FFT can be
and a wide range of sizes of vortex structures generated by observed in Figure 8 at frequencies of 100 Hz and 500 Hz.
the flow behind mirror and a-pillar. The characteristic Only the upper 70% of the maximum amplitudes are dis-
horseshoe vortex and the vortex shedding behind the played for clarity. At a frequency of 100 Hz, the highest
obstacle can be observed. The vortex breakdown in the source strengths are located in the shear layers above and
mirror wake is also clearly visible. below the mirror. These areas are directly adjacent to the
From measurements in an acoustic wind tunnel, surface front part of the side window. At a frequency of 500 Hz,
pressure data at 39 positions on the side window was the highest amplitudes of the source term are more evenly
available. This data was compared to surface pressure from distributed and shifted to the direct vicinity of the mirror.
the CFD simulation at the same monitoring positions in the Most are located in the area of the horseshoe vortex in front
wake of the mirror model. The resulting wall pressure of the mirror and in the shear layers around it. However,
spectra are depicted in Figure 7. one cannot deduce the acoustic pressure loading on the
At the position directly behind the side mirror (Fig. 7a), surface directly from the distribution of acoustic source
a good agreement between simulation and experiment can terms since the acoustic propagation, including reflection
be observed up to a frequency of over 2000 Hz. For higher and other phenomena, plays an important role.
frequencies, the resolution is limited by the spatial resolu- The sound sources were interpolated conservatively onto
tion of the CFD mesh, which acts as a low-pass filter for the acoustic mesh and propagation of sound outside the car
the smaller turbulent scales. At a measuring position was computed. By using the previously described coupling
further downstream (Fig. 7b), the frequency resolution is procedure, the displacement of the side window and the
slightly decreased, since the surface mesh was coarsened resulting acoustic field in the interior was determined.
further downstream from the side mirror. However, the For the second, aerodynamic excitation path, the turbu-
overall resolution was sufficient for this application, since lent pressure load on the surface of the car model was
it focuses on the frequency range below 3000 Hz. Influence computed during the CFD simulation. Figure 9 shows an
of the periodic vortex shedding behind the mirror model is exemplary distribution of the frequency-dependent surface
visible at both measuring locations as tonal peaks, espe- pressure at 150 Hz and 500 Hz.
cially below 200 Hz. Approximating the wall-pressure Similar characteristics as in case of the acoustic sources
fluctuations by an analytical model, e.g. the Corcos model, are visible here. The size of the turbulent structures
is therefore difficult in this frequency range. The Corcos decreases with increasing frequency. At a frequency of
model is based on the coherence properties of a turbulent 150 Hz, the areas with the highest pressure amplitude are
boundary layer flow which are used to generate a synthetic located in the front part of the window, directly behindK. Nusser and S. Becker: Acta Acustica 2021, 5, 22 7 Figure 7. Frequency spectra of the wall-pressure fluctuations in the wake of the mirror model. Figure 8. Iso-surfaces of acoustic source term (3) calculated by CFD simulation at different frequencies. Figure 9. Aerodynamic pressure distribution on surface from CFD simulation at different frequencies. the mirror model. Additionally, the vortex structures gener- From these investigations of the different excitation ated by the flow around the a-pillar influence the upper part mechanisms, it becomes clear that they are highly frequency of the window. For higher frequencies, the areas of high dependent. Especially at low frequencies, no uniform broad- pressure loading are smaller and more concentrated in the band characteristics can be observed. The vortex shedding wake of the mirror. No direct influence of the a-pillar vortex and the generated large turbulent flow structures have a is visible here. significant impact in this frequency range.
8                                   K. Nusser and S. Becker: Acta Acustica 2021, 5, 22

Figure 10. Comparison of acoustic (AWPF) and turbulent wall pressure fluctuations (TWPF) with experimental data at center of
side window.

    The resulting acoustic and turbulent wall pressure fluc-       the resulting displacement of each element of the structure
tuations are visualized at a position in the center of the side   is easily determined. These were compared to experimental
window in Figure 10. The acoustic pressure fluctuations            vibrometer data for validation. The measurements were
(AWPF) were calculated by solving the equations for acous-        conducted in the aeroacoustic wind tunnel at a free stream
tic wave propagation on the outside of the SAE body. The          velocity of 150 km/h [15]. The simulation results, however,
turbulent wall pressure fluctuations (TWPF) were exported          are only available for an inlet velocity of 100 km/h. Thus,
directly from the incompressible flow field. Both parts of the      the displacement amplitudes cannot be compared directly
pressure are compared to experimentally determined data.          to the measurements, but the general characteristics can
    These measured values show a characteristic slope from        be investigated qualitatively.
100 Hz, which is also reproduced by the TWPF in the                   A comparison of simulated displacement and experimen-
simulation. Both are also very similar in amplitude. In com-      tal data is depicted at two different frequencies in Figure 11.
parison, the AWPF show a much lower amplitude and                 These frequencies coincide with the first and second eigen-
therefore energy content as the TWPF. An offset of 20 dB          modes of the structure. The shape of the first eigenmode
to 30 dB, depending on the frequency, can be observed.            at 120 Hz is captured well by the simulations. The maximum
The AWPF cannot be measured directly, but they can be             amplitude of the simulated displacement is about 30% lower
determined from experimental data, e.g. by a wavenumber           than the measured one, which can be explained by the differ-
decomposition which makes it possible to separate both            ences in free stream velocity. The resulting displacement
parts of the pressure. Using this approach, similar offsets       amplitudes in case of acoustic and aerodynamic excitation
between acoustic and aerodynamic pressure were reported           are similar, although the exciting pressure amplitudes differ
in previous experimental investigations [11, 14, 33].             by about 30 dB (see Fig. 10). This suggests an efficient exci-
    Both AWPF and TWPF exhibit a similar slope over the           tation of the structure in case of AWPF loading. Addition-
frequency range between 200 Hz and 500 Hz. Above 500 Hz,          ally, the in-phase vibration of the side window can also be
AWPF levels remain nearly constant up to 2500 Hz. Above           observed below the first eigenmode, between the first and
this frequency, both types of pressure fluctuations are influ-      second, and the second and third eigenmode (not pictured).
enced by the CFD resolution. The rise in AWPF level for           The general shape is similar to the first eigenmode, with no
these frequencies is caused by an increase in numerical           node lines visible. For TWPF excitation, this vibration
noise, whereas the drop in TWPF is caused by filtering             mode only occurs below and at the first eigenmode.
effects due to the limited spatial resolution of the CFD              The frequency of the second simulated eigenmode devi-
simulation. Frequencies below 100 Hz will not be included         ates slightly from the experimentally determined frequency
in the following discussions since the validity of the            of 190 Hz. This can be attributed to small discrepancies in
experimental measurements is limited below this value             the interior configuration and the mounting of the window
due to the lower cut-off frequency of the wind tunnel and         which both influence the experimental measurements.
the absorbers. Additionally, the extend of the simulated          These influences can also lead to differences in the mode
outer acoustic region cannot accommodate acoustic waves           shape, which can be observed here in the location of the
with larger wavelengths.                                          maximum displacement amplitude. However, both mode
                                                                  shapes are similar overall. The displacement amplitude of
4.3 Vibroacoustics                                                the simulation with acoustic excitation is 10% smaller than
                                                                  for aerodynamic excitation.
   For both excitation paths, the acoustic and aerody-                As a next step, reasons for the different vibration
namic pressure fluctuations act as a pressure loading on           behavior are investigated in more detail. To this end, the
the structure, causing it to vibrate. In the simulations,         relation between surface pressure loading and displacement
K. Nusser and S. Becker: Acta Acustica 2021, 5, 22 9 Figure 11. Comparison of displacement of side window in m from vibrometer measurements (150 km/h) [15] and simulation (100 km/h) with aerodynamic and acoustic pressure excitation. Figure 12. Relation of wall pressure fluctuations and structural displacement at the center of the side window. of the structure is displayed in Figure 12a for aerodynamic the correlation between aerodynamic wall pressure fluctua- excitation and in Figure 12b for acoustic excitation. Pressure tions and the resulting structural displacement in Figure 12a, and displacement amplitude are visualized at a position both curves show a similar characteristic. This suggests a in the center of the side window. When investigating connection between the energy content of the pressure
10                                 K. Nusser and S. Becker: Acta Acustica 2021, 5, 22

excitation and the resulting displacement of the structure.      inside the cabin are compared to reference values from
The latter is elevated at the location of the eigenfrequen-      experiments in Figure 13. The measurement position is
cies of the structure, which are clearly visible for lower       located at the driver’s ear at a distance of 0.25 m from
frequencies. The wavenumber of the aerodynamic pressure          the side window, a height of 0.7 m above the floor, and
fluctuations is very different from the bending wavenumber        0.1 m from the rear edge of the window. Due to the limited
of the structure, which impedes an efficient coupling of both     resolution of the experimental data, only frequencies up to
below the coincidence frequency. Only a resonant excitation      1000 Hz will be investigated in the following. Above this fre-
of the eigenmodes of the structure by TWPF of the same           quency, the structural displacement amplitude approaches
frequency is possible here. However, below the coincidence       zero and the signal becomes increasingly noisy.
frequency, the sound radiation efficiency of resonant modes           Without damping materials, all interior surfaces are
is small, since they are located in the acoustic short circuit   treated as fully reflecting. This leads to an overestimation
region. This is partially compensated by the energy content      of the SPL over the whole frequency range. The largest
of the TWPF, which is about three orders of magnitude            peaks can be observed at the locations of the interior cavity
higher than in case of AWPF.                                     modes. At these frequencies, the SPL is up to 30 dB higher
    For an excitation by acoustic pressure, the displacement     than in the damped case. The discrepancies in amplitude
amplitude is in the same range as in case of TWPF excita-        height can be attributed to differences in the energy content
tion. It is also elevated at the location of the eigenfrequen-   of the modes and to relations between mode shape and mea-
cies of the structure and shows a more broadband                 surement position. When comparing the acoustically hard
characteristic for higher frequencies due to the increased       with the fully damped case, a large attenuation of these cav-
modal density. The structural displacement curve and the         ity resonances becomes apparent. The amplitude is
pressure amplitude show no direct relation. The latter           decreased by up to 30 dB and shifted to lower frequencies.
remains almost constant over the whole frequency range,          Not all modes are influenced to the same degree due to the
whereas the former is highest in the low-frequency range         uneven distribution of the absorbing material. For some
up to 350 Hz. These high displacement amplitudes are             modes, e.g. at frequencies of 160 Hz and 190 Hz, the SPL
mainly attributed to the in-phase vibration of the structure     is still overestimated by 10 dB in the damped case com-
in this region. For frequencies below the coincidence            pared to the experimental data. The porous absorbers with
frequency of the structure (fc = 3900 Hz) and excitation         the highest damping effect are located at the lower half of
by a diffuse acoustic field, radiated sound can be solely         the side and rear walls and on the roof of the SAE body.
attributed to the excitation of non-resonant modes [34,          The absorption coefficient of the other surfaces is smaller.
35]. This can be attributed to a similarity between the          Due to these inhomogeneities, it is difficult to ascribe a cer-
acoustic wavenumber of the exciting AWPF and the eigen-          tain damping behavior to a specific material configuration.
values of the structure, which makes an efficient coupling        However, it becomes apparent that is important to include
between both possible [36]. In this case, sound is radiated      a sufficient amount of absorbing material to reduce the
at the eigenfrequency of the structural mode with a high         effect of cabin modes. In the fully damped case, the simula-
radiation efficiency of r  1. This was also verified for the      tion is able to closely reproduce the measured interior SPL
experimental measurements [15], where eigenmodes at              for frequencies up to 600 Hz. For higher frequencies, the
frequencies below 400 Hz were excited by AWPF with a             simulation data becomes influenced by the increased noise
frequency of 1000 Hz. Thus, it is concluded that an efficient,    of the excitation data. In conclusion, the detailed replica-
non-resonant excitation of the structure by AWPF can be          tion of the damping properties of the experimental model
observed. This becomes especially obvious in the relation        in the simulation is very important to correctly recreate
between the energy content of the excitation and the result-     the characteristics of the interior sound field.
ing structural displacement.                                         As a final step, the resulting acoustic field in the interior
                                                                 of the SAE body was determined. As previously discussed,
4.4 Interior acoustics                                           the characteristic of the radiated sound is dependent on the
                                                                 type of excitation. To this end, the resulting sound pressure
    Since the experiments were conducted using absorbing         level at the position of the driver’s ear is plotted separately
materials inside the cabin, it was important to determine        in Figure 14a for excitation by acoustic and aerodynamic
the influence of this absorption on the simulated interior        pressure fluctuations. The simulated SPL is compared to
sound pressure level. For this purpose, an acoustic simula-      experimental data, which contains both excitation pressure
tion of the interior of the car was conducted, using the         contributions. When analyzing the contributions of both
experimentally determined normal velocity of the flexible         excitation mechanisms, it becomes clear that none of them
structure as a boundary condition. It was measured from          can be neglected in the simulation of the interior sound
the inside of the SAE body by a laser-scanning vibrometer        field. Both have a large impact in different frequency
to rule out any influence of the exterior flow field. By using      ranges. The contribution of the acoustic pressure excitation
measured data as excitation in the simulations, it was pos-      is largest in the low-frequency range below 300 Hz and
sible to validate the interior modeling without influences of     above 1500 Hz. The former can be attributed to the non-
the previous simulation steps.                                   resonant excitation of the structure and the resulting in-
    The resulting interior sound pressure level of simula-       phase vibration of the side window, which leads to high
tions with and without absorbing boundary conditions             sound radiation. In the upper frequency range, the sound
K. Nusser and S. Becker: Acta Acustica 2021, 5, 22 11
Figure 13. Comparison of different acoustic boundary conditions in the inside of the cabin.
Figure 14. Contribution of acoustic and aerodynamic pressure excitation to overall simulated SPL at driver’s ear and comparison to
experimental data.
radiation efficiency increases due to the increasing similarity eigenmodes of the interior cavity only have a minor influ-
of acoustic and structural wavenumber when approaching ence on the acoustic field.
the coincidence frequency.
In Figure 14b, the contributions by both parts of the
pressure are combined. Up to a frequency of 2200 Hz, 5 Conclusion
simulated and experimental data are in good agreement.
Above this frequency, the limited spatial resolution of the In this work, the first-principles computation of wind-
CFD simulation influences the results. In the low-frequency induced noise and its transmission through the side window
range up to 500 Hz, the SPL is mainly influenced by the of a simplified car model without the use of empirical corre-
resonance frequencies of the side window, which correspond lations, transfer functions, and experimental calibrations
to the peaks in SPL. The location of these eigenfrequencies was achieved. For this, three distinct physical problems
is well reproduced by the simulation. This underlines the had to be solved: aerodynamics for sound generation, vibra-
importance of realistic modeling of the bearing and material tion for sound transmission through the side window and
properties of the structure in the low-frequency range. Since acoustics for the propagation of sound in the vehicle cabin
damping materials were included in the simulation, the and also outside of the car from the acoustic sound sources12 K. Nusser and S. Becker: Acta Acustica 2021, 5, 22
in the flow. These investigations were carried out on simpli- References
fied car geometry with clearly defined properties and
boundary conditions which can serve as a generic test case. 1. B. Arguillat, D. Ricot, G. Robert, C. Bailly: Measurements of
All steps of the simulation workflow were validated against the wavenumber-frequency spectrum of wall pressure fluctu-
experimental data in the frequency range between 100 Hz ations under turbulent flows, in 11th AIAA/CEAS Aeroa-
coustics Conference. American Institute of Aeronautics and
and 2500 Hz. Astronautics, May 2005.
The flow-induced sound field inside a simplified car 2. R. Siegert, V. Schwarz, J. Reichenberger: Numerical simu-
model was computed using a hybrid simulation approach. lation of aeroacoustic sound generated by generic bodies
The turbulent flow around the SAE body was simulated placed on a plate: Part-II, prediction of radiated sound
by an incompressible LES approach. Acoustic source terms pressure, in Proceedings of the 5th AIAA/CEAS Aeroacous-
based on the perturbed acoustic wave equation and aerody- tics Conference, 1999. American Institute of Aeronautics and
namic pressure loading on the structure were evaluated Astronautics, May, 1999.
3. S. Becker, C. Hahn, M. Kaltenbacher, R. Lerch: Flow-
during the runtime of the CFD simulation. A fully coupled induced sound of wall-mounted cylinders with different
structural and acoustic simulation based on an FE geometries. AIAA Journal 46 (2008) 2265–2281.
approach was conducted by using aerodynamic and acous- 4. J. Ask, L. Davidson: A numerical investigation of the flow
tic pressure loading as an excitation of the structure. In past a generic side mirror and its impact on sound genera-
both cases, the propagation of sound inside the cabin was tion. Journal of Fluids Engineering 131 (2009) 061102.
simulated and the resulting sound pressure level at the 5. F. Schäfer, S. Müller, T. Uffinger, S. Becker, J. Grabinger, M.
Kaltenbacher: Fluid-structure-acoustic interaction of the
driver’s ear was analyzed. The investigated low-frequency
flow past a thin flexible structure. AIAA Journal 48 (2010)
range makes a close reproduction of the experimental setup 738–748.
necessary, especially in terms of the vibration behavior of 6. S. Krajnovic, L. Davidson: Flow around a simplified car, part
the side window and the acoustical damping in the interior 1: Large eddy simulation. Journal of Fluids Engineering 127
cabin. The eigenmodes of the side window have a significant (2005) 907–918.
impact on the interior SPL for frequencies below 500 Hz. 7. D. Aljure, I. Rodriguez, O. Lehmkhul, R. Borrell, A. Oliva:
Acoustic damping materials in the cabin were characterized Flow and turbulent structures around simplified car models.
Conference on Modelling Fluid Flow (2012) 247–254.
and included in the simulation model. This was necessary to 8. M. Cabrol, Y. Detandt, M. Hartmann, A. Mutzke: A compar-
attenuate the cavity resonances, which have a large influ- ison between the effects of turbulent and acoustic wall pressure
ence on the sound field in the undamped case. fluctuations inside a car, in 18th AIAA/CEAS Aeroacoustics
A close reproduction of the sound pressure level in the Conference (33rd AIAA Aeroacoustics Conference). American
interior of the SAE body was achieved by the simulation Institute of Aeronautics and Astronautics, June 2012, pp.
up to a frequency of 2200 Hz. Additionally, it was possible 2012–2202.
to analyze the different excitation mechanisms of both 9. F. Van Herpe, D. D’Udekem, J. Jacqmot, R. Kouzaiha:
Vibro-acoustic simulation of side windows and windshield
acoustic and aerodynamic pressure fluctuations separately excited by realistic CFD turbulent flows including car cavity,
and to quantify their contribution to the total interior in SAE Technical Paper Series. SAE International, June,
SPL. It was concluded, that both excitation mechanisms 2012, pp. 01–1521.
play an integral role in determining the total interior SPL 10. F.G. Mendonca, T. Connelly, S. Bonthu, P. Shorter: CAE-
due to their different excitation characteristics. based prediction of aero-vibro-acoustic interior noise trans-
mission for a simple test vehicle. Tech. Rep. (2014) 1–2.
11. A. Schell, V. Cotoni: Prediction of interior noise in a sedan
Acknowledgments due to exterior flow. SAE International Journal of Passenger
Cars – Mechanical Systems 8 (2015) 1090–1096.
The authors gratefully acknowledge the compute 12. A. Schell, V. Cotoni: Flow induced interior noise prediction
resources and support provided by the Erlangen Regional of a passenger car, in INTER-NOISE and NOISE-CON
Computing Center (RRZE). Congress and Conference Proceedings, Vol. 254. Institute of
Noise Control Engineering, 2017, pp. 1–10.
13. S. Schoder, M. Kaltenbacher: Hybrid aeroacoustic computa-
tions: State of art and new achievements. Journal of
7 Supplementary material Theoretical and Computational Acoustics 27, 4 (2019)
1950020.
Supplementary material is available for this paper 14. S. Müller, S. Becker, C. Gabriel, R. Lerch, F. Ullrich: Flow-
at https://acta-acustica.edpsciences.org/10.1051/aacus/ induced input of sound to the interior of a simplified car
2021014/olm. It includes the frequency-dependent impe- model depending on various setup parameters, in 19th
dance values for the damping materials in the interior AIAA/CEAS Aeroacoustics Conference. American Institute
cabin: of Aeronautics and Astronautics, May 2013.
15. S. Müller: Fluid-Struktur-Akustik-Kopplung bei der Über-
impedance-absorber.txt: frequency-dependent real and
strömung dünner Platten. PhD thesis, Friedrich-Alexander-
imaginary part of impedance of absorber. Universität Erlangen-Nürnberg (FAU), April 2015.
impedance-floor.txt: frequency-dependent real and 16. F. Durst, M. Schäfer: A parallel block-structured multigrid
imaginary part of impedance of felt carpet. method for the prediction of incompressible flows. Interna-
impedance-spring-mass.txt: frequency-dependent real tional Journal for Numerical Methods in Fluids 22 (1996)
and imaginary part of impedance of spring-mass system. 549–565.K. Nusser and S. Becker: Acta Acustica 2021, 5, 22 13
17. M. Kaltenbacher: Advanced simulation tool for the design of 26. M. Kaltenbacher, M. Escobar, S. Becker, I. Ali: Computa-
sensors and actuators. Procedia Engineering 5 (2010) tional aeroacoustics based on lighthill’s acoustic analogy, in
597–600. Computational Acoustics of Noise Propagation in Fluids-
18. S. Becker, K. Nusser, M. Oswald: Aero-vibro-acoustic wind Finite and Boundary Element Methods. Springer, 2008, pp.
noise-simulation based on the flow around a car, in SAE 115–142.
Technical Paper Series. SAE International, June 2016. 27. J.-P. Berenger: A perfectly matched layer for the absorption
19. K. Nusser, S. Müller, C. Scheit, M. Oswald, S. Becker: Large of electromagnetic waves. Journal of Computational Physics
eddy simulation of the flow around a simplified car model, in 1142 (1994) 185–200.
Direct and Large-Eddy Simulation X. Springer International 28. S. Marburg: Discretization Requirements: How many
Publishing, 2017, pp. 243–249. Elements per Wavelength are Necessary? Springer Berlin
20. A. Hüppe, J. Grabinger, M. Kaltenbacher, A. Reppenhagen, G. Heidelberg, Berlin, Heidelberg, 2008, pp. 309–332.
Dutzler, W. Kühnel: A non-conforming finite element method 29. M.E. Delany, E.N. Bazley: Acoustical properties of fibrous
for computational aeroacoustics in rotating systems, in 20th absorbent materials. Applied Acoustics 3 (1970) 105–116.
AIAA/CEAS Aeroacoustics Conference. American Institute of 30. M. Aretz, Combined wave and ray based room acoustic
Aeronautics and Astronautics, 2014, p. 2739. simulations of small roomss, vol. 12 of Aachener Beiträge zur
21. M. Kaltenbacher, A. Hüppe, A. Reppenhagen, F. Zenger, S. technischen Akustiks. Logos Verlag Berlin GmbH, 2012.
Becker: Computational aeroacoustics for rotating systems 31. C.F. Eyring: Reverberation time in “dead” rooms. The Journal
with application to an axial fan. AIAA Journal 55 (2017) of the Acoustical Society of America 1 (1930) 217–241.
3831–3838. 32. J. Hunt, A. Wray, P. Moin: Eddies, stream, and convergence
22. S. Schoder, C. Junger, M. Kaltenbacher: Computational zones in turbulent flows. Center for Turbulence Research
aeroacoustics of the eaa benchmark case of an axial fan. Acta Report CTR-S88, 1988, pp. 193–208.
Acustica 4, 5 (2020) 22. 33. R.G. Dejong, T.S. Bharj, J.J. Lee: Vehicle wind noise
23. N. Lindener: Aerodynamic Testing of Road Vehicles in Open analysis using a SEA model with measured source levels, in
Jet Wind Tunnels, vol. SP-1465 of SP (Society of Automotive SAE Technical Paper Series. SAE International, April2001.
Engineers). Society of Automotive Engineers, Warrendale, 34. P. Bremner, J. Wilby: Aero-vibro-acoustics: Problem state-
PA, 1999. ment and methods for simulation-based design solution, in
24. S. Müller, S. Becker, C. Gabriel, F. Ullrich: Influence of the 8th AIAA/CEAS Aeroacoustics Conference. American Insti-
flow-induced structure-borne noise on the interior acoustics tute of Aeronautics and Astronautics, June 2002.
of a simplified car model, in European Conference on Noise 35. M. Hartmann, J. Ocker, T. Lemke, A. Mutzke, V. Schwarz, H.
Control, Pragu, 2012, pp. 10–13. Tokuno, R. Toppinga, P. Unterlechner, G. Wickern: Wind
25. M. Islam, F. Decker, M. Hartmann, A. Jaeger, T. Lemke, J. noise caused by the side-mirror and a-pillar of a generic vehicle
Ocker, V. Schwarz, F. Ullrich, A. Schroeder, A. Heider: model, in 18th AIAA/CEAS Aeroacoustics Conference.
Investigations of sunroof buffeting in an idealised generic American Institute of Aeronautics and Astronautics, June
vehicle model – Part I: Experimental results, in 14th AIAA/ 2012.
CEAS Aeroacoustics Conference (29th AIAA Aeroacoustics 36. W.K. Blake: Mechanics of flow-induced sound and vibra-
Conference), American Institute of Aeronautics and Astro- tions. Academic Press, 1986.
nautics, May 2008, p. 2900.
Cite this article as: Nusser K & Becker S. 2021. Numerical investigation of the fluid structure acoustics interaction on a simplified
car model. Acta Acustica, 5, 22.You can also read