Q2/Q3 2020 Solar Industry Update - David Feldman Robert Margolis December 8, 2020 - NREL
←
→
Page content transcription
If your browser does not render page correctly, please read the page content below
Q2/Q3 2020
 Solar Industry Update

 David Feldman
 Robert Margolis
 December 8, 2020

NREL/PR-6A20-78625
Executive Summary
Global Solar Deployment                                                                 PV System and Component Pricing
•   The median estimate of 2020 global PV system deployment projects an                 •   The median residential quote from EnergySage in H1 2020 fell 2.4%, y/y
    8% y/y increase to approximately 132 GWDC.                                              to $2.85/W—a slower rate of decline than observed in any previous 12-
                                                                                            month period.
U.S. PV Deployment
                                                                                        •   Even with supply-chain disruptions, BNEF reported global mono c-Si
•   Despite the impact of the pandemic on the overall economy, the United
                                                                                            module pricing around $0.20/W and multi c-Si module pricing around
    States installed 9.0 GWAC (11.1 GWDC) of PV in the first 9 months of
                                                                                            $0.17/W.
    2020—its largest first 9-month total ever.
                                                                                        •   In Q2 2020, U.S. mono c-Si module prices fell, dropping to their lowest
•   At the end of September, there were 67.9 GWAC (87.1 GWDC) of solar PV                   recorded level, but they were still trading at a 77% premium over global
    systems in the United States.                                                           ASP.
•   Based on EIA data through September 2020, 49.4 GWAC of new electric                 Global Manufacturing
    generating capacity are planned to come online in 2020, 80% of which
    will be wind and solar; a significant portion is expected to come in Q4.            •   Despite tariffs, PV modules and cells are being imported into the United
                                                                                            States at historically high levels—20.6 GWDC of PV modules and 1.7
•   EIA estimates solar will install 17 GWAC in 2020 and 2021, with                         GWDC of PV cells in the first 9 months of 2020.
    approximately 13 GWAC from large-scale PV.
                                                                                        •   In H1 2020, U.S. c-Si module production dipped 9% from the historical
•   The United States installed approximately 497 MWh (266 MWAC) of                         high it reached in H2 2019, due to the pandemic.
    energy storage onto the electric grid in H1 2020, up 3% y/y, as a result of
                                                                                        •   In H1 2020, U.S. PV cell production decreased 66% from H2 2019 and
    record levels of behind-the-meter deployment.
                                                                                            virtually no panels were produced in Q2 2020.

    A list of acronyms and abbreviations is available at the end of the presentation.                                                                        NREL | 2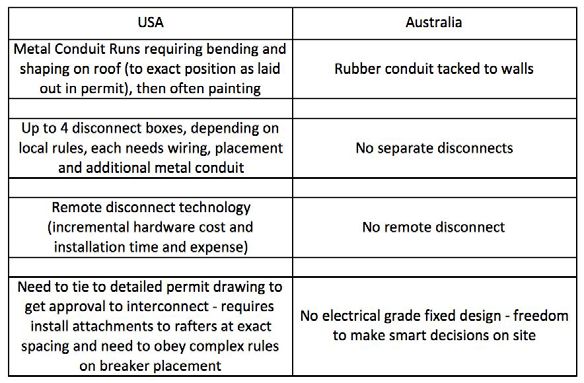
Agenda

1 Global Solar Deployment
2 U.S. PV Deployment
3 PV System Pricing
4 Global Manufacturing
5 Component Pricing
6 Market Activity
   Global Soft Costs Trends
                              NREL | 3
1 Global Solar Deployment • The median estimate of 2020 global PV system
deployment projects an 8% y/y increase to
2 U.S. PV Deployment approximately 132 GWDC.
• Analysts expect increased deployment in 2021 as well,
3 PV System Pricing with strong growth in many of the leading markets.
– If analysts are correct, there will be more than 900 GWDC of
4 Global Manufacturing global PV by the end of 2021.
5 Component Pricing
6 Market Activity
Global Soft Costs Trends
NREL | 4Annual Global PV Demand
200 ROW • Though most analysts estimate an increase in global PV
180 Europe installations in 2020, projections range from
Japan 112 GWDC to 144 GWDC.
160
PV Annual Installations (GWDC)
India – The median estimate of 2020 global PV system
140
United States deployment projects an 8% y/y increase to
120 China approximately 132 GWDC.
100 – Between 2019 and 2020, annual PV installations in
80 Europe and India are estimated to shrink. Chinese,
U.S., Japanese, and ROW PV installations are
60 projected to grow.
40
• Analysts expect increased deployment in 2021 as well,
20 with strong growth in many of the leading markets.
0 – If analysts are correct, there will be more than 900
2016 2017 2018 2019 2020P 2021P GWDC of global PV by the end of 2021.
Notes: P = projection. Bar represents median projection. Error bars represent high and low projections.
Not all sources have data for all categories.
Sources: BNEF, “4Q 2020 Global PV Market Outlook,” 11/24/20; Infolink (November 2020) (Solar Power
Europe Global Market Outlook 2020-2024, “Wood Mackenzie Power and Renewables (November 2020, NREL | 5
October 2020).CSP Updates
• In September, China’s Delingha CSP tower plant, with seven hours of storage, reported it had produced 89%
of long-term expected production in its first year—typical international first-year rates are 70%–80%.
– The main drivers in the loss of production were equipment failure, lack of operational experience, and grid
curtailment.
• In September, Abengoa completed the first of three 200 MWAC parabolic trough solar fields at the 950 MWAC
Noor Energy 1 CSP-PV plant in Dubai.
– In June, Shangai Electric completed the project’s CSP tower receiver.
• In September, Q-Energy, a subsidiary of a Spanish investment group, purchased 67 MWAC of CSP plants,
expanding its portfolio to 170 MWAC of CSP. United Kingdom-based investment fund Cubico also recently
expanded its CSP portfolio to 150 MWAC, continuing the trend of Spanish CSP asset acquisitions.
• In November, a group of European companies announced they would build a pilot ceramic particle
concentrating solar tower plant to supply heat for a pasta factory in Italy.
– The “centrifugal solar technology” was designed by the German Aerospace Centre and has achieved temperatures
as high as 965° Celsius at the receiver outlet during tests. Conventional molten-salt CSP plants operate up to 565°
Celsius. Higher temperatures increase plant efficiency but place more stress on the system.
NREL | 6
Source: Reuters (September 30, 2020; October 15, 2020; November 18, 2020).• Despite the impact of the pandemic on the overall economy,
the United States installed 9.0 GWAC (11.1 GWDC) of PV in
the first 9 months of 2020—its largest first 9-month total
ever.
• At the end of September, there were 67.9 GWAC (87.1DC) of
1 Global Solar Deployment solar PV systems in the United States.
2 U.S. PV Deployment • Based on EIA data through September 2020, 49.4 GWAC of
new electric generating capacity are planned to come online
3 PV System Pricing in 2020, 80% of which will be wind and solar; a significant
portion is expected to come in Q4.
4 Global Manufacturing • EIA estimates solar will install 17 GWAC in 2020
and 2021, with approximately 13 GWAC from large-scale PV.
5 Component Pricing
• The United States installed approximately 497 MWh (266
6 Market Activity MWAC) of energy storage onto the electric grid in H1 2020,
up 3% y/y, as a result of record levels of behind-the-meter
Global Soft Costs Trends deployment.
NREL | 7State Updates
IOUs launched
community solar
programs.
The CPUC kicked off
efforts to find
successor to net These states approved net
metering program 2.0 metering successor programs
DC
(i.e., net metering with monthly charges per kW
3.0). The CPUC (NY), minimum bills (South
released a draft study Carolina), time-of-use rates
finding residential (South Carolina), and ability to
customers paid too make changes in the future
little and non- (Utah).
residential customers
paid too much for PV
Regulators approved 10% Regulators upheld legality
in 2.0 program.
PV energy export rate of PV fee and approved an
reduction starting in increase (from from $5/kW
October 2021. to $5.41/kW).
Source: Meister Consultants Group, 50 States of Solar:
NREL | 8
Net Metering Quarterly Update (Q3 2020).U.S. Installation Breakdown
Quarterly: EIA
• Despite the impact of the pandemic on the overall economy, the • Approximately 55% of U.S. PV capacity installed in
the first 9 months of 2020 occurred in Texas,
United States installed 9.0 GWAC of PV in the first 9 months of Florida, and California.
2020, its largest first 9-month total ever—up 82% y/y.
• Despite a concentration of PV installations in the
– Residential, C&I, and utility-scale PV were up 20%, 66%, and top three markets, there continues to be growing
133% over that time period respectively. diversification of growth across the United States.
6
U.S. PV Installations by Market Segment
Q1-Q3 2020 U.S. PV Installations by
5 Utility-scale Region (9.0 GWAC)
C&I
Quarterly PV Installed (GWAC)
4 Residential California
1,282 Northeast Southwest
3 1,189 731
Southeast
2 1,450
Midwest
1 507
Florida Texas
1,499 Other
0 2,138
176
Q1 Q2 Q3 Q4 Q1 Q2 Q3 Q4 Q1 Q2 Q3 Q4 Q1 Q2 Q3 Q4 Q1 Q2 Q3
'16 '16 '16 '16 '17 '17 '17 '17 '18 '18 '18 '18 '19 '19 '19 '19 '20 '20 '20
NREL | 9
Sources: EIA, “Electric Power Monthly,” forms EIA-023, EIA-826, and EIA-861 (February and November 2020, February 2019).U.S. Installation Breakdown
Quarterly: SEIA
• The units SEIA uses to report installations (GWDC) differ
• SEIA reports that the United States installed 11.1 GWDC of PV in the first
from EIA (GWAC); additionally, there are likely differing
9 months of 2020—up 48% y/y. assumptions of individual project’s placed-in-service
– At the end of Q3 2020, there were 87.1 GWDC of cumulative PV dates. However, they are consistent in demonstrating
installations. U.S. PV capacity’s historical growth and regional
diversity.
7 U.S. PV Installations by Market Segment Q1-Q3 2020 U.S. PV Installations by
Utility Region (11.1 GWDC)
6
Non Residential PV
5
Quarterly PV Installed (GWDC)
Residential PV Northeast
Southeast 10%
4 17%
Florida
3 18%
Midwest
2 Southwest 5%
7%
1 Texas California Other
22% 16% 4%
0
Q3 Q4 Q1 Q2 Q3 Q4 Q1 Q2 Q3 Q4 Q1 Q2 Q3 Q4 Q1 Q2 Q3 Q4 Q1 Q2 Q3
'15 '15 '16 '16 '16 '16 '17 '17 '17 '17 '18 '18 '18 '18 '19 '19 '19 '19 '20 '20 '20
NREL | 10
Sources: Wood Mackenzie/SEIA: U.S. Solar Market Insight: Q4 2020.U.S. Installation Breakdown
by State
At the end of September, there were 67.9 GWAC of solar In the first 9 months of 2020, approximately 9.0 GWAC of
PV systems in the United States, of which 41.4 GW were PV capacity were installed, of which 5.7 GWAC were
utility-scale PV and 26.5 GW were distributed PV. utility-scale PV and 3.3 GWAC were distributed PV.
Cumulative Installed PV Capacity, as of September 2020 PV Capacity Installed in 2020, as of September
(MWAC) (MWAC)
California 21,914 Texas 2,138
Texas 5,252 Florida 1,499
North Carolina 4,849 California 1,282
Florida 4,117 Georgia 503
Arizona 3,618 Massachusetts 378
Massachusetts 2,799 DPV South Carolina 347 DPV
New Jersey 2,751 UPV Arizona 333 UPV
Nevada 2,643 New York 310
New York 2,285 Virginia 231
Georgia 2,012 New Jersey 220
Other 15,656 Other 1,732
0 5,000 10,000 15,000 20,000 25,000 0 500 1,000 1,500 2,000 2,500
Note: EIA monthly data for 2020 are not final. Additionally, smaller utilities report information to EIA on a yearly basis, and
therefore, a certain amount of solar data have not yet been reported. “Net Generation” includes DPV generation. NREL | 11
Sources: EIA, “Electric Power Monthly,” forms EIA-023, EIA-826, and EIA-861 (February and November 2020, February 2019).• Based on EIA data through September 2020, 49.4 GWAC of new
U.S. Generation Capacity Additions by electric generating capacity are planned to come online in 2020—
second only to 2002 and roughly double the average over the past
Source: 2019 and Planned 2020 10 years.
– Only 22 GWAC came online in the first 9 months of 2020;
therefore, EIA data expects a massive Q4.
• EIA estimates the percentage of U.S. electric capacity additions from solar will
– In the first 9 months 9.0 GWAC of PV and 5.8 GWAC of wind
grow from 34% in 2019 to 35% in 2020 (26% UPV and 9% DPV). It is estimated
were installed; another 8.2 GWAC of PV and 17.6 GWAC of wind
that 47% of additions will come from wind in 2020—up from 34% in 2019. are expected in Q4 2020.
• Based on data through September 2020, solar capacity additions are expected
to increase from 2019 installations by more than about 8 GWAC, y/y. – In the last five years, the planned capacity additions in a given
• EIA estimates more combined solar and wind will be installed in 2020 than in year, as of September, have represented 83% to 112% of actual
installations.
any other year.
• Virtually all these projects that are not complete this year
2019 U.S. Generation Capacity Additions will begin operation next year.
(Total 27.6 GWAC) Other Estimated 2020 U.S. Generation Capacity Additions
0.5
(Total 49.4 GWAC)
DPV
3.7
Natural Gas CC UPV DPV Other
6.4 12.8 4.4 1.0
UPV Natural Gas
5.6 CT Natural Gas CC
1.7 6.1
Wind Natural Gas CT
Natual Gas (Other)
9.3 Wind 1.5
0.4
23.3
Natual Gas (Other)
0.3
Sources: EIA “Preliminary Monthly Electric Generator Inventory. Solar: EIA “Electric Power Monthly”
Table 6.1; 2020 DPV estimate is estimated by multiplying January–September installations by 12/9. NREL | 12EIA Historical 2018–2019 and
Projected 2020–2021 U.S. Wind and
Solar Capacity Additions
45
Though 2019 U.S. solar and wind
40
Wind installations collectively achieved
35 C&I PV record levels, EIA expects 2020 and
2021 installations to far exceed these
Annual Installations (GWAC)
30 Residential
25 PV levels, with 40 GWAC in 2020 and 25
20 GWAC in 2021.
15 • Wind installations are projected to peak
10 in 2020 with 23 GWAC.
5 • EIA estimates solar will install 17 GWAC
0 in 2020 and 2021, with approximately 13
2018 2019 2020P 2021P GWAC from large-scale PV.
Sources: EIA “Short-term Energy Outlook;” November 2020. NREL | 13EIA PV Project
Planned Pipeline
GWAC
30 According to EIA data, the U.S. PV
Planned project pipeline hit a record high in
25
Regulatory approvals H1 2019, and the capacity of utility-
20 Under construction scale projects under construction
was approximately 14 GWAC in
15 September 2020.
10
5
0
Source: EIA Form 860M. NREL | 14U.S. Energy Storage Installations • Wood Mackenzie estimates the U.S. energy storage
by Market Segment market will grow seven-fold by 2025, driven largely
through a dramatic increase in front-of-the-meter
installations.
• The United States installed approximately 497 MWh (266 MWAC)
• Over the summer, APS and Tucson Electric in Arizona
of energy storage onto the electric grid in H1 2020, up 3% y/y, due
and Dominion energy in Maryland released integrated
to record levels of behind-the-meter deployment.
resource plans targeting 8.7 GW of energy storage by
– Increased pairing of PV and batteries, particularly in California
2035.
and Hawaii, have kept the market strong despite the
– 1.9 GW of battery storage were installed in the
pandemic-related lockdowns.
United States at the end of Q3 2020.
– One California project contributed to 2/3 of the front-of-the
meter MWs deployed in Q2 2020.
U.S. Energy Storage Installations by Market Segment H1 2020 U.S. Energy Storage Installations by Region
400
(497 MWh)
350 Front-of-the-Meter Massachusetts
Quarterly Energy Storage
300 Non-Residential 12%
Installed (MWh)
Residential
250
200 New York
Hawaii
150 California 3%
12%
54%
100
Texas
50 4%
Other Arizona
0
12% 2%
Q2 Q3 Q4 Q1 Q2 Q3 Q4 Q1 Q2 Q3 Q4 Q1 Q2 Q3 Q4 Q1 Q2 Q3 Q4 Q1 Q2
'15 '15 '15 '16 '16 '16 '16 '17 '17 '17 '17 '18 '18 '18 '18 '19 '19 '19 '19 '20 '20 New Jersey
1% NREL | 15
Source: Wood Mackenzie Power & Renewables and Energy Storage Association, “U.S. Energy Storage Monitor.”• The median residential quote from EnergySage in
H1 2020 fell 2.4%, y/y to $2.85/W—a slower rate of
decline than observed in any previous 12-month
period.
• From 2018 through 2020 (YTD), PV+storage systems
had a median price of $2,700/kWh, or
1 Global Solar Deployment $5,900/kWAC.
2 U.S. PV Deployment • LBNL found that the median price of a U.S. utility-
scale PV system dropped 20% from 2018 to 2019 to
3 PV System Pricing $1.44/WAC (or $1.15/WDC).
• LBNL also found that median U.S. PPA pricing has
4 Global Manufacturing
been relatively stable over the past three years with
average pricing between $20-$30/MWh for non-
5 Component Pricing Hawaii large-scale PV systems.
6 Market Activity • For the first time we are including reported pricing
data of PV+storage systems in our quarterly
Global Soft Costs Trends updates. From 2018 through 2020 (YTD), U.S.
residential PV+storage systems had a median price
of $2,700/kWh, or $5,900/kWAC. NREL | 16System Pricing from Select States
$5.0 • It is unclear what, if any impact the reduction of
$4.5 the residential ITC from 30% to 26% in 2020 had
on reported prices for smaller systems, on average.
$4.0
• From H2 2019 to H2 2020, the median reported PV
System Price ($/WDC)
$3.5
system price in Arizona, California, Connecticut,
$3.0
Massachusetts, and New York:
$2.5
– Fell 1% to $3.97/W for systems from 2.5 kW to 10 kW
$2.0
– Fell 2% to $3.47/W for systems from 10 kW to 100 kW
$1.5
2.5–10 kW 10–100 kW – Fell 9% to $2.25/W for systems from 100 kW to 500 kW
$1.0
– Fell 10% to $1.77/W for systems from 500 kW to 5 MW.
$0.5 100–500 kW 500 kW - 5 MW
$0.0
H1 H2 H1 H2 H1 H2 H1 H1 H1 H2 H1 H2
'15 '15 '16 '16 '17 '17 '18 '18 '19 '19 '20 '20
2020 (YTD) MW: AZ (128), CA (351), CT (2.5), MA (69), NY (279)
Note: System prices above $10/W and below $1/W were removed from the data set. There were not
enough reported prices for systems above 5 MW in this dataset to show a trends over time.
Sources: AZ (11/24/20), CA NEM database (08/31/20); CT (08/01/20), MA SREC and SMART programs NREL | 17
(11/21/20); NYSERDA (11/24/20).System Pricing From • The median price of a large system in New York was
Select States, 2020 YTD about 28% less than the median price in California.
• In H1 2020, the 20th and 80th percentile preliminary
prices in California for a small system were $3.39/W
• In addition to price differences based on system size, there is
and $5.22/W respectively.
variation between states and within individual markets.
$6
Bars represent the median, with error bars
$5 representing 80th and 20th percentiles.
System Price ($/WDC)
$4
$3
$2
$1
$0
AZ CA CT MA NY AZ CA CT MA NY AZ CA NY AZ CA NY NY
2.5 kW - 10 kW 10 kW - 100 kW 100 kW - 500 kW 500 kW - 5 MW 5 MW+
2020 (YTD) MW: AZ (128), CA (351), CT (2.5), MA (69), NY (279)
Note: System prices above $10/W and below $1/W were removed from the data set.
Sources: AZ (11/24/20), CA NEM database (08/31/20); CT (08/01/20), MA SREC and SMART programs (11/21/20); NYSERDA (11/24/20).
NREL | 18Cost and System Size over Time
Residential System Costs Reported $5 15
Median Gross Costs ($/WDC)
by EnergySage, H1 2020
Average System Size (kW)
3.80 3.72 3.64
$4 2.89 2.85
12
3.50 3.35
3.15 3.10 3.05 3.00 2.92
$3 9
$2 6
• The 2.4% cost decrease between H1 2019 and H1
$1 3
2020 is a slower rate of decline than observed in
any previous 12-month period. $0 0
– Some of the decrease in price can be attributed to a
6.4% increase in system size, to 10.0 kW
• Residential system quotes varied by state. In H1
Cost and System Size by State, H1 2020
2020, the median gross cost of a residential system
$5 15
in Colorado was 25% higher than the median gross
Median Gross Costs ($/WDC)
Average System Size (kW)
$4 12
cost of a residential system in Arizona.
$3 9
– Part of the price disparity between states is due to
differences in average system size, though other factors, $2
2.48 2.62 2.83 2.85 2.99
6
3.10
2.60 2.70 2.84 2.96 3.05
such as cost of living (e.g., California) also play a role. $1 3
$0 0
AZ FL NV TX CA NJ US NY MA IL CO
Cost System Size
Source: EnergySage, “Solar Market place Intel Report H2 2020 – H1 2020.” NREL | 19Residential U.S. Storage Pricing
$9,000
PV+Storage ($/kWh) From 2018 through 2020 (YTD), PV+storage
$8,000
PV+Storage ($/kWAC)
systems had a median price of $2,700/kWh,
Bars represent the median, with error bars
representing the 80th and 20th percentiles. or $5,900/kWAC.
$7,000
– Most of these systems offer 2–3 hours of storage
$6,000 and have standard capacities of 27.0 kWh, 13.5
kWh, and 9.8 kWh.
$5,000
$4,000
$3,000
$2,000
$1,000
$0
2018 2019 2020 YTD
PV+storage: n=3706 PV+storage: n=5144 PV+storage: n=4861
Sources: CA NEM database (08/31/20); Massachusetts SMART program (11/21/20), NREL | 20• Economies of scale are evident in the 2019 project cost
Reported Price of U.S. Utility-Scale data, with the median price of systems which were 100–300
MW in size 37% lower than the median price of PV systems
PV Projects Over Time which were 5–20 MW in size.
• The historical up-front cost premium for tracking has
• The median installed price of PV has fallen by nearly 70% since 2010, diminished, with the median price of trackers within 4-6
and 20% since 2018, to $1.44/WAC ($1.15/WDC) in 2019. cents/W of the median price of fixed-tilt systems in 2018
and 2019.
• The lowest 20th percentile of project prices fell below $1.3/WAC
($0.9/WDC) in 2019. • This sample is backward-looking and may not reflect the
price of projects built in 2020 and 2021.
0
Installed Price2 (2019 $/W)
4 6 8 10 12 14 16 18 20 1.3 2.3
Median ($/W-AC) Individual Projects ($/W-AC) 3.5
8 Median ($/W-DC) Individual Projects ($/W-DC)
7 3.0
6
2.5
5
4 2.0
3
1.5
2
1 1.0
0
2010 2011 2012 2013 2014 2015 2016 2017 2018 2019 0.5
n=10 n=29 n=41 n=38 n=64 n=87 n=146 n=161 n=94 n=51
0.2 GW 0.4 GW 0.9 GW 1.3 GW 3.2 GW 2.9 GW 7.4 GW 4.0 GW 3.9 GW 2.1 GW
0.0
Installation Year 2019
Source: Bolinger, M., J. Seel, D. Robson., and C. Warner. 2020. Utility-Scale Solar Data Update: 2020 Edition. NREL | 21
Berkeley, CA: Lawrence Berkeley National Laboratory. https://emp.lbl.gov/utility-scale-solarU.S. Utility-Scale PV PPA Pricing
Levelized PPA Price CAISO West (non-ISO)
MISO SPP
(2019$/MWh)
ERCOT PJM The non-Hawaii generation-weighted average
120 NYISO Southeast (non-ISO)
ISO-NE Hawaii PPA price fell 4% y/y to $24.8/MWh in 2019,
100
but partial-year 2020 data show an increase
10 in the average to $30.3/MWh.
MW
80
• Since 2015, the generation-weighted average
60 price has fallen 46%.
• Hawaii prices are higher because of the unique
40
nature of its market.
20
150
0 MW
2015 2016 2017 2018 2019 2020
PPA Execution Date
Source: Bolinger, M., J. Seel, D. Robson., and C. Warner. 2020. Utility-Scale Solar Data Update: 2020 Edition. NREL | 22
Berkeley, CA: Lawrence Berkeley National Laboratory. https://emp.lbl.gov/utility-scale-solarU.S. Utility-Scale PV+Battery
PPA Pricing
• LBNL also collected pricing data from a sample of PV+battery hybrid • As to be expected, the premium on storage (relative
systems, which includes 39 PPAs in 7 states totaling 4.2 GWAC of PV to a PV-standalone PPA price) is highly dependent on
and 2.3 GWAC of batteries. the amount of storage added (relative to the size of
• Since 2015, the overall trendline in PPA price trends downwards. the PV system).
Levelized Storage Adder (2019 $/MWh-PV)
$120 $20
Levelized PPA Price (2019 $/MWh-PV)
$100
30 MW
Hawaii $15 (battery
$80 capacity)
Hawaii 20
$60 Arizona MW
200 $10 300 MW
Nevada (battery
MW
$40 California capacity)
New Mexico
$20 Colorado $5
Florida
$0
Jul-15 Jan-16 Jul-16 Jan-17 Jul-17 Jan-18 Jul-18 Jan-19 Jul-19 Jan-20 Jul-20
$0
PPA Execution Date 0% 10% 20% 30% 40% 50% 60% 70% 80% 90% 100%
Battery Capacity as % of PV Capacity
Source: Bolinger, M., J. Seel, D. Robson., and C. Warner. 2020. Utility-Scale Solar Data Update: 2020 Edition. NREL | 23
Berkeley, CA: Lawrence Berkeley National Laboratory. https://emp.lbl.gov/utility-scale-solar• Though PV module and component pricing are still at
historically low levels, many companies are still finding ways to
remain profitable.
• Despite tariffs, PV modules and cells are being imported into
the United States at historically high levels, with 20.6 GWDC of
1 Global Solar Deployment PV modules and 1.7 GWDC of PV cells being imported in the first
9 months of 2020.
2 U.S. PV Deployment – Also, First Solar’s 1.9-GWDC thin-film plant was operating at a high
utilization rate.
3 PV System Pricing • In H1 2020, U.S. c-Si module production dipped 9% from the
historical high it reached in H2 2019, because of pandemic-
4 Global Manufacturing related factors.
• In H1 2020, U.S. PV cell production decreased 66% from H2
5 Component Pricing 2019, and virtually no panels were produced in Q2 2020.
6 Market Activity • The pandemic and the shift in demand to larger-format
products appears to have helped the competitive position of the
Global Soft Costs Trends larger firms, which can more easily manage overseas logistics
and upgrade equipment, and have other cost and sales
advantages. NREL | 24PV Manufacturers’ Margins
40%
Gross Margin (%) Operating Margin (%) • The median gross margin of the publicly
30%
traded PV companies represented to the
20% left increased in Q3 2020; margins are at
10% relatively high levels historically.
Margins
0% • There continues to be significant
-10% variation by individual companies as
-20% individual factors come into play.
-30%
-40%
Q1 Q3 Q1 Q3 Q1 Q3 Q1 Q3 Q1 Q3 Q1 Q3 Q1 Q3 Q1 Q3 Q1 Q3 Q1 Q3 Q1 Q3
'10 '10 '11 '11 '12 '12 '13 '13 '14 '14 '15 '15 '16 '16 '17 '17 '18 '18 '19 '19 '20 '20
Lines represent the median, with error bars representing 80th and 20th percentiles for the following
companies in Q3 2020: Canadian Solar, First Solar, LONGi, Motech Industries, Tongwei, Maxeon, Risen,
Shanghai Aerospace, Trina Solar, and United Renewable Energy. Margin data from Hanwha Q Cells, Jinko
Solar, JA Solar, Renesola, Sunpower, and Yingli are also included from Q1 2010 to Q1 2020 where available.
Source: Company figures based on public filings and finance.yahoo.com. NREL | 25• Despite tariffs, PV modules were imported at
Module and Cell Import Data historically high levels in the first 9 months of
2020.
– 20.6 GWDC of PV modules were imported Q1–Q3
1,000 5000
Cells ($) Modules ($) 2020.
900 4500
Cells (MW) Modules (MW) – 1.7 GWDC of cells were imported Q1–Q3 2020.
800 4000
– Starting February 7, 2020, Section 201 tariffs dropped
PV Imports into the U.S. (MWDC)
from 25% to 20%, although additional tariffs still exist
PV Imports into U.S. ($MM)
700 3500
for Chinese products.
600 3000
500 2500 • In addition to imports, First Solar’s 1.9-GWDC Ohio
400 2000
manufacturing facility averaged over 100%
capacity utilization in Q2 and Q3 2020.
300 1500
200 1000 • With 5.5 GWDC of annual c-Si PV module assembly
capacity, 1.7 GWDC of imported cells in the first 9
100 500
months of 2020 implies a 42% utilization rate.
0 0
– The actual utilization rate may be slightly higher
Jul-16
Jul-17
Jul-18
Jul-19
Jul-20
Apr-16
Apr-17
Apr-18
Apr-19
Apr-20
Jan-16
Jan-17
Jan-18
Jan-19
Jan-20
Oct-16
Oct-17
Oct-18
Oct-19
because of the domestic production of cells and the
drawing down of inventory.
Sources: First Solar public filings; Imports, by Value and MW: U.S. International Trade Commission, 2020; NREL | 26
Wood Mackenzie Power and Renewables/SEIA: U.S. Solar Market Insight Q3 2020.Q1–Q3 2020 U.S. Module
Imports by Tariff
• In the first 9 months of 2020, 11.6 GWDC of
14
imported PV modules did not report a tariff.
Thin-film
U.S. PV Module Imports (GWDC)
12 – Historically, most of these modules have been thin-
Modules, Not
subject to film, but in the first 9 months of 2020, most of
10
Section 201 them (8.0 GW) were reported to be c-Si and
8 exempt from the Section 201 duties—largely from
South Korea, Vietnam, Thailand, and Malaysia.
6 c-Si Exempt • Most of these were likely bifacial modules,
Section 201 from
which were exempt from duties for most of
4 Duty Reported Section 201
2020, despite legal challenges. However, in
Section 201
2 Dutiable, but November 2020 the U.S. Court of International
No Duty Trade reinstated the tariffs.
0 Reported
– For approximately 0.8 GW of imported c-Si
Section 201 Duty No Section 201 Duty
modules—subject to Section 201—no duties
Reported Reported
were reported. Why this happened is unclear.
Note: Module data uses codes: 8541406015, 8541406020, 8541406035. We assume all modules not subject to Section 201 tariffs are reported under “Free under
HS Chapters 1-98” or “Entered into U.S. Virgin Islands,” with exemptions coming from HTS code 8541406015, and technologies not applicable reported under HTS
code 854140603. We assume all panels subject to Section 201 duties have been reported under “Dutiable- HS chapter 99.” NREL | 27
Source: Imports, by MW: U.S. International Trade Commission, 2020.• In October, the United States initiated a Section 301
Module and Cell Imports investigation of Vietnam for currency manipulation.
by Region – From Q1 to Q3 2020, 27% of imported PV modules
(over 5 GWDC) and 9% of imported PV cells came from
Vietnam.
• From Q1-Q3 2020, most PV modules and cells were imported from Asia.
– Under Section 301, there are 25% tariffs on a wide
– Cell imports concentrated in fewer countries due to the cell
range of Chinese goods, including PV modules and cells.
manufacturing locations of companies with U.S. module assembly
capacity (e.g., Hanwha and LG [South Korea]; China Sunergy, • If Vietnam is found to be in violation, the United States
Seraphim Solar, and Jinko Solar [China]). could impose tariffs as soon as January, shortly before the
2020 inauguration.
Q1-Q3 2020 U.S. Module Imports by Region (20.6 GWDC) Q1-Q3 2020 U.S. Cell Imports by Region (1.7 GWDC)
Malaysia
South Korea
9%
9% China
Thailand
13% Vietnam
16%
China 9%
5%
Taiwan
Vietnam Rest of Asia
7%
Note: Cell data uses HTS 27% 6%
codes: 8541406030, N. America South Korea Rest of Asia
8541406025; module data 1% 57% 5%
uses codes: 8541406015, Malaysia N. America
8541406020, 8541406035 Europe 0.02%
34% ROW 0.001%
Sources: Imports, by value
2%
and MW: U.S. International
Trade Commission, 2020. NREL | 28• From Q3 2019 to Q2 2020, U.S. module and cell
Chinese PV Imports imports from China increased dramatically.
– The Section 201 bifacial exemption was enacted in
• Until late 2019, Chinese PV imports into the United States June 2019 before imports took off.
had decreased steadily over the decade. • China has a significant bifacial PV manufacturing capacity.
– Chinese PV cell imports fell first with tariffs introduced in 2012,
• From Q2 to Q3 2020, U.S. imports of Chinese PV modules
and these were followed by subsequent module tariffs in 2014.
and cells dropped precipitously, falling from 8% of total
imports to 2%—before the removal of the bifacial
exemption.
Percentage of U.S. PV Imports from China Monthly Module and Cell Imports from China
70% 700
Section 201, Dutiable, Duty Reported
Monthly Imports (MWDC)
60% % of Module Imports from China 600
% of Cell Imports from China Section 201, Dutiable, No Duty Reported
50% 500
Section 201, Duty Free
40% 400
300
30%
200
20%
100
10%
0
0% Q1 Q2 Q3 Q4 Q1 Q2 Q3 Q4 Q1 Q2 Q3
2010 2011 2012 2013 2014 2015 2016 2017 2018 2019 Q1-Q3 2018 2018 2018 2018 2019 2019 2019 2019 2020 2020 2020
2020 NREL | 29
Sources: Imports, by Value and MW: U.S. International Trade Commission, 2020.Cell Import Data
by Tariff
2.5 A 2.5-GWDC quota (February 7, 2020–February
U.S. Annual Cell Import Cap
6, 2021) exempts the first 2.5 GW of imported c-
PV Cells Imported Into U.S. (GWDC)
2.0 Si PV cells, subject to the Section 201 tariff.
• In the previous period, the United States came close
1.5 to, but did not exceed the 2.5 GW PV cell quota.
• As of November 30, 2020, 1.7 GW of cells—or 67%
1.0
of the total allowable to be exempted—fell under
the quota.
0.5
• If the February–November 2020 trend continues
through the remainder of the period, the United
0.0 States would not exceed the 2.5 GW by February
2021; however, the slowdown in cell imports may be
related to the pandemic.
Note: Cell data uses HTS codes 8541406025.
Sources: Imports, by MW: U.S. International Trade Commission, 2020; U.S. Customs and Protection Commodity Status Reports. NREL | 30U.S. Module and • In H1 2020, U.S. c-Si module production dipped 9%
from the historical high it reached in H2 2019, because
Cell Manufacturing of pandemic-related factors.
– Though manufacturing was mostly categorized as
3,000 an “essential business,” there were international
Excess Capacity shipping-related logistical issues, and many
2,500 manufacturers took actions to reduce the
Production
U.S. PV Manufacturing (MWDC)
potential for virus outbreaks.
2,000
– In the first half of 2020, U.S. c-Si cell production
was still up 19%, y/y.
1,500
• Despite pandemic-related issues, thin-film
1,000 manufacturer First Solar grew production 31% and
doubled capacity from H2 2019 to H1 2020, as part of
500 its larger effort to increase its global manufacturing
capacity.
0
H1 H2 H1 H2 H1 H2 H1 H2 H1 H1 H2 H1 H2 H1 H2 H1 H2 H1 H1 H2 H1 H2 H1 H2 H1 H2 H1 • In H1 2020, U.S. PV cell production decreased 66%
'16 '16 '17 '17 '18 '18 '19 '19 '20 '16 '16 '17 '17 '18 '18 '19 '19 '20 '16 '16 '17 '17 '18 '18 '19 '19 '20
from H2 2019, and virtually no panels were produced
c-Si Cells c-Si Modules Thin-film
in Q2 2020.
– Panasonic halted cell production for 2 months
because of pandemic-related concerns. It also
Source: Wood Mackenzie Power and Renewables/SEIA: U.S. Solar Market Insight Q3 2020 and planned to fully stop production in Q3 2020.
previous U.S. Solar Market Insight reports. NREL | 31Current Tariffs (and Shipping Costs) on
Imported Modules to the United States
• Shipping costs have dropped
recently, but they still can add 10%
Monofacial PERC Bifacial
to the factory-gate prices.
China China
China China China (All China China China (All
(Canadian ROW (Canadian ROW
(Trina)
Solar)
(Jinko) others) (Trina)
Solar)
(Jinko) others) • On top of module factory-gate plus
shipping costs, the United States
Shipping &
10% 10% 10% 10% 10% 10% 10% 10% 10% 10% has imposed tariffs as high as 61%
Handling
for monofacial modules from
Section 201 20% 20% 20% 20% 20%
China, though this is down to 20%
Section 301 25% 25% 25% 25% 25% 25% 25% 25% from most other countries* (down
from 30% two years ago).
AD 0% 3.19% 3.19% 3.19% 0% 3.19% 3.19% 3.19%
– The current bifacial exemption from
12.70
CVD 11.76% 9.70% 12.70% 11.76% 11.76% 9.70% 11.76% Section 201 tariffs cuts 20% off
%
Combined
combined tariff rates for all bifacial
57% 58% 61% 60% 20% 37% 38% 41% 40% 0% modules entering the United States.
Tariffs
NREL | 32
*Note: Taiwan excluded from this analysisTariff Impact on U.S. Module
Pricing, Q2 2020
$0.40 U.S. Pricing (WoodMac)
U.S. Pricing (WoodMac)
• In Q2 2020, Wood Mackenzie reported an
$0.35 average U.S. monofacial mono c-Si PERC
$0.30 CVD module price of $0.39/W and a bifacial price
AD of $0.36/W.
$/Watt
$0.25
Section 301
$0.20
Section 201
– Global ASP during that time was reported to be
$0.15 Shipping $0.15/W-$0.20/W lower.
$0.10 ASP
$0.05 • The various tariffs and shipping can add
$0.00 $0.03/W to $0.16/W.
China (Trina)
China (Trina)
China (Canadian S.)
China (Canadian S.)
China (All others)
China (All others)
China (Jinko)
China (Jinko)
ROW
ROW
– Other friction, supply/demand imbalances, or
buyer characteristics, likely make up the gap
between the bottom-up cost analysis and Wood
Mackenzie’s reported numbers.
Monofacial PERC Bifacial
NREL | 33
Sources: PVInsights; Wood Mackenzie.Additional U.S. Module Related
Costs: Residential
$0.60 Module premium due • Beyond shipping and tariff costs, U.S. buyers
to historical inventory incur additional costs that can push final
$0.50 prices from a $0.2/W global price to above
Module-related sales
$0.5/W final price.
$0.40
tax
– Many residential installers have historical
$/Watt
module inventories they are carrying, with costs
$0.30
that often exceed current levels.
Supply-chain cost
$0.20
(module price premium – Smaller installers typically incur a price
due to small-scale premium, often via purchases through
procurement) wholesalers.
$0.10 U.S. ASP
– Many, though not all, states have sales tax.
$0.00
Small Installers Large Installers
NREL | 34
Sources: PVInsights; Wood Mackenzie.PV Shipment Rankings • PV InfoLink attributed the pandemic and the shift
to larger format products to the dramatic increase
in dominance of large Chinese manufacturers.
– Large companies could more easily upgrade to large
Rank H1 2020 Shipments format products and secured overseas logistics
Cells Modules channels.
1 Tongwei (10 GW-20 GWDC)* Jinko Solar (7.9 GWDC) – The top 10 companies shipped approximately 85% of
2 Aiko (4 GW-6 GW)* LONGi (~7 GW) global module in H1 2020, compared to 60%–70% over
3 Runergy (3 GW-5 GW)* Trina Solar (~5 GW) the past few years.
4 ShanXi Lu’An (2.5 GW)* JA Solar (~5 GW)
5 Solar Space Canadian Solar (5.1 GW) • The largest cell manufacturers also grew in market
6 Hanwha Q Cells share in H1 2020 because of cost and sales
7 Risen Energy advantages, and compatibility with larger wafers.
8 First Solar (2.5 GW)
9 Chint (Astronergy) – The top five companies significantly grew PV cell
10 Suntech shipment in H1 2020, with Tongwei, Aiko, and Runergy’s
shipments growing 31%, 83%, and 100%, respectively,
*Estimates based on reported capacity compared to H1 2019.
– With new PV cell capacity coming online in H2 2020 as
well, PV InfoLink believes many older cell fab lines may
be eliminated.
NREL | 35
Source: PV InfoLink, 1H20 cell shipment rankings, 2020H1 Module shipment ranking.Manufacturing Expansion by
Leading Suppliers
• In 2019 and 2020, some of the leading PV manufacturers • In recent history, these companies have made
announced significant manufacturing expansion plans increased capacity announcements of similar
throughout the supply chain, increasing capacity by 1–9X. orders of magnitude increases, and they have
– The minimum threshold for many of these commitments are 20 generally achieved their goals.
GWDC, with several being 2-5X that size.
100
90
Production Capacity (GWDC)
80 2023
70
2022
60
50 2021
40 2020
30 H1 2020
20
2019
10
0 2018
Actual
Actual
Actual
Actual
Actual
Actual
Actual
Actual
Actual
Actual
Actual
Actual
Actual
Actual
Actual
Actual
Actual
Announced
Announced
Announced
Announced
Announced
Announced
Announced
Announced
Announced
Announced
Announced
Announced
Announced
Announced
Announced
Announced
Announced
2017
2016
2015
JA Solar Jinko LONGi GCL Aiko Canadian JA Solar Jinko LONGi Tongwei Trina Canadian JA Solar Jinko LONGi Trina GCL
Solar Solar
Wafer Cell Module NREL | 36Manufacturing Expansion by • Several European-based manufacturers
partnered with large Chinese companies to
Leading Thin-Film Suppliers significantly expand CIGS and CdTe production.
– While these partnerships have resulted in the
• Several thin-film manufacturers have announced major construction of pilot plants, they have not yet moved
to the next phase of rapid scale-up.
manufacturing expansions of non-c-Si based technology.
– Except for First Solar, these plans have not yet come to fruition • CIGS in particular is finding more success in
nontraditional applications, such as BIPV.
8 15 GW
Production Capacity (GWDC)
7 Long-term
6 Near-term
5 2022
4 2021
3 2020
2 H1 2020
1 2019
2018
0
Actual
Actual
Actual
Actual
Actual
Actual
Actual
Actual
Announced
Announced
Announced
Announced
Announced
Announced
Announced
Announced
2017
2016
2015
Solar Frontier CNBM/Avancis CNBM/Singulus Manz GCL Oxford Photovoltaic CNBM/CTF Solar First Solar
NREL | 37
CIGS Perovskites CdTe1 Global Solar Deployment • Significant disruptions in the polysilicon industry over the
summer affected pricing throughout the supply chain.
Prices have stabilized since then, holding relatively flat.
2 U.S. PV Deployment
• Even with supply-chain disruptions, BNEF reported global
3 PV System Pricing mono c-Si module pricing around $0.20/W and multi c-Si
module pricing around $0.17/W.
4 Global Manufacturing • In Q2 2020, U.S. mono c-Si module prices fell, dropping
to their lowest recorded level, but they were still trading
5 Component Pricing at a 77% premium over global ASP.
6 Market Activity
Global Soft Costs Trends
NREL | 38PV Value Chain
Spot Pricing
$0.30 • Supply disruptions in the polysilicon industry
$0.25 caused PV module and component prices to
Average Selling Price ($/W)
increase in July and August 2020, but they
$0.20
mostly stabilized from September through
$0.15 November.
$0.10 • Even with the supply-chain price increases,
BNEF reported global mono c-Si module
$0.05
pricing below $0.20/W and multi c-Si module
$0.00 pricing below $0.17/W.
– BNEF began reporting price differences based on
wafer/cell sizes, which vary 2–3 ¢/W between
Polysilicon Cells (mono) 158.75-mm and 210-mm cells.
Modules (mono c-Si) Modules (multi c-Si)
Source: BNEF Solar Spot Price Index (12/03/20).
Kilogram to watt conversion: 4.78 grams per watt (2016); 4.73 grams per watt (2017, 2018, 2019, 2020), from Cowen & Co. (05/11/17); Deutsche Bank (07/19/17).
NREL | 39Module Average Selling Price:
Global versus United States
$0.8 • In Q2 2020, U.S. mono c-Si module prices
U.S. (multi c-Si)
Global (multi c-Si) fell, dropping to their lowest recorded level,
$0.7
U.S. (mono c-Si) but they were still trading at a 77%
Global (mono c-Si)
$0.6 premium over global ASP.
PV Module ASP ($/W)
$0.5
– U.S. multi c-Si module prices dropped
precipitously because of a significant lack of
$0.4 demand, to global pricing.
– Bifacial modules were trading a few cents
$0.3
below mono c-Si in the United States because
$0.2
of a temporary injunction on the Section 201
tariffs; however, they are likely to increase after
$0.1 the U.S. International Trade Court removed the
exemption.
$0.0
Q1 2015
Q2 2015
Q3 2015
Q4 2015
Q1 2016
Q2 2016
Q3 2016
Q4 2016
Q1 2017
Q2 2017
Q3 2017
Q4 2017
Q1 2018
Q2 2018
Q3 2018
Q4 2018
Q1 2019
Q2 2019
Q3 2019
Q4 2019
Q1 2020
Q2 2020
Source: Wood Mackenzie Power & Renewables / SEIA. NREL | 40Inverter Pricing
$0.40 • After tariffs were imposed on Chinese-
$0.35 made inverters, prices increased in 2019
and many manufacturers focused on
$0.30
diversifying their supply chains.
Factory Gate Price ($/WAC)
Microinverters
$0.25 Residential (string)
– Due to this diversification, the U.S. inverter
Commercial (string)
$0.20 Utility (central)
supply chain was less affected by the
pandemic outbreak in China.
$0.15
– Inverter pricing remained relatively flat in
$0.10 H1 2020.
$0.05
$0.00
Q1 Q2 Q3 Q4 Q1 Q2 Q3 Q4 Q1 Q2 Q3 Q4 Q1 Q2 Q3 Q4 Q1 Q2
'16 '16 '16 '16 '17 '17 '17 '17 '18 '18 '18 '18 '19 '19 '19 '19 '20 '20
Source: Wood Mackenzie Power & Renewables/SEIA.
NREL | 411 Global Solar Deployment • Despite the pandemic’s effect on electricity sales (a
driver of SREC demand) and PV deployment (a driver of
SREC supply), SREC markets have been relatively flat thus
2 U.S. PV Deployment far in 2020.
3 PV System Pricing • Although solar stock gains made in the beginning of 2020
were erased with the downturn in the market in March,
4 Global Manufacturing they have significantly outperformed the rest of the
market since then.
5 Component Pricing – Analysts attribute these gains to good financial performance
from companies, driven by stronger than expected global
6 Market Activity demand, despite the pandemic.
Global Soft Costs Trends
NREL | 42SREC Pricing • In April 2020, Virginia passed a mandatory RPS, with a 1%
carve-out for in-state solar facilities. It is unknown whether
SREC trading, or a central procurement program, will be
established in 2021; however, the solar alternative
• Despite the pandemic’s effect on electricity sales (a driver of SREC compliance payment is set at $75.
demand) and PV deployment (a driver of SREC supply), SREC
markets have been relatively flat thus far in 2020. • New Jersey and Massachusetts have moved away from
offering SRECs to new projects in recent years, in lieu of
– SRECTrade estimates DC has an oversupply of SRECs in 2020, but pricing has
fixed payments.
been relatively flat, y/y.
Lower-Priced Markets Higher-Priced Markets
$90 $500
$450
Price Per SREC (Simple Average)
$80
Price Per SREC (Simple Average)
$400
$70
$350
$60
$300
PA MD OH In-state
$50 $250
$40 $200
$30 $150
NJ DC MA
$100
$20
$50
$10
$0
$0 Jan-19 Apr-19 Jul-19 Oct-19 Jan-20 Apr-20 Jul-20 Oct-20
Jan-19 Apr-19 Jul-19 Oct-19 Jan-20 Apr-20 Jul-20 Oct-20
NREL | 43
Source: SRECTrade, https://www.srectrade.com/, accessed 12/03/20.m SRECTrade Blog (October 16, 2020; November 17, 2020).Stock Market Activity • Not all sectors or companies fared the same, but there
was fairly strong growth across most sectors.
• Although solar stock gains made in the beginning of 2020 were
erased with the downturn in the market in March, they have 2020 YTD Performance
significantly outperformed the rest of the market since then. 400%
2020 Stock Performance (Jan. 2 - Nov. 30)
– Analysts attribute these gains to good financial performance 350%
from companies, driven by stronger than expected global 300%
demand, despite the pandemic. 250%
– Compared to 10 years ago, the TAN index is virtually flat, while 200%
the S&P and Russell index are up over 1.5X. 150%
100%
250%
50%
Invesco Solar ETF (TAN)
200% S&P 500 Index 0%
% Change (Index: 06/03/19
Russell 2000
Wacker Chemie
Solargiga Energy
Tainergy Tech
Canadian Solar
First Solar
Azure Power
Meyer Burger
Daqo
Sunrun
Sunworks
Sunnova
SolarEdge
Jinko Solar
Clearway Energy
Atlantic Yield
Enphase Energy
Shunfeng
150%
Adjusted Close)
100%
50% Yieldcos Installers Inverters Manufacturers Equip.
0%
Note: The TAN index is weighted toward particular countries and sectors.
As of 08/31/20, 52% of its funds were in U.S. companies. Its top 10 holdings,
-50%
representing 63% of its value, were Sunrun, SolarEdge, Enphase, First Solar,
Jun-19 Aug-19 Oct-19 Dec-19 Feb-20 Apr-20 Jun-20 Aug-20 Oct-20 Dec-20
Xinyi, Vivint Solar, Daqo, SunPower, Solaria Energia, and Encavis.
NREL | 44
Source: Stock market: Yahoo Finance (12/09/20).1 Global Solar Deployment Despite large volumes of residential PV deployment in the
U.S., its prices have remained significantly higher than
2 U.S. PV Deployment other large markets, including Germany and Australia.
3 PV System Pricing
4 Global Manufacturing
5 Component Pricing
6 Market Activity
Global Soft Costs Trends
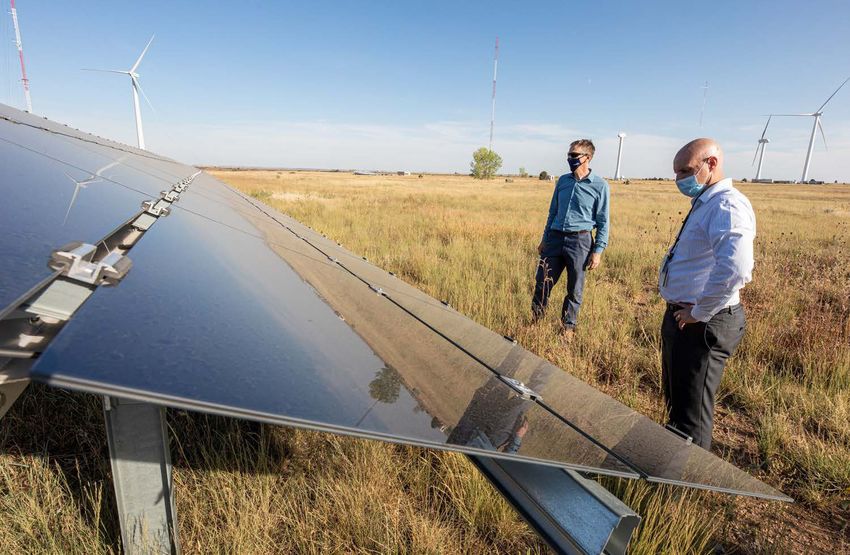
NREL | 45Residential PV System Pricing • Despite large volumes of residential PV
deployment in the United States, its prices
have remained significantly higher than
other large markets, including Germany
$/W(DC) and Australia.
10
9 • Price premium has been attributed to
8 multiple factors:
7
6 – Nonuniform, spread-out U.S. marketplace
5
– Differences in policy and financing support
4
3 2.94 – Permitting and regulatory hurdles
2
1.47 – Tariffs
1 1.08
0 – Inefficient labor practices
1Q 1Q 1Q 1Q 1Q 1Q 1Q 1Q 1Q 1Q 1Q 1Q 1Q 1Q
2007 2008 2009 2010 2011 2012 2013 2014 2015 2016 2017 2018 2019 2020 Historically, lower prices in Germany were partly
explained by having larger systems (which benefited
Germany California Australia U.S. from economies of scale); however, U.S. systems are
now, on average larger than German and Australian
residential systems.
NREL | 46
Source: BNEF, “3Q 2020 Global PV Market Outlook.”Policy Support and Financing
Australia
• Policy: In addition to some favorable state incentives, Australia’s national Small-scale Renewable Energy Scheme (SRES) credits customers based on
the size of their systems; these credits are purchased by large electricity retailers. However, installers usually purchase the certificates from their
customers upfront and system prices are typically advertised (not reported) post-subsidy. Australia also offers net (or in some cases gross)
metering.
• Financing: Most residential customers purchase PV systems using cash or a mortgage extension, with rates between 4.3% and 5.5%.
Germany
• Policy: Germany has historically offered a national feed-in-tariff to residential consumers, guaranteed for 20 years. The FIT offering goes down over
time, based on deployment, and it is currently below retail rates. Because of this, many customers are designing systems for self consumption.
• Financing: The government‐owned development bank KfW(Kreditanstalt für Wiederaufbau, or Reconstruction Credit Institute) offers—under
certain conditions—a loan interest rate of 1%. Other banks offer loans at higher rates.
United States
• Policy: The United States offers a national tax credit, which is received after taxes are filed and depends on customers’ income levels. Many
locations also depend on state-level incentives or measures, which vary widely in level of benefit and procedure.
• Financing: Many national companies offer leases, PPAs, and loans. These are typically based on personal credit, and they can involve complex
financial mechanisms to monetize the tax benefits, and a significant amount of overhead. Smaller lenders have offered loans of 6%–7%; however,
larger loan providers typically reduce their APR (which may start out at 10%) by offering a fee of 2%–4% of the value of the loan for 1% APR
reduction.
NREL | 47
Sources: IEA “NSR Australia 2018,” “NSR Germany 2017;” NREL “Terms, Trends, and Insights on PV Project Finance in the United States, 2018.”Permitting, Interconnection,
and Inspection (PII) • In Australia, no permit is required—only a
simple online interconnection request.
Inspection for rebates is provided by the
government.
• In Germany, many standards are set at the
national level and many local jurisdictions have
exempted PV from building permitting.
Interconnection, which is governed by the
European Union, involves an on-line application,
utility review, and commissioning, but no
contract is required, and Germany requires that
utilities prioritize renewables for
interconnection.
• In the United States, PII varies dramatically by
local, utility, and state jurisdiction, and it can
take many months.
• NREL benchmarks average residential U.S. PII
costs to be $0.24/W, compared to estimates of
$0.01–$0.05/W in Australia and Germany.
Sources: O’Shaughnessy et al. 2019. “Addressing the soft cost challenge in U.S. small-scale solar PV system pricing.” GTM, “How to Halve the Cost of Residential Solar in the
US.” RMI, “Lessons from Australia Reducing Solar PV Costs Through Installation Labor Efficiency.” Streamlining Photovoltaic Deployment: The Role of Local Governments in NREL | 48
Reducing Soft Costs; NREL, “Comparing Germany’s and California’s Interconnection Processes for PV Systems.”Impact of Regulatory Code on
Labor and Material
• Australia has a voluntary code of conduct, where the onus is on the
consumer to choose the best installer.
– Australian installations often have fewer grounding points, and
fewer meters as well.
– Total installation time in Australia is estimated to be 6.1 hours
compared to 9.4 hours in the United States. There is a big
difference in cost for systems installed in a day or less
compared to those which take multiple days.
• Germany also has fewer code requirements than the United States. German installers use zip-ties to
For example, German installers face significantly less onerous secure home runs*
grounding requirements. Though they still ground systems, they do
so in a way that does not require additional wiring.
• The U.S. National Electric Code dictates best practices (though it is a German installers use universal racking bases, their clay
regionally adopted standards). tile roofs are “solar ready” and they have fewer
warranty-related moisture penetration requirements
– Some have claimed no noticeable difference in quality and
safety between overseas systems and U.S. systems.
* A “home run” is an electrical cable that carries power from a solar panel to the combiner box.
Sources: Wood Mackenzie, “How to Halve the Cost of Residential Solar in the US.” RMI Lessons From Australia - NREL | 49
Reducing Solar PV Costs Through Installation Labor EfficiencyImpact of Better Business
Practices on Labor
• Some studies point to better, more-efficient business practices in Australia and Germany
than the United States. These include:
– Highly specialized roles and simplified processes and components
» Contractors prepare at the warehouse more quickly because vans are stocked with universal
equipment.
» Modules are prepped before getting on-site.
» Bases self seal and have minimal penetration so there is no need for flashing, etc.
– More efficient racking design (e.g., rail-less racking)
– Simpler electrical and component design that is due in part to less stringent regulatory codes.
– One-day builds.
• Some of these solutions have already been instituted in the United States since the
studies came out, and others are inhibited by code.
NREL | 50
Source: RMI “Reducing Solar PV Soft Costs: a focus on installation labor.” Lessons From Australia - Reducing Solar PV Costs Through Installation Labor EfficiencyTariffs
• In Q1 2020, BNEF reported that the average selling price • Most of the price discrepancy can be
of modules in the United States was approximately 83% attributed to several import tariffs the United
higher than prices in Australia and Europe. States has imposed (AD/CVD and Section 301
– These numbers exclude wholesaler markups, taxes, and for Chinese products and Section 201 for most
other friction, which are common to all three residential others). Though these U.S. tariffs have gone
markets. down over time, U.S. modules are still trading
at a significant premium, while customers in
Q1 2020 Average Mono c-Si Module Price Germany (which got rid of most of its tariffs)
0.50 and Australia can get modules at global
0.40
averages. Australia may also benefit from
lower shipping costs.
ASP ($/W)
0.30
0.20
• In addition to tariffs on modules, the United
0.10
States also has tariffs on Chinese inverters
0.00 (Section 201), and on steel and aluminum
U.S. EU Australia
(Sections 232 and 201), which increases U.S.
prices over global averages. NREL | 51
Source: BNEF, “3Q 2020 Global PV Market Outlook.”Customer Acquisition
• The CEO of Sungevity estimates that customer acquisition costs in Australia are $0.08/W ($400) compared to $0.50/W ($2,500) in the
United States.
– Because it is cheaper, faster, and easier to install, it is cheaper, faster, and easier to sell.
• Australia and Germany have much higher levels of solar adoption and the rules there are less regionally specific, so there is a much
shorter (if any) education process. There are approximately:
– 1.8 million PV systems in Germany for a population of 80 million
– 2.4 million PV systems in Australia for a population of 25 million
– 2.5 million PV systems for population of 328 million.
The U.S. population is also spread farther apart, while U.S. solar adoption is relatively concentrated, so some areas have much
lower penetration levels than average.
• Australia ($0.14/kWh–$0.30/kWh) and Germany ($0.35/kWh) have higher-priced electricity than the United States ($0.13/kWh),
and it is sunnier in Australia, providing better system production, on average.
• Germany and Australia also benefit from low cancelation rates because there are no permit wait times, a more straightforward value
proposition (due to national rules, cheaper systems and expensive electricity), and easier financing options.
• U.S. residential PV systems usually involve a bilateral contract on an existing structure, in which the installer seeks out the customer.
Sources: O’Shaughnessy et al. 2019. “Addressing the soft cost challenge in U.S. small-scale solar PV system pricing.” IEA PVPS “NSR Australia
2018,” “NSR Germany 2017;” GTM, “How to Halve the Cost of Residential Solar in the US.” German Solar Association (BSW-Solar) (2020): NREL | 52
“Statistical data on the German Solar Power (Photovoltaic) Market”, Berlin.You can also read