Global Macro Outlook Q3 | 2020 - An uneven recovery begins - Manulife Investment ...
←
→
Page content transcription
If your browser does not render page correctly, please read the page content below

Q3 | 2020
Global Macro
Outlook
An uneven recovery begins

Frances Donald                           Sue Trinh
Global Chief Economist and Global Head   Senior Macro Strategist
of Macroeconomic Strategy

Alex Grassino                            Eric Theoret
Senior Investment Strategist             Senior Investment Strategist
Introduction
The global economy is rebounding sharply after the worst economic shock of modern times. Just as the COVID-19 recession was unlike any
recession we’ve experienced before, so too will be the recovery. Crucially, the recovery won’t be even: We believe the global manufacturing
sector will rebound much more sharply than the global services sector and employment activity. The recovery will also be uneven across
economies, as countries confront a different mix of headwinds and tailwinds in the next quarter and year ahead.

What’s true for most economies, however, is that central banks and governments will continue to provide record amounts of stimulus. Central
banks have effectively prevented the economic crisis from evolving into a global financial crisis. Government stimulus has helped to buffer
the global employment shock by subsidizing households and businesses, helping them through the worst of the crisis.

And yet, this recovery isn’t without risks. Specifically, we’re still waiting for an effective treatment for COVID-19 and the possibility of surges
in infections continue to threaten the recovery process. Rising geopolitical tensions may also weigh on market sentiment and lead to a
slowdown in economic activity. Lastly, the U.S. presidential election is just around the corner and can only garner more investor attention as
we move closer to November.

While the global outlook is slightly clearer than it was three months ago, we’re still facing an unprecedented level of economic market
uncertainty. In times like this, we believe it makes sense to train our focus on the most likely chain of events, apply wide confidence bands on
our outlooks, and remain data-dependent on what’s likely to be an uneven and bumpy recovery.

                                                                                                                             Global Macro Outlook | Q3 2020
                                                                                                                                                              517849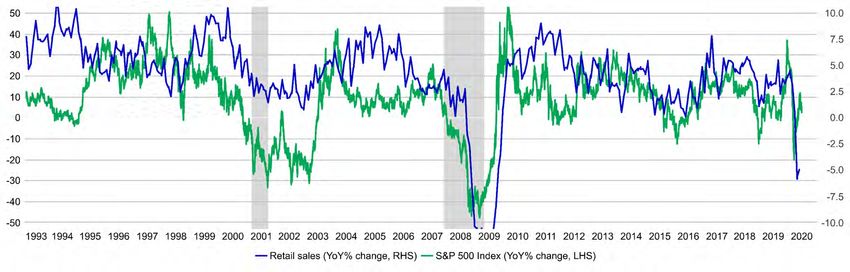
The global recovery

                      3

                          517849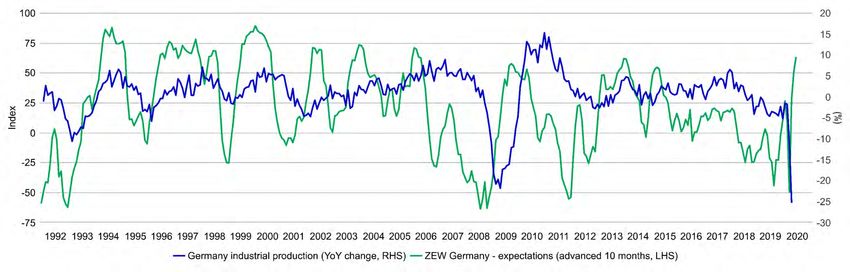
Our three-phase recovery framework
It’s time to toss out the idea that the recovery is going to be as simple as a single letter-shaped path, i.e., a V-shaped, U-shaped, or L-shaped
trajectory. Rather, we think it could be useful to think about what lies ahead as a three-phase recovery.

              Phase 1:                                                    Phase 2:                                                  Phase 3:
            Rapid rebound                                                The stall out                                           The new normal
       Now to ~September 2020                                September 2020 to year-end 2021                                                From 2022

                                                                                                                         Structural changes, amplified by the COVID-19
    Week-on-week and month-on-month data shows               Economic uplift from income support moderates as
                                                                                                                         outbreak, are brought forward by several years and
    significant improvements from mid-April, producing       one-time fiscal stimulus checks expire or are reduced       begin to materialize
    some of the largest weekly/monthly gains ever seen
                                                             Reduced operating capacity (due to social distancing
    Release of pent-up demand, which could bring 60% to      requirements) hurts business income further,                The shift toward deglobalization becomes observable
    70% of “lost” demand back online                         threatening a second wave of insolvencies                   through (i) shifting supply chains, (ii) regionalization
                                                                                                                         through the formation of trading blocs, and (iii) inflation
   Extraordinary monetary policy measures support            Unemployment in certain segments of the economy
   interest-rate-sensitive sectors (e.g., housing), floods   remains persistently high as companies that went
   system with liquidity                                     under during the outbreak couldn’t rehire. Duration of      Elevated global debt levels due to an increase in
                                                             unemployment extends, precautionary savings rise
                                                                                                                         government bond issuance, setting the stage for an era
    Record level of fiscal transfers support lost incomes,                                                               defined by calls for austerity
    raises household savings, and supports consumer
    spending                                                 U.S. presidential election risks rise, in all likelihood,
                                                             along with mounting U.S.-China trade tensions,
                                                             regardless of election outcomes                             Interest rates remain extraordinarily low, pushing asset
                                                                                                                         allocators further out the risk spectrum and into more
                                                                                                                         alternative assets in their search for yield
    Downside risks: Earlier than expected resurgence (or
    mutation) of the COVID-19 virus; premature stimulus      Upside risks: Heightened expectations of additional
    withdrawal (fiscal and/or monetary); amplification of    fiscal spending as a result of the election campaigning     An array of socioeconomic issues are amplified: How
    U.S.-China trade tensions                                process; a vaccine for COVID-19 becomes widely              can we rectify massive inequality? Is there room for
                                                             available earlier than expected                             Universal Basic Income? Modern monetary theory?

                                                                                                                                                                                       4

                                                                                                                                                                                           517849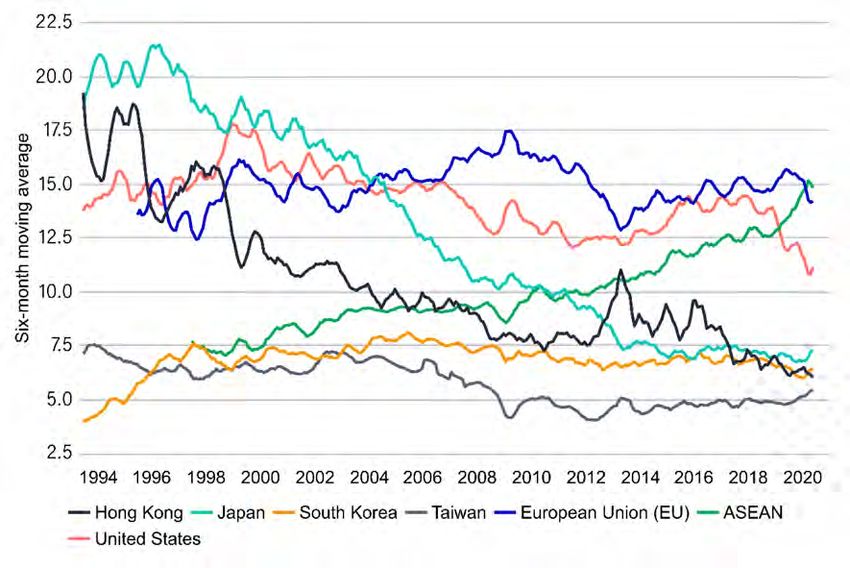
As economies reopen, global PMIs return to expansion mode
The first phase of the economic recovery, a rapid rebound, can be seen in the initial recovery in global Purchasing Managers’ Indexes (PMIs),
which we expect to return to the critical 50 level (signaling expansion) in the coming months. Since the impact of the COVID-19 outbreak was
felt more keenly in the services sector, it’s no surprise that the manufacturing sector should lead the global economic rebound. However, the
resumption of economic activity is taking place at a different pace globally—Germany, for example, is among the first large global economies to
meaningfully reopen while China has seen a re-shuttering of parts of its economy, as measured by the Oxford University Stringency Index.

Global Purchasing Managers’ Indexes¹                                                          Oxford University COVID-19 Stringency Index (%)2

                                        1 IHS Markit, Macrobond, Manulife Investment Management, as of June 18, 2020. The gray area represents a contraction.
                                        2 University of Oxford, Macrobond, Manulife Investment Management, as of June 18, 2020.                                 Global Macro Outlook | Q3 2020
                                                                                                                                                                                                 517849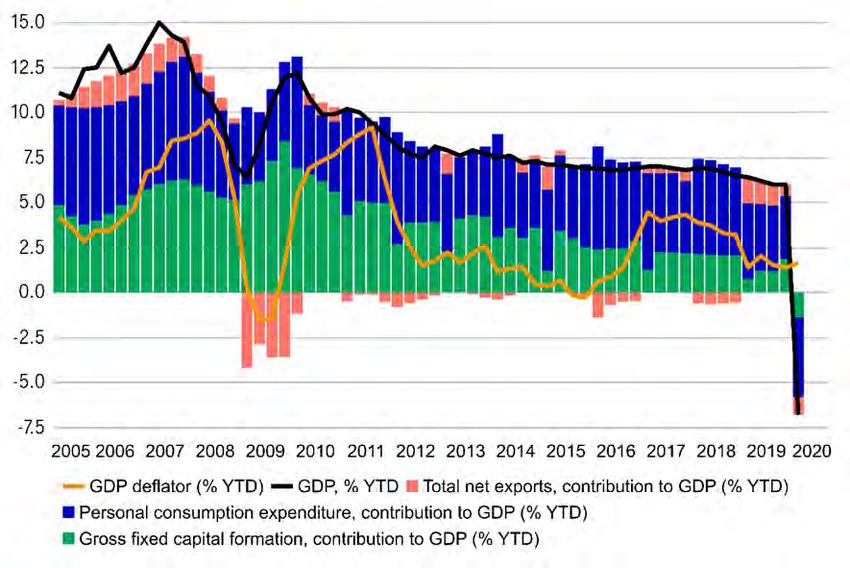
High-frequency data suggests the global economy bottomed in mid-April
The COVID-19 outbreak has led to an unprecedented contraction in economic activity in modern history. We turned to alternative sources of
data to have a better understanding of global economic recovery processes. Daily and weekly data, such as Google mobility data and the
number of passenger arrivals that cleared U.S. TSA checkpoints, suggests that the worst of the economic downturn had occurred by mid-
April, and since then, incremental improvements have been accruing. In our view, reliance on ultra-high-frequency data will likely continue as
markets will need to monitor how the economy responds to the evolution of the COVID-19 outbreak very closely.

Google mobility data: retail and recreation¹                                                           Passengers through U.S. TSA checkpoints2

                                               1 Google, Macrobond, as of June 18, 2020. 2 U.S. Department of Homeland Security, Macrobond, as of June 18, 2020.   Global Macro Outlook | Q3 2020
                                                                                                                                                                                                    517849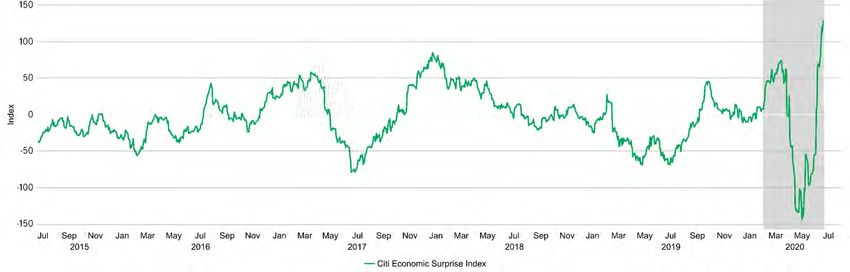
Tremendous central bank accommodation is here to stay
Since March, global central banks have been providing extraordinary and unprecedented levels of support to the global economy. We aren’t
expecting major new announcements from central banks in Q3 as they adopt a wait-and-see approach; however, we believe they could still act
should the situation require it. In our view, central banks have, through their various initiatives, provided important support to rate-sensitive
industries, and broadly speaking, prevented a credit crisis from taking place. However, their actions have also exacerbated the existing “search
for yield” narrative that we believe has contributed to—and will continue to—be a key driver behind recent gains in the equity market.

Central bank main policy rates (%)¹                                                               Central bank balance sheet as % of GDP2

                                         1 Macrobond, as of June 15, 2020. 2 Bloomberg, Macrobond, as of June 30, 2020. The gray area represents recession.   Global Macro Outlook | Q3 2020
                                                                                                                                                                                               517849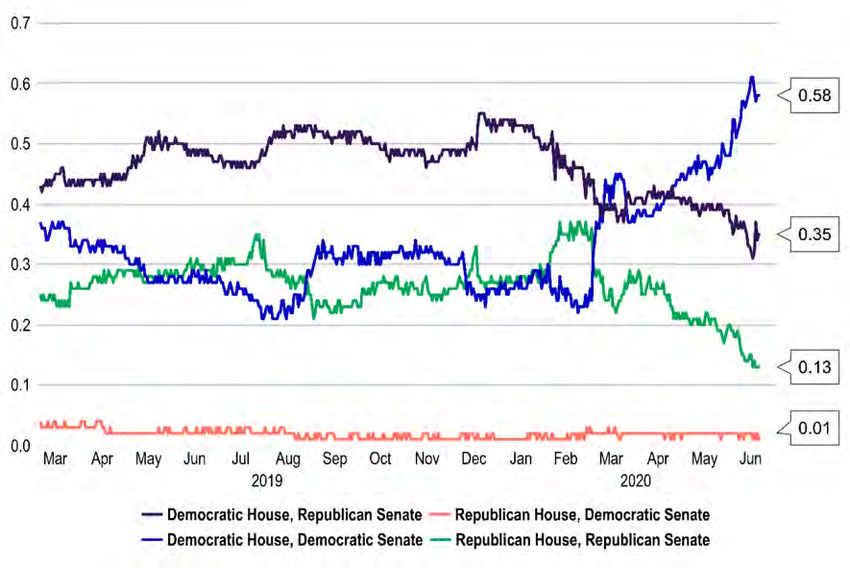
Heightened geopolitical risks are clouding the economic outlook
Several geopolitical factors could upend an otherwise strong initial rebound in Q3. These include U.S.-China trade relations, the China-Hong
Kong relationship, China-India tensions, Brexit-related risks, and threats to European Union solidarity. November’s U.S. presidential election
will also be a key market driver, but we’re more focused on the balance of power in Congress than individual presidential candidates. Estimates
of future U.S. fiscal spending, U.S. dollar strength, and how each might interact with the factors listed above will likely fluctuate along with
changes in the odds of a Democratic sweep across Congress and the presidency.

Economic Policy Uncertainty Index¹                                                                PredictIt election odds: balance of power after 2020 election2

                                        1 Economic Policy Uncertainty, Macrobond, as of June 15, 2020. The gray areas represents recession. 2 PredictIt, Macrobond, as   Global Macro Outlook | Q3 2020
                                        of June 15, 2020.
                                                                                                                                                                                                          517849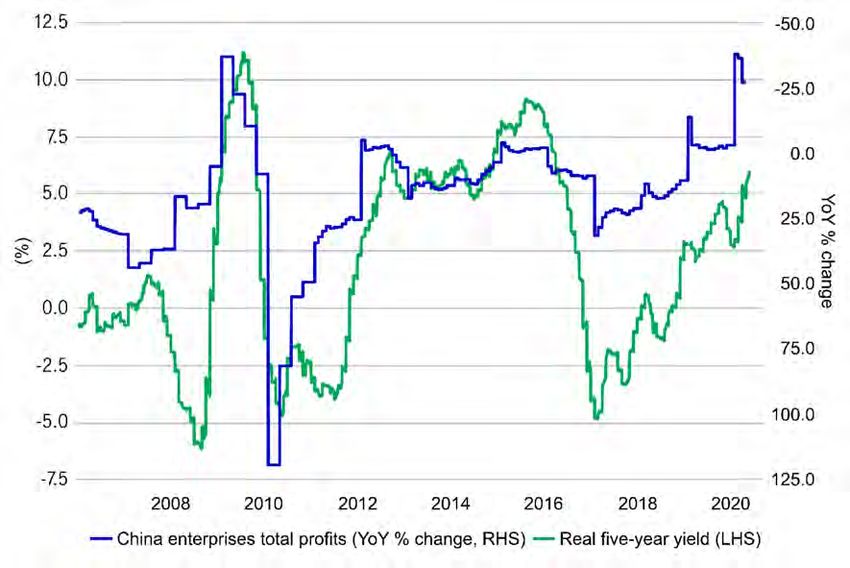
United States

                9

                    517849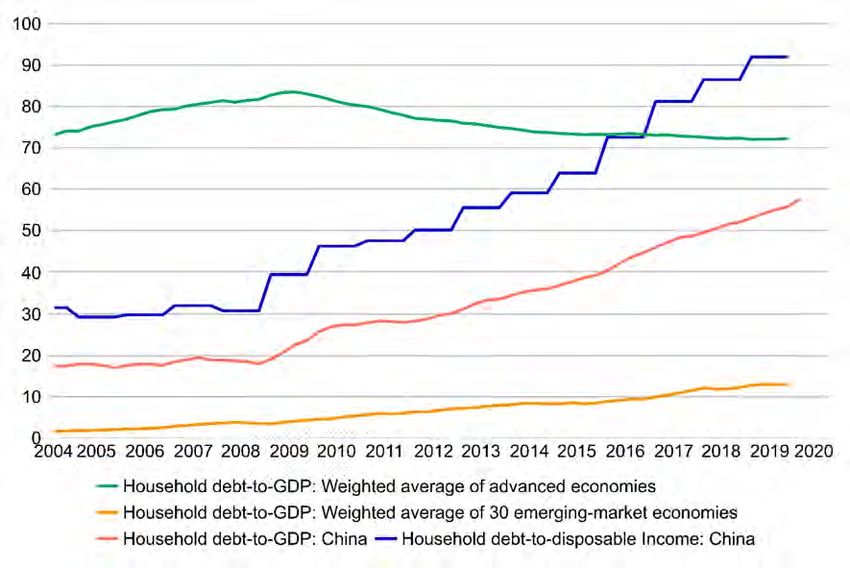
We’ve entered phase one of the recovery: a steep, initial ascent
The U.S. economy has entered the first phase of our three-stage recovery framework and is exhibiting an aggressive rebound. Although
March and April produced some of the largest falls in economic print ever recorded, the month of May recorded some of the strongest month-
on-month surges in economic data in modern history. Notably, this record-breaking data surpassed consensus expectations by a wide
margin, pushing the U.S. Citi Economic Surprise Index to new highs.1 While consensus expectations among economists will likely eventually
catch up; the scale of the collective “miss” suggests the stock market was significantly ahead of economists during this phase.

The U.S. Citi Economic Surprise Index¹

                                         1 Citi, Macrobond, as of June 15, 2020. The gray area represents recession.   Global Macro Outlook | Q3 2020
                                                                                                                                                        517849
COVID-19’s shock to U.S. jobs was unprecedented, with a long way left to go
A record 22.1 million jobs were lost in two months as the unemployment rate hit a record 14.7% in April—no amount of sugarcoating can
change the fact that it’s a devastating number. While May created 2.5 million jobs, the economy will have to add another 19.6 million jobs
before the labor market returns to pre-COVID-19 levels.1 That said, nearly 70% of those who have lost their jobs believe they’ll return to their
jobs soon. If that turns out to be true, roughly two-thirds of those who lost their jobs could be rehired soon. However, that’ll still leave the U.S.
jobless rate at high single digits by year end (~8% to 9%), contributing to our stall-out narrative in the second stage of the recovery.
U.S. nonfarm payrolls (rolling 12-month change, millions)¹ U.S. continuing jobless claims (millions)¹
1 U.S. Bureau of Labor Statistics, Macrobond, as of June 15, 2020. The gray area represents recession. Global Macro Outlook | Q3 2020
517849Federal fiscal transfers are buffering the employment shock
Despite record unemployment, U.S. households didn’t demonstrate the type of pullback in spending that would be typical in such a situation.
This is partly due to the high level of government transfers, such as stimulus checks and unemployment insurance benefits. For instance,
wages and salaries for U.S. households fell by US$1 trillion in April, but aggregate government transfer receipts (direct support from the
government) rose by US$3 trillion in the same month. With a shut economy, that cash couldn’t be initially spent and ended up as savings to
be used later. However, these data points can mask the challenges that lower-income households face as a result of the economic fallout.
U.S. personal income: wages and salaries vs. government transfers¹ U.S. personal savings rate (%)2
1 U.S. Bureau of Economic Analysis, Macrobond, as of June 18, 2020. 2 U.S. Department of Labor, Macrobond, as of June 15, Global Macro Outlook | Q3 2020
2020. The gray area represents recession.
517849More encouraging signs
In addition to federal fiscal support, which has been helping to buffer the employment shock, we’re also seeing strength in some areas that
are supporting this initial period of recovery. U.S. mortgage activity, for instance, has recovered, supported by low interest rates and
surprisingly resilient consumer confidence. Equally important, business loan applications have swiftly rebounded and are now back to pre-
pandemic levels. Both of these developments run in stark contrast to what happened shortly after the global financial crisis and support our
view that a strong rebound is likely in Q3.
Mortgage purchase applications¹ Business applications have rebounded2
1 Mortgage Bankers Association (MBA), Macrobond, as of June 15, 2020. 2 U.S. Census Bureau, Macrobond, as of June 15, Global Macro Outlook | Q3 2020
2020. The gray area represents recession.
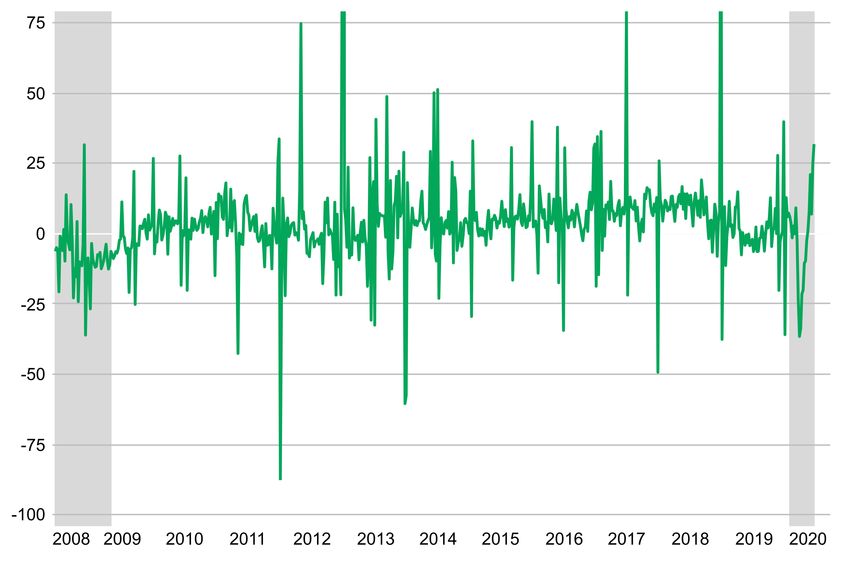
517849The stock market/economy connection
While we consistently emphasize that the economy is not the stock market, there are important connections between the two. Take for
instance the historically strong correlation between the market returns posted by the S&P 500 Index and U.S. retail sales activity.1 This
makes sense: Better market returns support broad confidence, but they also create a wealth effect. The stock market’s rebound since the
end of March will likely provide an additional tailwind to retail sales activity when lockdowns lift. However, should we experience another
pullback in the markets, that implies that consumer activity would weaken.
The S&P 500 Index’s performance vs. U.S. retail sales (%)¹
1 S&P Dow Jones Indexes, U.S. Census Bureau, Macrobond, as of June 18, 2020. LHS refers to left-hand side; RHS refers to Global Macro Outlook | Q3 2020
right-hand side. YoY refers to year on year.
517849The U.S. federal government’s finances are a long way from sound
In our view, one of the biggest macro risks in Q3 is the potential for waning fiscal support, specifically, the possible expiration or reduction of
unemployment insurance benefits on July 31. As the United States finds itself in its worst fiscal shape in centuries, it’s only natural that calls for
restrain will get louder as the economy recovers. However, a high unemployment rate means the government might need to not just maintain,
but increase its support for job seekers. Meanwhile, rising fiscal debt can have longer-term market implications: An increase in U.S. Treasury
issuance at the long end might steepen the yield curve and could potentially make austerity measures a necessity in the longer term.
U.S. federal debt as % of GDP (Congressional Budget Office forecasts)¹ U.S. budget deficit as % of GDP (Congressional Budget Office forecasts)
1 U.S. Bureau of Labor Statistics, Macrobond, as of June 15, 2020. The section in blue represents projections. 2 Congressional Global Macro Outlook | Q3 2020
Budget Office, Office of Management and Budget, Macrobond, as of June 15, 2020. The section in black represents projections.
517849China
16
517849A sharp economic contraction but pace of recovery disappoints
China’s Q1 GDP growth contracted sharply, led by a fall in private consumer spending. Activity data is bouncing back as the economy has
reopened, but unlike many developed-market economies, the pace of recovery has—in our view—fallen short of expectations. Consensus
GDP growth for 2020 has been downgraded from 4.00% (year on year) at the start of April to 1.75% as of June 12.
Contributions to Chinese GDP¹ Sharp bounce back from the lows, but at a disappointing pace2
1 Macrobond, Manulife Investment Management, June 13, 2020. YTD refers to year to date. 2 Macrobond, Bloomberg, June 13, Global Macro Outlook | Q3 2020
2020. LHS refers to left-hand side; RHS refers to right-hand side.
517849Reigniting consumer spending is challenging given level of household debt
Weak domestic demand is a major headwind to economic growth and China isn’t alone in that regard, but what makes the country’s
challenge unique is the high level of household debt. As a percentage of GDP, China’s household debt rose significantly from ~20% to ~60%
since 2010, and the fact that it’s much higher than the emerging-market average of ~15%. As a percentage of disposable income, China’s
household debt was inching toward the 100% level before the COVID-19 outbreak tamed the trajectory.1 In our view, the saturation of
household debt also suggests a higher risk to financial stability.
Weak labor market and domestic demand1 China’s household debt stands out for the wrong reason (%)1
1 Macrobond, Manulife Investment Management, June 13, 2020. YoY refers to year on year. LHS refers to left-hand side; RHS Global Macro Outlook | Q3 2020
refers to right-hand side.
517849China lagging in monetary and fiscal easing
In a world where governments have abandoned traditional fiscal constraints, and where just about every central bank is doing whatever it
takes to loosen domestic monetary/financial conditions, the People’s Bank of China (PBOC) stands out for its reluctance to join the liquidity
party. Since the start of the year, the PBOC has shrunk its balance sheet while the Bank of Japan, the European Central Bank, and the U.S.
Federal Reserve have expanded their balance sheet assets dramatically. On the fiscal side, the country’s fiscal impulse to date comes in at
under 2% of GDP, much smaller than many other economies.1
PBOC is lagging global balance sheet expansion¹ China is lagging on the fiscal front2
4.0
2.0
0.0
-2.0
-4.0
-6.0
-8.0
-10.0
-12.0
-14.0
Thailand
Vie tnam
Philippine s
Pe ru
U.K.
Turke y
China
Argentina
Switzerand
Chile
Unite d S tate s
Brazil
Italy
France
Czec h Republic
Indonesia
South Africa
Colombia
Poland
Russia
Japan
EU
Malaysia
South Korea
Germany
Hong Kong
Hungary
Canada
India
Australia
New Ze aland
Spain
Singapore
Mexico
1 Macrobond, Manulife Investment Management, June 13, 2020. 2 Manulife Investment Management, as of June 13, 2020. Global Macro Outlook | Q3 2020
517849Domestic monetary conditions are tightening as U.S. dollar inflows slow
Deflationary pressures in China remain acute. Producer price index inflation fell 3.7% from a year ago, weaker than expected.1 It’s worth noting
that deepening industrial deflation can flow through to deepening profit deflation. In our view, this is due to tight monetary conditions: China’s
unable to loosen domestic conditions because of a sharp slowdown in U.S. dollar (USD) inflows. From 2000 to 2015, large USD inflows
enabled the PBOC to expand its balance sheet. But it had to be more cautious on this front since 2016 as balance sheet expansion has come
from expanding renminbi (RMB) monetary base in the absence of USD inflows. If unchecked, this could place downward pressure on the RMB.
Domestic monetary conditions are too tight¹ PBOC can’t expand its balance sheet aggressively without USD inflow1
1 Macrobond, Manulife Investment Management, June 13, 2020. YoY refers to year on year. Global Macro Outlook | Q3 2020
517849Asia
21
517849Turning on a machine is much easier than turning on consumption
The relative difficulty in turning consumption growth back on relative to a machine is underscored by the different trajectories that the region’s
Purchasing Managers’ Index (PMI) and Consumer Confidence Index have embarked on in recent months. As production comes back online
and aggregate PMI shows some signs of bottoming out, there’s not yet a bottom in place for aggregate consumer confidence.
Weighted average Asia PMI¹ Weighted average Asia consumer confidence1
1 Macrobond, Manulife Investment Management, June 13, 2020. Global Macro Outlook | Q3 2020
517849Strong headwinds to GDP growth
Without a full return of consumer confidence in Asia, aggregate GDP growth will remain under pressure after registering the slowest pace of
growth since 2009.1 Against that backdrop, some central banks have more room than others to cut policy rates—Malaysia and Thailand
stand out as two economies with very high real interest rates given the level of deflation that they’ve experienced. In the meantime, India
occupies the other end of the spectrum, as its real policy rate is already in negative territory.
GDP growth in Asia (YoY % change)¹ Some central banks have less room than others to cut interest rates (%)1
1 Macrobond, Manulife Investment Management, as of June 13, 2020. YoY refers to year on year. Global Macro Outlook | Q3 2020
517849Low public debt isn’t a license to cut blank checks
There are real constraints on governments in terms of their ability to deliver fiscal support—just because an economy has low public debt
doesn’t mean its government can write blank checks to fund growth. In our view, a more holistic approach to fiscal wherewithal must take into
account an economy’s dependence on external financing. On the surface, Indonesia might seem to be in a strong position to deliver large
fiscal stimulus packages, but with foreign debt ownership at close to 60%, it could be exposed to capital flight risk. In contrast, Japan’s high
public debt ratio may look worrying, but low foreign debt ownership means its government has more room to move from a fiscal perspective.
Gross public debt as a % of GDP¹ Foreign holdings of outstanding debt as a % of total debt1
1 Macrobond, Manulife Investment Management, as of June 13, 2020. Global Macro Outlook | Q3 2020
517849A silver lining for ASEAN countries amid the trade war and COVID-19
Nomura’s leading index of Asian exports is signaling that aggregate export growth in the region could shrink between 10% and 20% (relative to
last year) in the months ahead. Further downside risk to global trade comes from the worsening U.S.-China relations, a development that poses
challenges for the Association of Southeast Asian Nations (ASEAN), a highly trade-dependent region. However, its experience in the past two
years suggests it has the ability to navigate these challenges. China has looked increasingly to ASEAN to offset the impact of the trade war and
COVID-19. ASEAN’s share of Chinese trade overtook that of the United States in early 2019 and is now China’s largest trading partner.1
Trade indicator for Asian exports sends a warning sign (YoY % change)¹ ASEAN takes a bigger share of Chinese trade (YoY % change)1
1 Macrobond, Nomura, Manulife Investment Management, June 13, 2020. LHS refers to left-hand side; RHS refers to right-hand side. Global Macro Outlook | Q3 2020
YoY refers to year on year.
517849India’s banking sector remains weak
A risk to India’s medium-to-long-term positive structural growth story is the banking sector’s ability to support the recovery. The banking sector
entered the crisis in a relatively weak position with nonperforming assets (NPAs) at stubbornly high levels. While the extension of the
moratorium on debt repayments will provide relief to companies, banks will bear the brunt. It’s likely that NPAs will rise when the moratorium
ends in September. Although bank lending to nonbanking financial companies (NBFCs) has risen sharply, many banks didn’t grant
moratoriums on debt repayments to NBFCs. Defaults will likely rise in the NBFCs that lend to micro, small, and medium enterprises.
Bank lending to NBFCs has risen sharply in recent years¹ India’s bad loan problem stands out among its EM peers (%)1
1 Macrobond, Manulife Investment Management, June 13, 2020. LHS refers to left-hand side, RHS refers to right-hand side. Global Macro Outlook | Q3 2020
517849Europe
27
517849Expectations for a rebound in Germany
The expectations subcomponents of a wide variety of sentiment indicators have surged over the past couple of months, delivering a significant
reversal from the lows we saw during the shutdown, showing that Germany—and Europe—are entrenched in the first phase of recovery. This
is supported by the upbeat tone of the respondents who participated in the various economic surveys. Specifically, the latest recovery in the
German ZEW (financial market experts) expectations subcomponent offers an incredibly constructive outlook for German industrial production
data while also strengthening the broader European growth narrative given Germany role as the continent’s growth engine.
German ZEW sentiment expectations and German industrial production¹
1 Bloomberg, Macrobond, Manulife Investment Management, as of June 18, 2020. LHS refers to left-hand side, RHS refers to Global Macro Outlook | Q3 2020
right-hand side. YoY refers to year on year.
517849Low inflation expectations imply the need for sustained policy stimulus
Euro-area inflation expectations fell to a record low in late March, touching 71 basis points as market participants priced the worst of the
economic fallout. Policy action from the European Central Bank (ECB) helped to arrest the decline, and subsequent political efforts have
solidified reflationary impulse in the euro area, and expectations for future inflation are now stabilizing. However, the latest readings remain
well short of the ECB’s 2% price stability target, and are likely to encourage the need for significant additional policy stimulus.
The EUR five-year/five-year forward inflation swap (%) 1
1 Bloomberg, Macrobond, Manulife Investment Management, as of June 18, 2020. The five-year/five-year forward inflation swap Global Macro Outlook | Q3 2020
rate is widely used as an indicator of where financial markets expect inflation to be five years from now.
517849The European Recovery Fund is a game changer
The European Recovery Fund, spearheaded by French President Emmanuel Macron and German Chancellor Angela Merkel, aims to help EU
countries that are most affected by the COVID-19 crisis. The proposal would see the issuance of €500 billion in bonds, building on existing
monetary policy tools (PEPP, the pandemic emergency purchase program) that have sought to limit the extent of fragmentation in the region’s
sovereign bond markets while still allowing for price discovery within an accepted range. Reducing sovereign yield spreads assists with the
transmission of the ECB’s monetary policy as it seeks to strengthen the recovery in the hopes of achieving its price stability target.
Spreads between the German bund and the Italian BTP tightens1
1 Bloomberg, Macrobond, Manulife Investment Management, as of June 19, 2020. The gray area represents recession. Global Macro Outlook | Q3 2020
517849Flood of central bank liquidity offers upside risk for the euro
Global central bank reserve accumulation has historically offered upside risk for the euro, as evidenced by the strong correlation between
official purchases of typical reserve assets and the single currency. In our view, this is likely to inform the euro’s move in the near term. The
latest crisis saw emerging-market (EM) policymakers favor exchange rate weakness over foreign exchange reserve depletion. We believe
their efforts to resist exchange rate appreciation (in the hope of cementing an economic recovery) will offer upside risk for the euro as EM
central banks add to their reserves.
EUR/USD vs. foreign official purchases of U.S. securities
1 Bloomberg, Macrobond, Manulife Investment Management, as of June 19, 2020. The gray area represents recession. LHS refers Global Macro Outlook | Q3 2020
to left-hand side; RHS refers to right-hand side.
517849Canada
32
517849Experiencing a similar economic shock as the United States …
Like most major developed-market economies, Canada is in the midst of its largest growth and employment shock in modern economic
history. The unemployment rate in the country remained at its highest level on record in April, even as the U.S. labor market improved.1
Canada is also buffering its employment shock with exceptional levels of monetary and fiscal policy, and as such, is likely to experience a
“rapid rebound” recovery in the coming months, led by the Canadian manufacturing sector.
Canadian unemployment rate (%)¹ Canadian real GDP (QoQ % change)¹
1 Bloomberg, Macrobond, Manulife Investment Management, as of June 19, 2020. QoQ refers to quarter on quarter. Black Global Macro Outlook | Q3 2020
columns represents Bloomberg consensus forecasts. The gray area represents recession.
517849… but with different and bigger challenges
While Canada may appear similar to the United States during its initial rebound, the country entered the COVID-19 crisis with a far more
fragile economy. Canadian consumers face very elevated debt servicing costs relative to their U.S. neighbors. While the Bank of Canada’s
interest-rate cuts have reduced some of that expense, nearly 14.7% of the average Canadians’ take-home pay still goes toward repaying the
interest and principle on their debt.1 Canadian consumers also don’t save as much as their U.S. neighbors. While precautionary savings
have risen slightly in light of recent government stimulus, it’s more likely to be an anomaly than a trend.
Household debt service ratio: Canada vs. the United States (%)¹ Canadian personal savings rate (%)¹
1 Statistics Canada, Macrobond, Manulife Investment Management, as of June 18, 2020. The gray areas represent recession. Global Macro Outlook | Q3 2020
517849Canadian capital expenditure remains lackluster
Canada’s challenges aren’t isolated to its consumer sector—business investment has also disappointed over the past year, weighing on growth
instead of supporting it. Part of the problem is the structural weakening of its energy patch, exacerbated by depressed oil prices. In 2014, nearly
one-third of all capital expenditures originated from the energy sector; today, it only accounts for about 15% of all capital investment. While
policymakers have worked to reduce red tape, enhance Canada’s competitiveness, and did much to encourage the development of new
sectors, the absence of consumer spending in the coming year requires a step up from business activity, which isn’t likely to happen.
Contribution to GDP from nonresidential business investment (%)¹ Share of total capital expenditures heading to energy sector (%)¹
1 Statistics Canada, Macrobond, Manulife Investment Management, as of June 16, 2020. The gray area represents recession. Global Macro Outlook | Q3 2020
517849Important information
A widespread health crisis such as a global pandemic could cause substantial market volatility, exchange trading suspensions and closures, and affect portfolio performance. For example, the novel coronavirus disease (COVID-19) has resulted in significant
disruptions to global business activity. The impact of a health crisis and other epidemics and pandemics that may arise in the future, could affect the global economy in ways that cannot necessarily be foreseen at the present time. A health crisis may exacerbate other
preexisting political, social, and economic risks. Any such impact could adversely affect the portfolio’s performance, resulting in losses to your investment. Investing involves risks, including the potential loss of principal. Financial markets are volatile and can fluctuate
significantly in response to company, industry, political, regulatory, market, or economic developments. These risks are magnified for investments made in emerging markets. Currency risk is the risk that fluctuations in exchange rates may adversely affect the value of
a portfolio’s investments.
The information provided does not take into account the suitability, investment objectives, financial situation, or particular needs of any specific person. You should consider the suitability of any type of investment for your circumstances and, if necessary, seek
professional advice.
This material, intended for the exclusive use by the recipients who are allowable to receive this document under the applicable laws and regulations of the relevant jurisdictions, was produced by, and the opinions expressed are those of, Manulife Investment
Management as of the date of this publication and are subject to change based on market and other conditions. The information and/or analysis contained in this material has been compiled or arrived at from sources believed to be reliable, but Manulife Investment
Management does not make any representation as to their accuracy, correctness, usefulness, or completeness and does not accept liability for any loss arising from the use of the information and/or analysis contained. The information in this material may contain
projections or other forward-looking statements regarding future events, targets, management discipline, or other expectations, and is only as current as of the date indicated. The information in this document, including statements concerning financial market trends,
are based on current market conditions, which will fluctuate and may be superseded by subsequent market events or for other reasons. Manulife Investment Management disclaims any responsibility to update such information.
Neither Manulife Investment Management or its affiliates, nor any of their directors, officers, or employees shall assume any liability or responsibility for any direct or indirect loss or damage or any other consequence of any person acting or not acting in reliance on the
information contained herein. All overviews and commentary are intended to be general in nature and for current interest. While helpful, these overviews are no substitute for professional tax, investment, or legal advice. Clients should seek professional advice for their
particular situation. Neither Manulife, Manulife Investment Management, nor any of their affiliates or representatives is providing tax, investment, or legal advice. This material was prepared solely for informational purposes, does not constitute a recommendation,
professional advice, an offer, or an invitation by or on behalf of Manulife Investment Management to any person to buy or sell any security or adopt any investment strategy, and is no indication of trading intent in any fund or account managed by Manulife Investment
Management. No investment strategy or risk management technique can guarantee returns or eliminate risk in any market environment. Diversification or asset allocation does not guarantee a profit or protect against a loss in any market. Unless otherwise specified,
all data is sourced from Manulife Investment Management. Past performance does not guarantee future results.
Manulife Investment Management
Manulife Investment Management is the global wealth and asset management segment of Manulife Financial Corporation. We draw on more than a century of financial stewardship to partner with clients across our institutional, retail, and retirement businesses
globally. Our specialist approach to money management includes the highly differentiated strategies of our fixed-income, specialized equity, multi-asset solutions, and private markets teams, along with access to specialized, unaffiliated asset managers from around
the world through our multimanager model.
These materials have not been reviewed by and are not registered with any securities or other regulatory authority, and may, where appropriate, be distributed by the following Manulife entities in their respective jurisdictions. Additional information about Manulife
Investment Management may be found at manulifeim.com/institutional.
Australia: Hancock Natural Resource Group Australasia Pty Limited, Manulife Investment Management (Hong Kong) Limited. Brazil: Hancock Asset Management Brasil Ltda. Canada: Manulife Investment Management Limited, Manulife Investment Management
Distributors Inc., Manulife Investment Management (North America) Limited, Manulife Investment Management Private Markets (Canada) Corp. China: Manulife Overseas Investment Fund Management (Shanghai) Limited Company. European Economic Area and
United Kingdom: Manulife Investment Management (Europe) Ltd., which is authorized and regulated by the Financial Conduct Authority; Manulife Investment Management (Ireland) Ltd., which is authorized and regulated by the Central Bank of Ireland Hong
Kong: Manulife Investment Management (Hong Kong) Limited. Indonesia: PT Manulife Aset Manajemen Indonesia. Japan: Manulife Investment Management (Japan) Limited. Malaysia: Manulife Investment Management (M) Berhad (formerly known as Manulife
Asset Management Services Berhad) 200801033087 (834424-U). Philippines: Manulife Asset Management and Trust Corporation. Singapore: Manulife Investment Management (Singapore) Pte. Ltd. (Company Registration No. 200709952G). South
Korea: Manulife Investment Management (Hong Kong) Limited. Switzerland: Manulife IM (Switzerland) LLC. Taiwan: Manulife Investment Management (Taiwan) Co. Ltd. United States: John Hancock Investment Management LLC, Manulife Investment
Management (US) LLC, Manulife Investment Management Private Markets (US) LLC, and Hancock Natural Resource Group, Inc. Vietnam: Manulife Investment Fund Management (Vietnam) Company Limited.
Manulife Investment Management, the Stylized M Design, and Manulife Investment Management & Stylized M Design are trademarks of The Manufacturers Life Insurance Company and are used by it, and by its affiliates, under license.
Global Macro Outlook | Q3 2020
517849Definitions
Purchasing Managers’ Indexes Purchasing Managers’ Indexes (PMI) are used as a leading indicator of the economic health of a country’s manufacturing
(PMI) sector (Manufacturing PMI) and services sector (Services PMI). Manufacturing PMI measures the health of the
manufacturing sector based on five major indicators: new orders, inventory levels, production, supplier deliveries, and the
employment environment. The Services PMI is the equivalent for the services sector, covering transport and communication,
financial intermediaries, business and personal services, computing and IT, and hotel and restaurants. It is not possible to
invest directly in an index.
Bloomberg Barclays U.S. Corporate The Bloomberg Barclays U.S. Corporate High Yield Bond Index tracks the performance of the U.S. dollar-denominated,
High Yield Index high-yield, fixed-rate corporate bond market. It is not possible to invest directly in an index.
Global Macro Outlook | Q3 2020
517849You can also read