IR Presentation FY2021 - (For the Year Ended on March 31, 2021) For details of the "Long-Term Management Plan 2030", which began from April 2020 ...
←
→
Page content transcription
If your browser does not render page correctly, please read the page content below
FY2021
                                    (For the Year Ended on March 31, 2021)

                                 IR Presentation

For details of the "Long-Term Management Plan 2030", which began from April 2020, please refer to the following link.
                                                        https://www.mec.co.jp/j/investor/plan/pdf/plan200124.pdf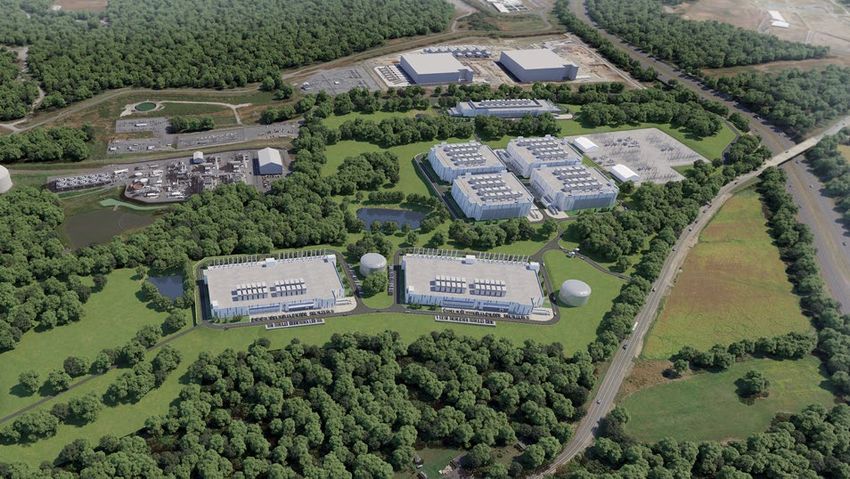
Contents
Summary of Financial Statements 3
Summary of FY2021Results and FY2022 Estimates 4
Progress of the Long-Term Management Plan 12
Financial Supplemental Data 22
Overview of the "Long-Term Management Plan 2030" 30
Business Overview 40
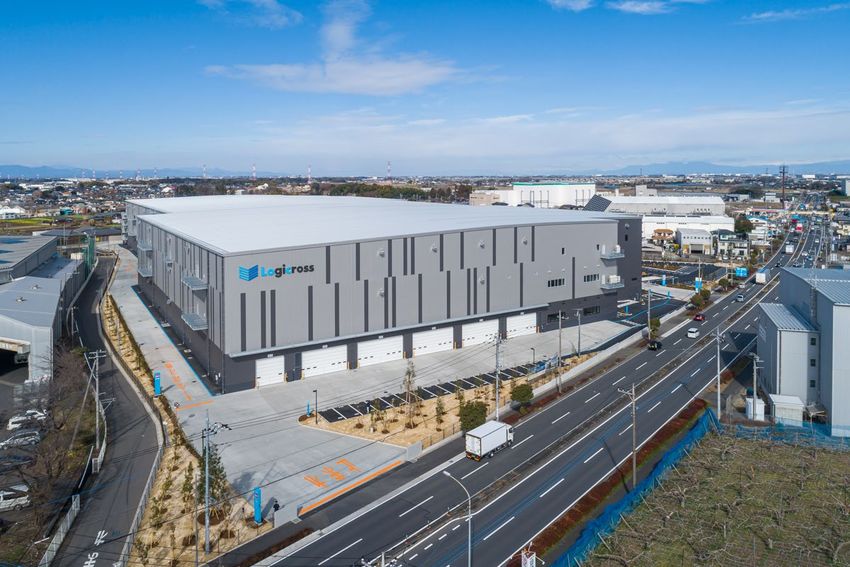
Commercial Property Business
Office Building 43
Outlet Malls, Retail Properties, Logistics Facilities, Hotels, and Airports 57
Residential Business 62
International Business 67
Other Business 70
Investment/Financial Data, etc. 72
ESG Initiatives 77
MITSUBISHI ESTATE CO., LTD. 2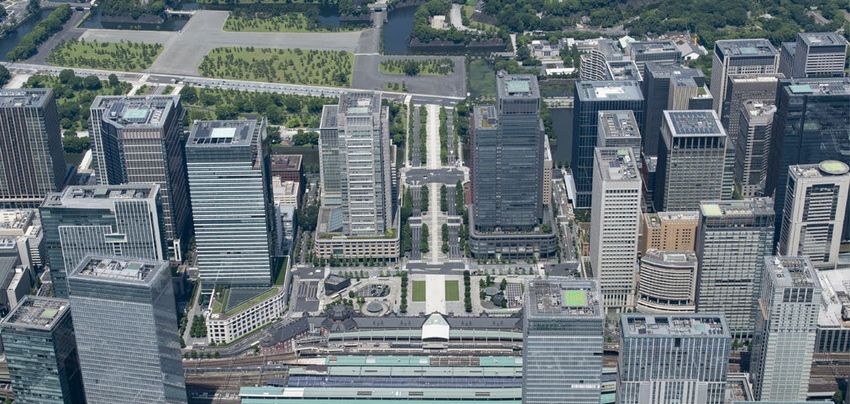
Summary of Financial Statements

Summary of Financial Statements

 <FY2021 Financial Results>
   •    While rental profit from office buildings increased on a YoY basis, revenue from operations and operating income
        decreased compared with the previous FY due to the impact of COVID-19 on retail properties and hotels.

   •    Dividends per share for the entire fiscal year have increased by 1 yen (from 30 yen to 31 yen.) as a result of an increase
        in profits in comparison to recent estimates.

 <FY2022 Estimates>
   •    Overall increase is expected when compared to previous FY as a result of the completion of new buildings and increases
        in capital gains. Operating income is expected to reach its highest numbers.
   •    As a result of profit recoveries, FY2022 have recovered to FY2020 numbers from 31 yen to 33 yen.

 <Major Topics>
   •    Decided to switch to renewable energy sources for all electricity used in office buildings owned in the Marunouchi area
        by FY2023 (Jan. 2021).
   •    Decided share buyback of 30 billion yen (Apr. 2021).
   •    Launched (Tentative name) Uchikanda 1-chome Project (Apr. 2021).
   •    Entered the US data center development project (May 2021).

MITSUBISHI ESTATE CO., LTD.                                                                                                       3
Summary of FY2021 Results and
  FY2022 Estimates

MITSUBISHI ESTATE CO., LTD.       4
Summary of FY2021 Results and FY2022 Estimates

1. Income Statement Results for FY2021
YoY profits have decreased due to COVID-19 and a decrease in capital gains, meanwhile office
rental profits increased.                                                        Millions of yen (rounded off
                                                            Millions of yen (rounded down)   Capital Gains included in Operating Income                            to the nearest billion)
                            FY2021    FY2020                     Change                                                  FY2021                  FY2020        Change
Revenue from Operations                 1,207,594 1,302,196                   △ 94,601       Total                                      51,000                  61,000      △ 10,000
   Commercial Property Business           672,441   723,712                   △ 51,270         Commercial Property Business             32,000                  23,000         9,000
   Residential Business                   362,755   385,538                   △ 22,782         Residential Business                      7,000                  10,000       △ 3,000
   International Business                 114,457   134,175                   △ 19,718         International Business                   12,000                  28,000      △ 16,000
   Investment Management Business          22,199    21,316                        882         Investment Management Business                -                       -             -
   Other*                                  65,119    65,871                      △ 751         Other                                         -                       -             -
   Elimination                           △ 29,378 △ 28,418                       △ 960         Eliminations or corporate                     -                       -             -
Operating Income                          224,394   240,768                   △ 16,374
   Commercial Property Business           180,775   187,855                    △ 7,079
   Residential Business                    24,068    24,320                      △ 251
                                                                                                               Major Factors for Changes in
   International Business                  37,932    46,156                    △ 8,224                        Operating Income by Business
   Investment Management Business           5,966     4,467                      1,499                     Commercial
   Other*                                   △ 130       389                      △ 520                      Property        Residential
                                                                                                                              △ 251     International
   Eliminations or corporate             △ 24,219 △ 22,420                     △ 1,798                      △ 7,079                                           Others
                                                                                                                                          △ 8,224
                                                                                                                                                              △ 819
 Non-Operating Revenue                     26,292    12,377                     13,914
   (of affiliates' equity in earnings)        307       229                         77
 Non-Operating Expense                     39,720    33,574                      6,146                                                Increase in rental profits
Income before Taxes and Special Items     210,965   219,572                    △ 8,606                                                Increase in residential
                                                                                                                                      businesses in Asia
  Extraordinary Income                     16,603    26,251                    △ 9,647                                                Decrease in capital gains
  Extraordinary Loss                       26,304    21,874                      4,429          240,768
Profit Attributable to Owners of Parent   135,655   148,451                   △ 12,796                                  Increase of condominium profits                     224,394
                                                                                                                        Decrease in capital gains

                                                           Millions of yen (rounded down)                   Increase in capital gains
                                                  FY2021    FY2020            Change                        Increase in office rental profits
                                                                                                            Decrease in profits from retail properties and
Business profits                                   224,701   240,998          △ 16,296
                                                                                                            hotels due to the impact of COVID-19
EBITDA                                             331,821   336,784           △ 4,963
Interest-bearing debt                            2,526,142 2,429,883            96,259
                                                                                                 FY2020    Commercial        Residential   International      Others          FY2021
*Architectural Design & Engineering / Real Estate Service Business and Other businesses                      Property

MITSUBISHI ESTATE CO., LTD.                                                                                                                                                             5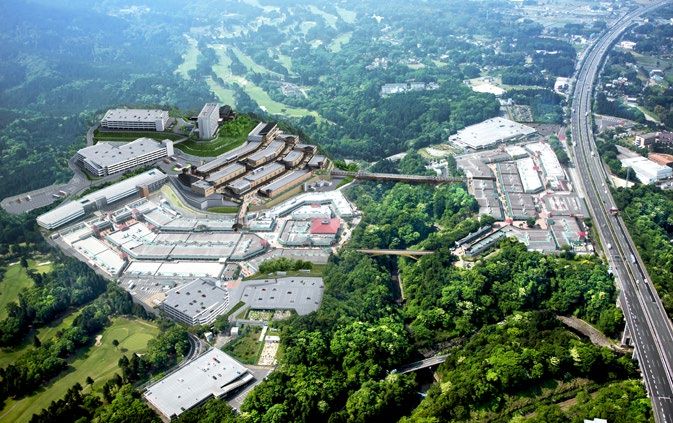
Summary of FY2021 Results and FY2022 Estimates

2. Impact of COVID-19 (Major Impacts on FY2021)
No unexpected changes on businesses. No significant changes in the impact of COVID-19 on the
retail properties and hotel businesses.
                                  Full-year impact
                                                          Full-Year       Operating Profits
                                     on FY2021
          Categories                  (Previous
                                                         Impact on        *2 Extraordinary                                Major Situations and Impacts
                                     Estimates)           FY2021          Losses
 Capital Gains                                       -                -                   -   • Reached the estimates for FY2021

                                                                                              • See p. 8 for details. In addition to urban properties, suburban properties
 Domestic
                                                     -                -                   -     also attracted higher demands
 Condominiums, etc.*1                                                                         • Steady decrease in inventory (-160 units YoY)

                                                                               ▲JPY 13.7B     • See p. 7 for details
                  Retail                                                                      • While the fourth quarter was impacted by the second declaration of
                                     ▲JPY 18.0B          ▲JPY 17.0B
                  Properties                                                                    the state of emergency, the impact was limited compared with that of the
                                                                                ▲JPY 3.3B       first declaration

                                                                               ▲JPY 14.6B     • See p. 7 for details
                                                                                              • While the fourth quarter was impacted by the second declaration of the
                  Hotels             ▲JPY 18.0B          ▲JPY 17.0B
                                                                                                state of emergency, the impact was limited compared with that of the first
                                                                                ▲JPY 2.4B       declaration
 Income                                                                         ▲JPY 0.5B     • See p. 8 for details
 Gain             Offices              ▲JPY 0.5B           ▲JPY 0.5B                          • As expected at the beginning of the FY, the leasing activities of vacancies is
                                                                                          -     taking longer than usual

                                                                                ▲JPY 5.5B     • Real estate brokerage, parking lot, and international residential businesses
                                                                                                were impacted
                  Others               ▲JPY 8.5B           ▲JPY 5.5B
                                                                                              • While the international investment management business was expected to
                                                                                          -     be impacted at the beginning of the FY, there were no impacts
                                                                               ▲JPY 34.3B
                  Subtotal           ▲JPY 45.0B          ▲JPY 40.0B
                                                                                ▲JPY 5.7B
                                                                               ▲JPY 34.3B     *1   Excluding capital gains, etc,. from the Mitsubishi Estate Residence's operating income
                          Total      ▲JPY 45.0B          ▲JPY 40.0B                           *2   Some costs incurred by retail properties and hotels that were closed during this period
                                                                                ▲JPY 5.7B          are recorded as an extraordinary loss due to COVID-19 (e.g. depreciation cost or rent)

MITSUBISHI ESTATE CO., LTD.                                                                                                                                                              6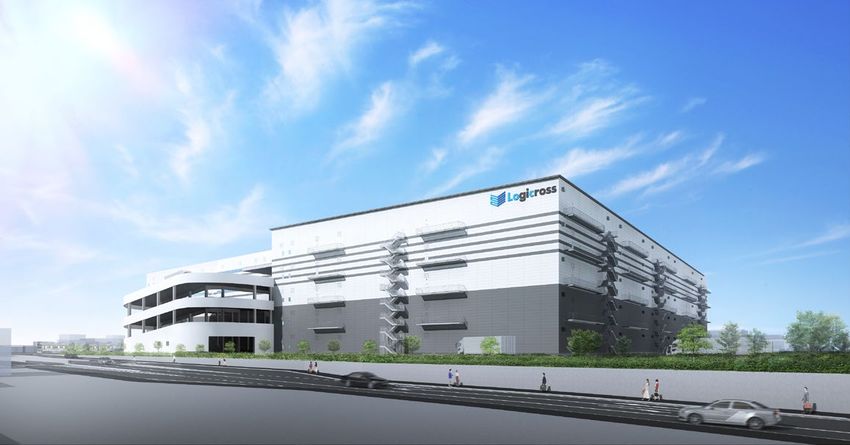
Summary of FY2021 Results and FY2022 Estimates

3. State of Businesses ①: Retail Properties and Hotels
Although the fourth quarter financial performances for retail properties and hotels were impacted by the second declaration
of the state of emergency, the impact was limited compared with that caused by the previous declaration lasting April-May
2020 (during the previous declaration, aside from a few exeptions, all properties were required to close.)

                                  *Sales Trends in Retail Properties and Outlet Malls Compared to Previous Year

                Type of facility                                 Jun.                         Jul.-Sep.                          Oct.-Dec.                          *Jan.-Mar.

 Outlet malls                                               Approx. 80%                  Approx. 80-90%                    Approx. 80-100%                       Approx. 70-80%

 Stand-alone shopping centers                               Approx. 90%                  Approx. 80-90%                    Approx. 90-100%                        Approx. 90%
 Urban, mixed-use buildings
                                                            Approx. 50%                  Approx. 50-60%                     Approx. 60-70%                        Approx. 50%
 Commercial zone
                  *   The numbers listed are compared with net sales of Feb.-Mar. 2019 due to the impact of COVID-19 on net sales of retail properties and outlet malls during Feb.-Mar. 2020

                                           Royal Park Hotels/Trend in Occupancy Rate (Jan. 2020-Mar. 2021)

     80%       74.1%

                              57.6%                                                                                               56.9%                                        59.3%
     60%                                                                                                                                     48.1%
                                                                                                                       43.6%                                        42.4%
     40%                                                                                                   29.1%
                                          22.2%                                                                                                         26.6%
                                                                                                22.3%
                                                                                     15.9%
     20%                                                                  10.4%
                                                    4.5%       1.4%
      0%
                 Jan.         Feb.       Mar.        Apr.       May.       Jun.        Jul.      Aug.        Sep.       Oct.       Nov.       Dec.        Jan.       Feb.       Mar.

MITSUBISHI ESTATE CO., LTD.                                                                                                                                                                7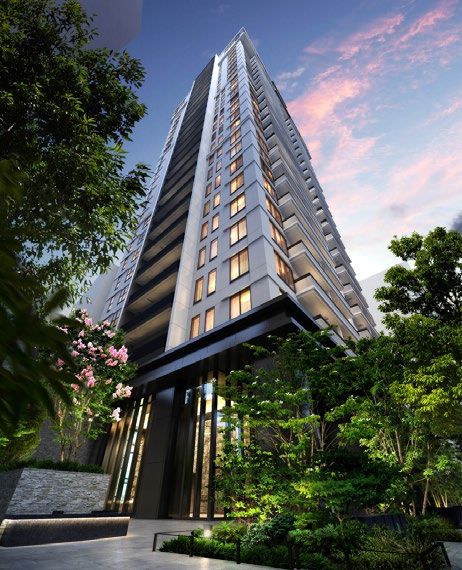
Summary of FY2021 Results and FY2022 Estimates

4. State of Businesses ②: Offices and Domestic Condominiums

                                     Trends in Offices                                                          Trends in Domestic Condominiums
 • While the office vacancy rate is increasing, levels remain low.                               • Gross margins are on the improving trend, as a result of the sale of
 • Because many companies are reluctant to extend floor space, and                                 highly-profitable properties.
   expand or relocate offices, occupying vacancies is expected to take                           • Properties in high-convenience urban areas remain in high demand.
   longer than usual.                                                                              Properties in the suburban areas are also attracting more interest.
 • The average rents are continuing to increase.                                                 • Steady decrease of finished inventory (-160 units YoY).
 ■Trends in Vacancy Rates and Average Rents                                                      ■Data for Domestic Condominiums

                                       FY2020               FY2021        FY2022(E)                                               FY2020             FY2021           FY2022(E)
   Vacancy rates                                                                                  Condominium                           202.8                 203.5        203.0
                                             1.07%             2.35%                3.0%          (bn of yen)
   (All Uses in Japan)

   Vacancy rates                             0.69%             2.50%                         -    Condominiums sold
   (Marunouchi Offices)                                                                           (units)
                                                                                                                                        3,214                 3,476        2,900

   Average rents                          ¥ 27,177           ¥ 27,793          ¥ 28,500
    (All Uses in Japan)
                                                                                                  Gross margin                         17.8%              18.7%           20.0%

                                                                                                  Inventory (units)                        373                 213                -
 ■Trends in Increased Revenues for Existing Buildings
                                                                         (Billions of yen)
                Increased annual revenues due to moving in/out                      39.6
  40.0          of tenants and rent revisions during renewals
                                                                          36.4
                Cummulative revenues from FY2015
  30.0                                                           28.4

                                                        21.9
  20.0
                                               16.0
                                      11.3
  10.0                        7.3                              6.5      8.0                      Tsudanuma The Tower(Start of delivery: FY2021)
                       4.9                   4.7      5.9
             2.42.4                 4.0                                          3.2
    0.0
             FY2015      FY2016     FY2017   FY2018   FY2019   FY2020   FY2021 FY2022(E)          The Parkhouse Takanawa Tower(Scheduled delivery: FY2022-)

MITSUBISHI ESTATE CO., LTD.                                                                                                                                                           8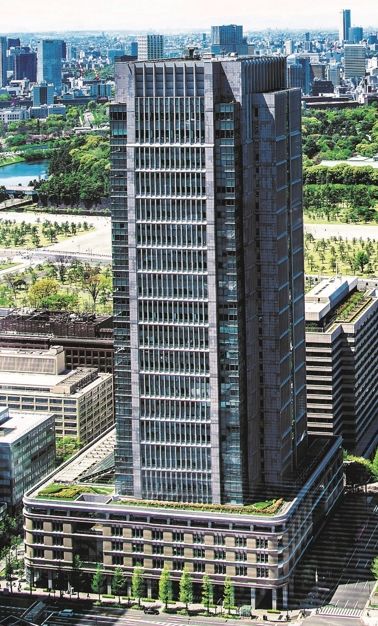
Summary of FY2021 Results and FY2022 Estimates

5. Overview of the Declarations of the State of Emergencies, and the
   Operational Status of Company-owned Facilities (as of May 13, 2021)
                                 Overview of the Declarations of the State of Emergencies (Comparison)

              Item                                   First                                           Second                                              Third

 Period                                      April-May 2020                                  January-March 2021                                   April-May 2021
                                            (Approx. 1.5 months)                                (Approx. 2 months)                                (Approx. 1 month)

                                                                                           Max. of 11 prefectures                                  4 prefectures
 Subject area                                   Nationwide                         (Tokyo, Kanagawa, Saitama, Chiba, Osaka, Hyogo,           (Tokyo, Osaka, Hyogo, Kyoto)
                                                                                         Kyoto, Aichi, Gifu, Fukuoka, Tochigi)        *Aichi and Fukuoka added from May 12, 2021

 Requests to large                                                                                                                               Request to close
                                             Request to close                       Request to shorten business hours                *Relaxed regulations in certain prefectures from
 retail properties                                                                                                                                    May 12, 2021

                              Summary of Actions Taken by the Company's Facilities Under Each Declaration

     Type of facilities                              First                                           Second                                              Third

                                    Standard business operations                       Standard business operations                     Standard business operations
 Offices                        (In principle, work at MEC offices was conducted   (Aim to decrease MEC office attendance rate to     (Aim to maintain MEC office rate at less than
                                                   remotely)                                      30% or less)                                          30%)

 Retail properties/                   Temporarily close with few                                                                          Temporarily close with few
                                                                                    Close by 8pm with few exceptions
 Outlet malls                               exceptions                                                                                          exceptions

                                                                                          Restaurants and eating                           Restaurants and eating
 Hotels                            Temporarily close some hotels
                                                                                      establishments to close at 8pm                   establishments to close at 8pm

 Condominiums                                                                        Operation continued by a 100%                    Operations continued by a 100%
                                   Temporarily close sales outlets
 (model units)                                                                          appointment-only basis                            appointment-only basis

MITSUBISHI ESTATE CO., LTD.                                                                                                                                                           9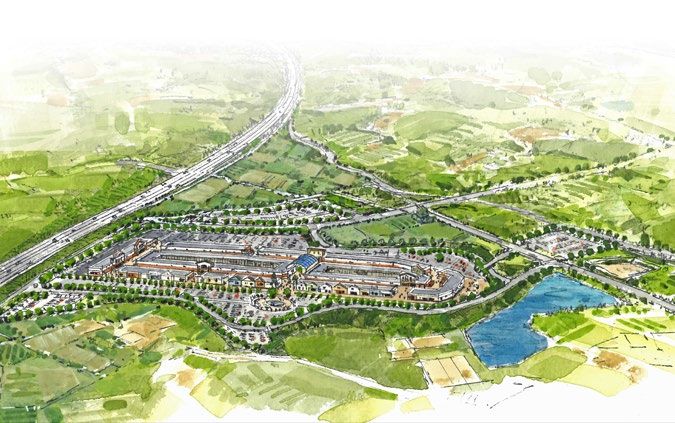
Summary of FY2021 Results and FY2022 Estimates

6. Income Statement Estimates for FY2022 (vs FY2021 Results)
Due to the completion of new buildings and increases in capital gains, operating income is
expected to reach its highest numbers.                                               Millions of yen (rounded off
                                                            Millions of yen (rounded down)   Capital Gains included in Operating Income                        to the nearest billion)
                                         FY2022    FY2021                                                                             FY2022              FY2021
                                                                  Change                                                                                    Change
                                        Estimates  Results                                                                           Estimates            Results
Revenue from Operations                 1,326,000 1,207,594                    118,406       Total                                      64,000              51,000        13,000
    Commercial Property Business          787,000   672,441                     114,559        Commercial Property Business              43,000             32,000         11,000
    Residential Business                  373,000   362,755                      10,245        Residential Business                       5,000              7,000        △ 2,000
    International Business                  96,000  114,457                    △ 18,457        International Business                    16,000             12,000          4,000
    Investment Management Business          23,000   22,199                         801        Investment Management Business                 -                   -             -
    *Other                                  72,000   65,119                       6,881
                                                                                               Other                                          -                   -             -
    Elimination                          △ 25,000 △ 29,378                        4,378
                                                                                               Eliminations or corporate                      -                   -             -
Operating Income                          245,000   224,394                      20,606
    Commercial Property Business          194,000   180,775                      13,225
    Residential Business                    24,000   24,068                        △ 68                        Major Factors for Changes in
    International Business                  42,000   37,932                       4,068
    Investment Management Business           7,000    5,966                       1,034
                                                                                                              Operating Income by Business
    *Other                                   2,000    △ 130                       2,130
    Eliminations or corporate            △ 24,000 △ 24,219                          219                    Commercial                                     Others
                                                                                                            Property     Residential International        3,383
  Non-Operating Revenue                     11,000   26,292                    △ 15,292                                                  4,608
                                                                                                             13,225        △ 68
    (of affiliates' equity in earnings)        300      307                         △7
  Non-Operating Expense                     36,000   39,720                     △ 3,720
Income before Taxes and Special Items     220,000   210,965                       9,035
                                                                                                                                   Increase in capital gains
  Extraordinary Income                      15,000   16,603                     △ 1,603
  Extraordinary Loss                        17,000   26,304                     △ 9,304
Profit Attributable to Owners of Parent   142,000   135,655                       6,345                             Increase in condominium profits                     245,000
                                                                                                224,394             Decrease in capital gains
                                                           Millions of yen (rounded down)
                                                  FY2022    FY2021
                                                                               Change
                                                 Estimates  Results                                         Increase in capital gains
Business profits                                   245,300   224,701             20,599                     Completion of new buildings
EBITDA                                             344,000   331,821             12,179
Interest-bearing debt                            2,680,000 2,526,142            153,858
                                                                                                 FY2021    Commercial     Residential     International    Others        FY2022
*Architectural Design & Engineering / Real Estate Service Business and Other businesses          Results     Property                                                   Estimates

MITSUBISHI ESTATE CO., LTD.                                                                                                                                                       10
Summary of FY2021 Results and FY2022 Estimates
7. Breakdown of Business Profits for the FY2022 (Changes from FY2020)
Expecting improved profit levels than FY2020 due to improving business environment
and increasing capital gains, etc. (Billions of yen))
Business Business Business
Profits Profits Profits
240.9 224.7 245.3
Capital Gains ▲10.0 +13.0
【Breakdown】
61.0
【Breakdown】
・Commercial: +11
64.0
・Commercial:+9
・Residential: ▲3 51.0 ・Residential: ▲2
・International: ▲16 ・International:+4
Domestic 14.7 +2.0 +4.3 21.0
Condominiums, 16.7
【Main factors】 【Main factors】
etc.*
+Favorable sales trends +Favorable sales trends
+Profit margin improvement +Profit margin improvement
(Gross margin: 17.8% → 18.7%) (Gross margin: 18.7% → 20.0%)
+3.3
【Main factors】
▲8.2 +New buildings' contributions
Income Gains 165.2 【Main factors】
157.0 +Business environment 160.3
▲COVID-19 impact improvement in retail properties
+Increase in building rental profits and hotels
+Increase in international rental +Increase in non-asset profits
profits (US) ▲Increase in repair costs
+Increase in profits from Asia ▲Decrease in rental profits due to
condominium business the sell of properties
▲Decrease in profits from buildings
due to redevelopments
FY2020 Results Differences FY2021 Results Differences FY2022 Estimates
* Excluding capital gains, etc. from the Mitsubishi Estate Residence's operating income
MITSUBISHI ESTATE CO., LTD. 11Progress of the Long-Term Management Plan MITSUBISHI ESTATE CO., LTD. 12
Progress of the Long-Term Management Plan

1. Changes in ROA/ROE/EPS

Although the first fiscal year (FY2021) of the Long-Term Management Plan was impacted by
COVID-19, strategies for the 2030 goal have been steadily executed.
                                                                                                                                  10%
   10.0%                                                                                                                                     (Yen)
                                                                                                                                               200
                                                                                                                                   200
     9.0%                                                                 8.5%

                                                                7.8%
     8.0%                                                                            7.6%       7.6%
                                                7.3%
                                                                                                                                               150
     7.0%                              6.6%

     6.0%                     5.6%                                        108.64               106.70
                    5.2%                                                             101.34
                                                                96.97                                                              5%          100
     5.0%                                       86.78

                                       74.00                    4.0%      4.1%                  4.0%
                                                3.8%                                 3.8%
     4.0%
                              60.13
                    52.85
                                       3.6%                                                                                                    50
     3.0%           3.3%      3.3%

     2.0%

     1.0%                                                                                                                                      0
                   FY2015     FY2016   FY2017   FY2018         FY2019     FY2020     FY2021   FY2022(E)                       2030 Target

                                                        EPS(right axis)   ROA      ROE             *   ROA = Business Profit / Total assets (average)

MITSUBISHI ESTATE CO., LTD.                                                                                                                        13
Progress of the Long-Term Management Plan
2. Domestic Asset Business
Increase NOI with Development Projects: Steady Progress of Large Projects
■Expected completion in
■Completion in FY2021 ■Progress of Long-Term Development Properties
FY2022
Tokiwabashi Tower Uchikanda 1-chome Project Toyosu 4-2 Project
Mizuho Marunouchi Torch Tower (Bldg. B)
Tower・Ginkokaikan (Bldg. A) (tentative name) (tentative name)
Marunouchi Terrace
Sep. 2020:
Announcement of
the zone name
Process to change
plans (increase floor
area ratio by 100%)
the ARGYLE aoyama FY2024:
Expected started
<Expand Outlet malls> Sep. 2020: Finalized urban planning Mar. 2021: Project announcement date of construction
May 2022: Expected start of Spring 2022: Expected start of
①Gotemba (Phase 4): +16,400㎡ construction construction FY2028:
②Rinku (Phase 5): +10,700㎡ 2025: Expected completion Spring 2025: Expected completion Expected completion
Promoting a rotating business model according to the real estate market
Gaining more investment opportunities than previously assumed
■Transition of Capital Gains (incl. overseas) ■Investments in FY2021 ■*Domestic Assets
Book value at end of FY2021
Recording steady capital gains every FY Obtained investment opportunities mainly for
offices, logistics facilities, and rental apartments ¥1.2 tn
Office Composition of Assets
(Billions of yen) 64.0 (Performance: +40% than expected) 2.3%
61.0
60.0 51.0 Retail 8.9%
48.0 16.0 2.1%
39.0 28.0 12.0
40.0 14.0 Rental 8.5%
15.0 apartment
20.0 48.0 Logistics
34.0 33.0 39.0 10.3%
24.0 67.8%
0.0 Hotel *Totalincome-generating
FY2018 FY2019 FY2020 FY2021 FY2022(E) assets x-Marunouchi,
(Tentative name) Outlet malls, and assets
Sagamihara-shi Chuo-ku Fuchinobe project Other
Domestic Overseas of particular consolidated
subsidiaries
MITSUBISHI ESTATE CO., LTD. 14Progress of the Long-Term Management Plan
3. International Asset Business
US Europe Asia
• First to enter the US data center development • Obtained development opportunities in several • Starting FY2021, accelerate the completion progress
project. European countries by cooperating with Europa of properties currently under development.
Capital Group, one of our Group companies.
• TA Realty, a subsidiary of Mitsubishi Estate,
manages the development of the project.
• MEC participates in the development of two
buildings (joint investment with Tokyo Century).
■Overview of Entire Project
(Participated in 2 bldgs.): (Tentative name) Fyrkanten11
(Stockholm, Office renovation) Trinity Tower* CapitaSpring
Location: Loudoun County, Virginia (Jakarta, FY2021) (Singapore, FY2022)
*Previous project name: Daswin Project
Total Area: 587,000㎡
Building Area: 140,000㎡ (total of 7 bldgs.)
Total cost: Approx. 198 bn yen
Start of construction: By end of *12021, *22022
Completion: *1May 2023, *2Feb. 2024
Morello (Tentative name)
(London, Rental apartment) Cristóbal de Moura 121-125
Savya Financial Center 180 George St.
(Barcelona, Office)
North Tower (Manila, FY2022) (Sydney, FY2023)
• Started the large renovation project of the • Participation in a condominium development
Warwick Court, an office building in London. project in Australia.
*3Completed image of property
Rooftop Terrace
Appearance (Current) One Sydney Harbour Residences One (Sydney, Condominium)
(Image after the renovation)
*1 Schedule for Building 1, which MEC has participated in *2 Schedule for Building 2, which MEC has participated in *3 The actual building could look different from the above.
MITSUBISHI ESTATE CO., LTD. 15Progress of the Long-Term Management Plan
4. Non-asset Business
Materialize Steady Growth in Existing Businesses New Areas (Utilize technologies/BtoC/BtoBtoC)
■Expand *AuM in the investment management business ■Efforts to support various workstyles
• Promote managerial efforts to reach a 5 trillion yen of asset
TELECUBE
value by mid-2020s.
(Private smart workspaces)
(As of FY2021: Approx. 3.7 trillion yen, increased by 0.1 trillion
yen vs the previous fiscal year). Expand installation spots
to apartment complexes,
• Started managing an open-end fund in Europe. convenience stores, offices,
(November 2020) and train stations
NINJA SPACE
*AuM = Assets Under Management
Helping workers find workspaces at
restaurants, conference rooms, hotels, etc.
■Acquire fee income business through the promotion of joint ventures
• Acquire fee income business and improve investment efficiency
by operating as a joint venture from the development stage. ■Proactive promotion of pilot programs of new technologies and
services
• Release several joint venture projects in FY2021. Self-standing/driving
delivery robot
Pilot program of electric
scooters on public roads (First
in Japan)
Fitting/shopping of
D2C brand products
Finding the most optimal
garbage collection route by
utilizing AI and quantum
computers
(Room for approx. 57% of CO2
Concept image of joint ventures reduction was confirmed)
MITSUBISHI ESTATE CO., LTD. 16Progress of the Long-Term Management Plan
5. Capital Policy #1: Cashflow for FY2021 (Results)
Operating cashflows and cash collections increase. Investment opportunities are on the rising trend. Decided to
buyback 30 billion yen of shares based on the capital policy of the Long-Term Management Plan while preparing
for investment expansions for the next fiscal year.
Cash in Cash out (Billions of yen)
(Original estimates) Result (Original estimates) Result
(740-790) 700 (740-790) 700
Strategic
Share buyback
allocation 30 Decided to buyback 30 billion yen of shares (cash outflow in FY2022)
(100-150) Growth
Financing arrangements investments
(Increase in liabilities) 60 ・Acquired more investment opportunites mainly in the offices, logistics
(190-240) 140 facilities, and rental apartments than previously expected.
・Although a number of investment opportunities were acquired, opportunities
must be expanded mainly in Asia in order to achieve the goals set in the
Long-Term Management Plan.
*1Returns Breakdown of FY2021 Investments (incl. growth investments):
*2Planned
Original Increase/
Actual
(370) 380 investments estimates Decrease
Marunouchi 50 60 ▲10
(600) 600
Outlet Mall, etc. 40 50 ▲10
Domestic condominium 170 170 0
Domestic capital recycling and others 280 200 +80
Overseas 120 120 0
Total 660 600 +60
*3Operating cashflows
Dividend payout ratio: Approx. 30%
(170) 180 Dividend per share: 31 yen (6 yen increase in comp. with estimates at the
Dividends beginning of the fiscal year; 1 yen increase in comp. with previous estimates)
(30) 40
*1 Collection amount of book values from sale proceeds of properties *2 Investment amount for approved investment projects (partly incl. expected approvals)
*3 Operating cashflows, excl. change in inventories and change in equity investments
MITSUBISHI ESTATE CO., LTD. 17Progress of the Long-Term Management Plan
6. Capital Policy #2: Cashflow of FY2022 (Estimates)
Increase cash inflow due to recovered profits and increased collections. Expand investment opportunities in order
to achieve goals set in the Long-Term Management Plan.
(Billions of yen)
Cash in Cash out
750~800 750~800
Continue plans of seeking strategic
Soundness level for new investments Strategic investment opportunities, mainly overseas in
(Considering possibility to expand investment Financing arrangements allocation Asia. Consider possibility to expand
opportunities) 100~150 investment opportunities.
(Increase in liabilities)
130~180 Share buyback Execute as a part of the capital policy of the
30 Long-Term Management Plan
Recently, investment opportunities were
steadily gained
【Breakdown】
Increase in returns as capital gains increase *1 Returns
Planned
*2 Marunouchi 60
(+20 compared to previous fiscal year) 400
investments Outlet Mall, etc. 30
580 Domestic condominium 160
Domestic capital recycling and others 190
Overseas 140
Increase in operating cashflows as business
*3 Operating
profits improve cashflows Payout ratio: Approx. 30%
Dividend per share: 33 yen (Recovered to the
(+40 compared to previous fiscal year) 220 Dividends level of FY2020)
40
*1 Collection amount of book values from sale proceeds of properties *2 Investment amount for approved investment projects (partly incl. expected approvals)
*3 Operating cashflows, excl. change in inventories and change in equity investments
MITSUBISHI ESTATE CO., LTD. 18Progress of the Long-Term Management Plan
7. Capital Policy #3: Shareholders Returns
Decided share buyback of 30 billion yen as a part of the capital policy in the Long-Term Management Plan.
As financial performance recovers, expected dividend payouts during FY2022 will rise to the level of FY2020.
(Yen)
40 45.0%
43.0%
35 33.00 33.00
31.00 41.0%
30.00
30
26.00 39.0%
25
37.0%
20.00
20 35.0%
16.00
14.00 33.0%
15
12.00 30.9% 30.6% 30.9%
30.0% 30.4%
31.0%
10
29.0%
26.6% 27.0%
5 26.5%
25.9% 27.0%
0 25.0%
FY2014 FY2015 FY2016 FY2017 FY2018 FY2019 FY2020 FY2021 FY2022
(E)
Amount of
Share ¥ 100 billion ¥ 30 billion
Buyback
Dividends per share Payout ratio (right axis)
MITSUBISHI ESTATE CO., LTD. 19Progress of the Long-Term Management Plan
8. Efforts to Improve Social Values
Accelerate the utilization of renewable energy for the development of a more sustainable
community. Improve external opinions through ESG efforts and increase information disclosure.
Switch to Renewable Energy External Reviews(Obtained in FY2021)
・19 buildings in Marunouchi and other areas to switch • Acquired high scores in various benchmarks
to renewable energy
Review by GRESB Real Estate
■Timing FY2022-
■Target properties Marunouchi Area: 18 buildings <5 stars (the highest rank, awarded for
Other areas: 1 building(Yokohama Landmark the first time)>
Tower)
Total: 19 buildings Ranked within top 20% globally
■CO2 reduction volume 180,000 tons/year
Review by CDP Climate Change 2020
<A list (the best evaluation, awarded
for the first time)>
270 companies were chosen among 5,800
companies reviewed
(53 of which are Japanese companies)
The first among domestic comprehensive real
estate developers to receive the award.
Marunouchi Area Yokohama Landmark Tower Review by CDP Supplier Engagement
・Expecting to achieve the *mid-term target renewable <Leader (the best evaluation, awarded
energy ratio ealier than originally set for the first time)>
・Going forward, all power used in Company-owned Top 7% were selected among 5,640 companies
buildings in Marunouchi area will be converted to globally. (Approx. 80 are Japanese companies)
renewable energy (expected FY2023)
*Mid-term target is to reach 25% by 2030. (The ultimate target is 100% by 2050.)
MITSUBISHI ESTATE CO., LTD. 20Progress of the Long-Term Management Plan
9. Initiatives Looking Ahead to Post-COVID-19
Enhancing value in the office by sophisticating the core functions of the central office and
adapting to diversified workstyles.
Sophistication of the Central Office
Previous workstyles TOKYO TORCH (Tokiwabashi PJ)
• 2ha outdoor space
Work at a predetermined • Communal space for workers
place and time. • Flexible office use by multiple
tenants
• Implementation of contactless
securities
• Large hall (2,000 seats)
• World-class hotel (100 rooms)
• Eco-friendly city development (e.g.
green bonds)
FINOLAB (renewal)
New workstyles • Financial support for startups
(investing in FINOLAB FUND)
• Renewal and expansion
Central office as the core hub of a • Support services for business
company in order to maintain a expansion
sense of belonging and trust
among employees with diversified Approaches to diversified workstyles
values.
WORK × ation Site Telecubes
(Workation) • Increase
installment
• Establishment of a numbers
new hub • Expand
(fourth hub) installation spots
to condominiums
etc.
NINJA SPACE
CIRCLES(Compact office)
・To locate • Completed in 3 buildings
workspaces • Currently planning to develop
at least 10 buildings
• Aim is to develop 30
buildings by 2024
MITSUBISHI ESTATE CO., LTD. 21Financial Supplemental Data MITSUBISHI ESTATE CO., LTD. 22
Financial Supplemental Data

1. Management Indicators

                                              Previous Management                                                             Current Management
                                                   Plan Period                                                                     Plan Period
                                                                                                                                        FY2022        2030
                                      FY2018                     FY2019                    FY2020                        FY2021
                                                                                                                                      (Estimate)     Target
 *1Business                                                                                                                                         ¥ 350-400
                                      ¥ 213.4 bn                ¥ 229.4 bn                 ¥ 240.9 bn                    ¥ 224.7 bn    ¥ 245.3 bn
 Profits                                                                                                                                                   bn

 *2ROA                                          3.8%                      4.0%                       4.1%                     3.8%          4.0%          5%

 ROE                                            7.3%                      7.8%                       8.5%                     7.6%          7.6%         10%

 EPS                                       ¥ 86.78                    ¥ 96.97                 ¥ 108.64                    ¥ 101.34       ¥ 106.70       ¥ 200

*1   Business Profit = Operating Income + Equity in Net Earnings/Loss (for unconsolidated subsidiaries and affiliates)
*2   ROA = Business Profit / Total Asset (average of opening / closing balances)

MITSUBISHI ESTATE CO., LTD.                                                                                                                                   23
Financial Supplemental Data
2. Balance Sheet
Millions of yen (rounded down) Millions of yen (rounded down)
At March 31, At March 31, At March 31, At March 31,
Change Change
2021 2020 2021 2020
Current assets 1,164,037 1,115,634 48,402 Liabilities 4,011,071 3,917,030 94,041
Cash 170,040 207,896 △ 37,856 Current liabilities 662,437 664,001 △ 1,564
Notes and accounts receivable-trade 52,031 50,340 1,691 Notes and accounts payable-trade 60,507 66,368 △ 5,861
Property for sale 88,116 72,256 15,859 Short-term borrowings 141,785 115,306 26,478
Property for sale in progress 267,563 247,677 19,886 Current portion of long-term debt 127,643 156,778 △ 29,135
Property for development 975 975 △0 Commercial Papers 50,000 50,000 -
Equity investments 496,182 450,520 45,661 Bonds due within one year 65,000 51,550 13,450
Other 89,126 85,966 3,161 Other 217,500 223,998 △ 6,496
Fixed assets 4,908,481 4,742,602 165,879 Long-term liabilities 3,348,634 3,253,028 95,605
Tangible assets 4,179,893 4,107,252 72,640 Bonds 745,759 775,584 △ 29,825
Intangible assets 101,095 96,767 4,328 Long-term debt 1,393,858 1,278,678 115,179
Investment securities 281,996 236,969 45,027 Other 1,209,011 1,198,762 10,249
Other 345,494 301,611 43,880 Net assets 2,061,447 1,941,206 120,241
Total assets 6,072,519 5,858,236 214,282 Shareholders’ equity 1,259,887 1,163,746 96,141
Other accumulated comprehensive income 592,011 570,716 21,294
Stock acquisition rights 231 288 △ 56
Non-controlling interests 209,316 206,454 2,861
Total liabilities and net assets 6,072,519 5,858,236 214,282
Total Assets Consolidated Interest-Bearing Debt Consolidated Interest-Bearing Debt Consolidated Interest-Bearing Debt
(as of Mar. 2021) (as of Mar. 2021) Fixed/Floating Rate Ratio Long-term/Short-term Ratio
Other Commercial Papers Lease obligations (as of Mar. 2021) (as of Mar. 2021)
302,019 50,000 2,095
International
Business Short-term
Floating 7.6%
929,869 16.8%
Bonds
810,759
Residential
Business
6,072,519 2,526,142 2,526,142 2,526,142
673,344
Commercial Loans
Property Business 1,663,288
4,167,287 Fixed
83.2% Long-term
92.4%
MITSUBISHI ESTATE CO., LTD. 24Financial Supplemental Data
3. Asset Compositions
(End of March 2021)
Inventories Equity Investments Tangible Fixed Assets
11% 5%
22% 9%
30% 3%
11%
3%
2%
1% 3%
¥ 355.6 billion ¥ 496.1 billion ¥ 4,179.8 billion
12%
77% 75%
36%
Domestic Condominiums Domestic (office buildings) Office Buildings Outlet Malls
US Domestic (others) Logistics Facilities *Retail Properties
US Rental Apartments Overseas
Others
Europe
Others
Asia
* Excluding outlet malls
MITSUBISHI ESTATE CO., LTD. 25Financial Supplemental Data
4. Consolidated Cash Flow
Millions of yen (rounded down)
①FY2020 ②FY2021 Change ③FY2022 Change
Results Results (②-①) Estimates (③-②)
Cash Flows From
Operating Activities 341,766 207,414 △ 134,352 187,000 △ 20,414
Depreciation and amortization 84,941 89,107 4,165 90,000 893
Change in Inventories 148,161 56,443 △ 91,718 96,000 39,557
Change in Equity Investment △ 43,217 △ 21,048 22,169 △ 131,000 △ 109,952
Cash Flows From
Investing Activities △ 277,440 △ 297,303 △ 19,863 △ 352,000 △ 54,697
Proceeds from sales of
investment securities 5,275 14,186 8,911 17,000 2,814
Capital Investment △ 331,857 △ 319,841 12,016 △ 394,000 △ 74,159
Cash Flow From
Financing Activities △ 28,886 50,425 79,312 145,000 94,575
Cash and Cash Equivalents
at End of Year 213,008 172,307 △ 40,701 152,000 △ 20,307
Free Cash Flow 64,326 △ 89,889 △ 154,215 △ 165,000 △ 75,111
MITSUBISHI ESTATE CO., LTD. 26Financial Supplemental Data
5. Investment Data
Major Breakdown of Capital Investments Major Breakdown of Equity Investments
(Billions of yen) (Billions of yen)
394.0
400.0 400.0
32.0
350.0 331.8 13.0 350.0
319.8 1.0
10.7
289.5 285.0 12.3 4.3 8.1
300.0 6.5 25.2 99.0 300.0
11.8 7.1
13.0 9.0 47.4
250.0 113.8 250.0
93.4 74.7
200.0 70.6 82.0 200.0 176.0
22.1 38.4 39.9
150.0 150.0 56.0
36.0 6.5 76.9
36.9 47.8 93.0 99.4 3.0
2.3 93.7
100.0 15.9 16.8 100.0 2.1
15.6
21.3 23.9 19.2 78.0
14.0 75.1 49.0
50.0 96.3 50.0
68.4 63.5 72.4 60.0
8.8 42.6 37.0 2.0
0.0 0.0 13.2
FY2018 FY2019 FY2020 FY2021* FY2022 FY2018 FY2019 FY2020 FY2021* FY2022(E)
*Classifications have been changed below from FY2021
Office Building(MEC: New/Redevelopment) Office Building(MEC: Refurbishment) Office(MEC: New / Redevelopment) Office(MEC: Refurbishment)
Office Building(Subsidiaries) Lifestyle Property Commercial Property(excluding MEC office) Residential
Residential International
International Special Purpose Vehicle
Hotel & Airport Special Purpose Vehicle
Others(including consolidated eliminations) New Investments
Other(including consolidated eliminations) New Investments
MITSUBISHI ESTATE CO., LTD. 27Financial Supplemental Data
6. Income Generating Assets Unrealized Gains: Current Status #1
Steady caprate and a slight increase in unrealized gains. Decrease in average number of shares and increase in
BPS and revised BPS due to an increase in net worth.
Income Generating Assets Unrealized Gain *BPS and Adjusted BPS
(Billions of yen) Book value Unrealized gain (Yen) BPS Adjusted BPS
9,000 3,800 3,606
8,270.8 8,361.2
7,941.1 3,432
8,000 3,241
7,383.4
3,300
7,000 6,791.9
2,950
6,079.0
4,222.5 4,250.2 2,643
6,000 5,498.9 3,898.4 2,800
3,422.8
2,963.5 2,384
5,000
2,569.0 2,178
2,180.7 2,300
4,000
3,000 1,800
1,383
2,000 3,828.4 3,960.5 4,042.7 4,048.3 4,110.9 1,276 1,269
3,318.1 3,509.9 1,224
1,300 1,148
1,078 1,088
1,000
0 800
FY2015 FY2016 FY2017 FY2018 FY2019 FY2020 FY2021 FY2015 FY2016 FY2017 FY2018 FY2019 FY2020 FY2021
* BPS including unrealized gains (after tax)
MITSUBISHI ESTATE CO., LTD. 28Financial Supplemental Data
7. Income Generating Assets Unrealized Gains: Current Status #2
Unrealized Gain Breakdown Rental Profits
(Billions of yen)
190
International 180.5 180.2
10% 180 174.8
168.3
170
160.7
160
Domestic
(Outside of Marunouchi) *Marunouchi 150
17% New Building
44% 140 136.2
131.7
130
Marunouchi
Existing Building 120
29%
110
100
FY2015 FY2016 FY2017 FY2018 FY2019 FY2020 FY2021
*Redeveloped properties after the completion of Marunouchi Building
FY2021 Results
MITSUBISHI ESTATE CO., LTD. 29Overview of the "Long-Term Management Plan 2030" MITSUBISHI ESTATE CO., LTD. 30
Overview of the "Long-Term Management Plan 2030"

1. New Management Plan: Objectives                                        *Repost from the "Long-Term Management Plan 2030"

                                         Mitsubishi Estate Group’s Mission:
                        Creation of a truly meaningful society through urban development

              2030 Target                                                                         2030 Target
                                                   A pair of driving wheels
 Address Four key themes*
 to realize a sustainable                                                                   ROA        ROE          EPS
 society
                                                                                             5%       10%       ¥   200
 *「Environment」「Diversity

  「Innovation」「Resilience」
                              & Inclusion」   Increasing           Increasing
                                               Social            Shareholder
    Fundamental Approach                       Value                Value                  Fundamental Approach

 Create value for every                                                                   Transformational
                                                                                          improvements to the
 stakeholder including visitors
                                                                                          business portfolio's efficiency
 and employees                                            Synergy                         and market resilience

                                      Realize our mission and sustainable growth
                                 by increasing both social value and shareholder value

MITSUBISHI ESTATE CO., LTD.                                                                                               31
Overview of the "Long-Term Management Plan 2030"
2. Quantitative Target - 2030 Target *Repost from the "Long-Term Management Plan 2030"
2030 Target
ROA*1 ROE EPS
5% 10% ¥200
*1 ROA = Business Profits*2 / Total Asset (average of opening/closing balances)
Key Assumptions
Profit Growth Shareholders Returns Financial Stability
Current framework* Maintain
• Payout ratio:
current level of
Business Profit*2 Approx. 30%
+ credit ratings
¥350–400 bn • Share buybacks 【Reference】
R&I :AA-
(when determined to be an S&P :A+
optimal use of funds) Moody‘s :A2
** Will adjust to business conditions
*2 Business Profit= Operating Income + Equity in earnings (loss) unconsolidated subsidiaries and affiliates
MITSUBISHI ESTATE CO., LTD. 32Overview of the "Long-Term Management Plan 2030"
*Repost from the "Long-Term
3. 2030 Targets: Realization Plan (ROA・ROE・EPS) Management Plan 2030"
Current (FY20) 2030 Target
Increase of ¥120–170 bn
Business Profits
Approx. ¥50bn growth from each of: domestic
asset, international asset, non-asset business
¥350-400 bn
¥230.5 bn (EPS: ¥200)
(EPS: ¥100.2)
【 Flexible capital policy 】
Optimize investments, assets sales, shareholder
Total Assets
return and financing according to market
¥5.9 tn conditions
Approx. ¥7-8 tn
Expected net increase: ¥1-2 tn
Business Profits Increase Net investment: Approx. ¥2–3 tn
Total Assets
= ROA: 3.9% ROA: 5%
Decrease Depreciation: Approx. ¥1 tn
With current leverage
ROE: 7.8% ROE: 10%
MITSUBISHI ESTATE CO., LTD. 33Overview of the "Long-Term Management Plan 2030"
*Repost from the "Long-Term
4. Capital Policy - Responsive to Market Conditions Management Plan 2030"
Flexible capital policy - Responsive to market conditions
(Value creation through BS management)
Optimize mix of investment, asset sales, shareholders returns,
and financing in response to the market
Sellers' market
Asset Sales :
Profits :
Shareholder return:
Buyers' market
Active acquisition
:
/investment
To maximize mid-to-long value, we combine:
1. stable CF from long-term development PJs and asset holdings Capital gain :
2. capital recycling business in response to the market.
Shareholders return:
MITSUBISHI ESTATE CO., LTD. 34Overview of the "Long-Term Management Plan 2030"
5. Value creation through BS management *Repost from the "Long-Term Management Plan 2030"
Flexible Capital Policy - Responsive to market conditions
(Value creation through BS management)
Asset Shareholders’ Equity and Liability
Capital recycling business optimized for market
conditions
Maintaining Financial Stability
In seller's market: expedite asset sales Financial reserves for seizing buyer's market opportunities
Invest in promising PJs to enhance corporate value High credit rating enables long-term and low-cost financing
Long-term development and asset holdings In sellers' market, use asset sale proceeds for shareholder
(core focus: Marunouchi redevelopment) returns and to maintain financial stability
Steady capital investment in core business enables stable,
cycle-proof rental cashflow
Timely asset sales judged by expected yields and external
environment Capital Efficiency Improvement
Sale of underperforming properties and Targets: ROA 5%, ROE 10%, EPS ¥200
strategic-holding stocks Increase numerator (net income) and decrease denominator
Disposal of underperforming assets, including core asset (shareholders’ equity)
Ongoing disposal of strategic-holding stocks Choose measures to manage shareholders’ equity according
to market conditions
Expansion of Non-asset Business
MITSUBISHI ESTATE CO., LTD. 35Overview of the "Long-Term Management Plan 2030"
6. Capital Allocation Policy *Repost from the "Long-Term Management Plan 2030"
Cash in Cash out
Strategic allocation to improve medium- to long-
Strategic term capital efficiency
Financial
Allocation Allocate capitals based on market conditions
capacity Select projects which help to increase shareholder value
investments/
shareholder Capital recycling business expected returns (pre-tax IRR)
return/
suppression of Domestic : 6-8%
debt International (developed countries) : 8-10%
International (developing countries) : 10+%
*Expected return from total investment in each business
Cash flow Planned
from investment &
return Planned projects – return through asset sales (book value)
operating
activities * Including undetermined projects. See p. 40 for the next three-year forecast
Base Payout ratio: Approx. 30%
shareholders * Shareholder return method and scale will be adjusted
return with real estate and financial market conditions, stock price, and ROE/EPS
MITSUBISHI ESTATE CO., LTD. 36Overview of the "Long-Term Management Plan 2030"
7. Profit Growth Strategy - 2030 Vision *Repost from the "Long-Term Management Plan 2030"
Profit changes vs FY2020* Growth Strategy
① Advance “Marunouchi NEXT Stage” project
① Domestic Asset
② Increase NOI with development projects
Business
Approx. +¥50 bn ③ Optimize capital recycling business to market conditions
(FY20E*: Approx. ¥ 201.0 bn)
④ Optimize residential business profit structure
② International Asset ① Expand development business in Asia
Business ② Enhance development business and revenue base in Europe
Approx. +¥50 bn
(FY20E*: Approx. ¥ 36 bn) ③ Enhance and diversify US capital recycling business
① Steady profit growth in existing businesses
③ Non-asset Business
Approx. +¥50 bn ② Utilization of technology
(FY20E*: Approx. ¥ 16 bn)
③ Provision of service contents focusing on B2C/B2B2C
④ Fluctuation Factors ・Asset sales control in response to market conditions
Approx. ±¥20–30 bn ・Capital gain and rental profit fluctuation due to investment opportunities
* Composition of FY20 Business Profits = ① Domestic Asset + ② International Asset + ③ Non-asset Business + Eliminations or corporate
(round number) (¥ 201.0 bn) (¥ 36 bn) (¥ 16 bn) (▲ ¥ 23 bn)
MITSUBISHI ESTATE CO., LTD. 37Overview of the "Long-Term Management Plan 2030"
8. Roadmap for Profit Growth *Repost from the "Long-Term Management Plan 2030"
Early stage Middle stage Late stage
Advance
redevelopment projects Redevelopment Projects’ Contribution
Domestic • Complete Tokiwabashi A Bldg. • Long-term developments, e.g. Tokiwabashi B Bldg.
Asset • Open & expand outlet mall • Residential redevelopments
• Asset sales and reconstruction of existing buildings (will
Business lower rental profits)
• Temporary decline in the condominium units sold
Profits scale with asset accumulation Stabilize profits via capital recycling
International • 1271 Ave. of the Americas renewal, 8 Bishopsgate
completion
• Shift from asset expansion to recycling
• Stabilize capital recycling business in Asia
Asset • Stabilize Asia condominium business
• Expand assets in Asia capital recycling business
Business
Promoting commercialization in new domains Accelerate profits in new domains
Non-asset • Stable growth in existing businesses • Stable growth in existing businesses
• Promoting commercialization in new domains • Accelerate profits in new domains
Business
MITSUBISHI ESTATE CO., LTD. 38Overview of the "Long-Term Management Plan 2030"
*Repost from the "Long-Term
9. Three Year Investment Return Plan (FY2021-FY2023) Management Plan 2030"
(Billions of yen)
3-Year Total Composition
Strategic Strategic
Planned Investments and Return Allocation
Return
Dispose Vary investment allocation
underperforming assets for medium- to long-term
Domestic Asset International Asset for capital efficiency capital efficiency
Strategic Allocation
600 600
(investments/shareholders return Europe and
Outlet mall, US
/suppression of debt)
Capital Recycling asset, Asia 200
And Others
100
Invest Aim for international profit
ment
Planned 550 growth
investments Condominium
1,500
Marunouchi 500
area
150
0
500
Return
Return 1,100 300
Asset sales plan assumes 100
market conditions of previous 200 100~200
three years
Strategic Return
100~200 Net
Invest 150 0 250 0 0 -100~-200 ~600
ment
MITSUBISHI ESTATE CO., LTD. 39Business Overview MITSUBISHI ESTATE CO., LTD. 40
Business Overview

1. Mitsubishi Estate Group’s Business Segments

                                                       Commercial Property Business
           <Office Buildings>                 <Retail Properties>                   <Logistics Facilities>               <Hotels/Airports>
  Engages in the development,         Develops retail properties and       Development, leasing, and             Undertakes hotel management
  leasing, and operation              outlet malls nationwide, mainly in   management of the “Logicross”         nationwide as the Royal Park Hotels
  management of office buildings,     the major metropolitan areas.        series as a foundation of logistics   group. Began private airport
  mainly in the Marunouchi area and                                        facilities.                           management business.
  other major Japanese cities.

                                                                           Investment Management                    Architectural Design &
      Residential Business             International Business                     Business                        Engineering and Real Estate
                                                                                                                       Service Business
       <Domestic Residential>         Undertakes office building           Provides a wide range of services           <Architectural Design &
  Operate residential condominium     development and                      regarding real estate investment            Engineering Business>
  business under "The                 leasing businesses in the United     for investors.                        Mitsubishi Jisho Sekkei Inc.
  Parkhouse" brand and rental         States and the United Kingdom, as                                          provides architectural design and
  apartments business under "The      well as projects in Asia                                                   engineering services of construction
  Parkhabio" brand.                                                                                              and civil engineering.

                                                                                                                  <Real Estate Services Business>
                                                                                                                 Mitsubishi Real Estate Services Co.,
                                                                                                                 Ltd. offers real estate brokerage,
                                                                                                                 parking lot management support,
                                                                                                                 and other services.

MITSUBISHI ESTATE CO., LTD.                                                                                                                         41
Business Overview
2. Business Scale
Investment *Other
Other* Other* Investment
Management 2%
Investment 6% 0% Management
Business
Management Business
2%
Business 1%
2%
International
International
International Business
Business
Business 15%
16%
9% Revenue from
Operations Operating Income Total Assets
Residential
Approx. Business Approx. Residential Approx.
10% Business
¥1,207.5 ¥224.3 11% ¥6,072.5
Residential billion Commercial billion billion
Business Property Commercial Commercial
29% Business Property Property
54% Business Business
73% 70%
*Architectural Design & Engineering Business and Real Estate Services Business, Other Business
(FY2021 Results)
MITSUBISHI ESTATE CO., LTD. 42Commercial Property Business Office Buildings MITSUBISHI ESTATE CO., LTD. 43
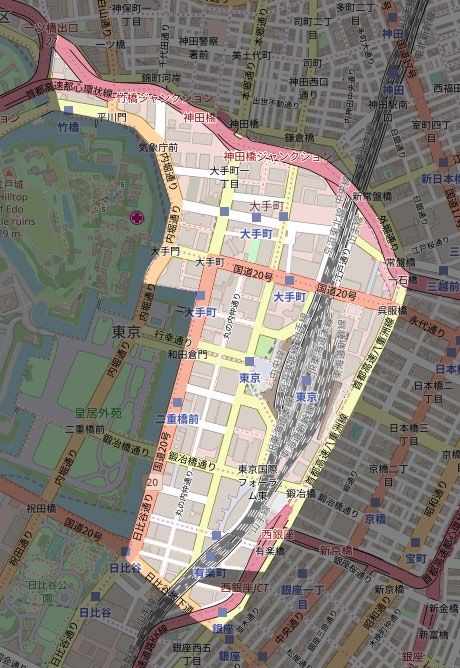
Commercial Property Business (Office Buildings)

1. Marunouchi Area Map

MITSUBISHI ESTATE CO., LTD.                       44
Commercial Property Business (Office Buildings)

2. Pipeline

                                  Mizuho Marunouchi Tower,         Tokiwabashi Tower
                                                                                                      (Tentative name)                                                   Yurakucho
                                        Ginko Kaikan,                                              Uchikanda 1-chome                  Torch Tower Bldg. B              Redevelopment
                                     Marunouchi Terrace                 Bldg. A                          Project                                                             (TBD)
  Marunouchi Area

                                  Total Floor Area: 180,900㎡      Total Floor Area: 146,000㎡       Total Floor Area: 84,500㎡      Total Floor Area: 544,000㎡
                                  Completion: Sep. 2020           Completion: Jun. 2021            Completion: 2025               Completion: FY2028

                                  FY2020                        FY2021                   FY2022                       FY2023                       FY2024                       FY2028

                                                                                                                                                  (Tentative name)
                                   Link Square Shinjuku               CO・MO・RE YOTSUYA                    the ARGYLE aoyama                   Toyosu 4-2 Project
        (Outside of Marunouchi)
Tokyo

                                                                                 撮影:SS

                                    Total Floor Area: 43,800㎡         Total Floor Area: 139,600㎡          Total Floor Area: 23,100㎡         Total Floor Area: Undetermined
                                    Completion: Aug. 2019             Completion: Jan. 2020               Completion: Jun. 2020             Completion: Spring 2025

MITSUBISHI ESTATE CO., LTD.                                                                                                                                                              45
Commercial Property Business (Office Buildings)
3. Earnings Related Data: Total Operating Floor Space (Unconsolidated)
Total (Domestic)/Marunouchi/Marunouchi Redevelopment Buildings
(Thousand ㎡)
6,500
5,991 6,009
5,869
6,000 5,745
5,580 5,670 5,570
5,444 5,385
5,500 5,174
5,038
4,896
5,000 4,660
4,347
4,500 4,175
4,000 3,825 3,907 3,769
3,684 3,696
3,500
2,915 2,915 2,952
3,000 2,687 2,758 2,755 2,583 2,727 2,784
2,565 2,565 2,531
2,500 2,195 2,258
1,946 2,024 1,897 1,836 1,836 1,872
2,000 1,798 1,705 1,705
1,677
1,383 1,365 1,360 1,345
1,500 1,174
1,022 1,022
1,000 743 743
489 489
256 256 355
500
0
03/3 04/3 05/3 06/3 07/3 08/3 09/3 10/3 11/3 12/3 13/3 14/3 15/3 16/3 17/3 18/3 19/3 20/3 21/3 22/3(E)
Total (Domestic) Marunouchi Marunouchi Redeveloped Buildings
*Excluding floor space in Lifestyle Property Business from 16/3
MITSUBISHI ESTATE CO., LTD. 46Commercial Property Business (Office Buildings)
4. Earnings Related Data: Vacancy Rates and Average Rents (Unconsolidated)
Vacancy Rates (Marunouchi Offices/All uses in Japan) and
Average Rents (All uses in Japan)
(yen / tsubo-month)
30,000 10%
29,000 Vacancy rate (Marunouchi offices) 28,500
27,793 9%
28,000 Vacancy rate (All uses in Japan)
27,177
Average rent (All uses in Japan) 26,702
27,000 26,193
25,842 8%
26,000 25,234
24,864
25,000 24,423
23,974 23,861 7%
22,817 23,560 23,850 23,587
24,000
6.06%
22,602
23,000 22,213 21,733 6%
21,902
22,000 21,711 5.29%
4.82%
5.64%
21,000 5%
20,000 3.98%
4.36%
3.59% 3.58% 3.58% 4%
19,000 3.40%
2.77% 4.32%
18,000 2.80% 3.0%
2.86% 3.66% 2.93%
2.50% 3%
17,000 2.42% 2.26% 2.22% 2.19%
1.68% 1.87%
16,000
2.77% 2.42% 2%
2.42% 1.07% 2.35%
15,000 2.06%
1.74% 1.82% 1.65% 1.80%
14,000 1.09% 1.37% 1%
0.19%
13,000 0.55%
0.69%
12,000 0%
03/3 04/3 05/3 06/3 07/3 08/3 09/3 10/3 11/3 12/3 13/3 14/3 15/3 16/3 17/3 18/3 19/3 20/3 21/3 22/3
(E)
MITSUBISHI ESTATE CO., LTD. 47Commercial Property Business (Office Buildings)
5. Earnings Related Data: Office Building Business, Revenue Breakdown*1
(Unconsolidated)
(Billions of yen)
FY2020 FY2021 FY2021 FY2022
(Results) (Previous Estimates) (Results) (Estimates)
Rent revenue from *1office buildings 406.6 418.6 418.0 428.3
Changes from the previous period + 17.9 + 11.9 + 11.3 + 10.2
Rent revenue from new buildings + 10.8 + 11.9 + 12.2 + 15.8
Rent revenue from existing buildings + 6.8 + 6.1 + 7.2 △ 3.3
Termination of master lease,
+ 0.3 △ 1.3 △ 0.7 △ 6.5
closure of building for redevelopment
Moving in/out of tenants,
+ 6.5 + 7.5 + 8.0 + 3.2
Rent revisions at lease renewal
Impact of COVID-19 Offices △ 0.5 △ 0.5
*2Mixed-use
△ 5.0 △ 5.0
retail
Supplementary revenue, incl. common area
charge
+0 △ 0.6 △ 2.4 △ 2.2
*1 Office buildings, incl. those with retail areas, etc.
*2 Retail properties in office buildings
MITSUBISHI ESTATE CO., LTD. 48Commercial Property Business (Office Buildings)
6. Earnings Related Data: Trends in Rent Revenue From Office Buildings*1
(Unconsolidated)
Increase/Decrease of Rent Revenue from Office Buildings*1
(Billions of yen) (From the Previous Fiscal Year)
30
■New buildings
■Existing buildings (moving in/out of tenants, rent revisions at lease renewal)
25 ■Existing buildings (termination of master lease, closure of building for redevelopment)
+0.3
■Impact of COVID-19 (office buildings, *2mixed-use retails)
20 +0.3
15 +14.7 +22.6 +0.7 +17.9
+15.3 +27.2 +12.2
+23.9 +18.5 +13.2 +10.8 +15.8
10 +9.8
+15.3
+13.0 +12.5
5 +7.3 +9.5
+8.7 +7.3 +8.0
+6.0 +6.6 +4.9 +5.9 +6.5
+4.3 +4.0 +4.7 +3.2
+1.9 +2.4
0 -1.1 -1.5 -1.5 -0.7 -0.7
-3.9 -4.9 -4.0 -4.6 -3.4
-5.2 -5.5 -6.5
-5 -5.9 -7.5 -9.0 -8.1
-2.5 -10.7 -10.5 -2.5 -10.5
-5.4 -5.6 -6.0 -8.3
-10
-5.0
-15
*1 Office buildings, incl. those with retail areas, etc.
*2 Retail properties in office buildings
-20
03/3 04/3 05/3 06/3 07/3 08/3 09/3 10/3 11/3 12/3 13/3 14/3 15/3 16/3 17/3 18/3 19/3 20/3 21/3 22/3(E)
Total -2.1 -2.7 -1.6 +8.3 -1.3 +19.8 +20.5 +17.4 +2.3 -1.7 -5.1 +19.0 +11.9 +7.6 +18.5 +15.2 +24.1 +17.6 +14.0 +12.5
MITSUBISHI ESTATE CO., LTD. 49Commercial Property Business (Office Buildings)
7. Office Building Market Data: New Supply of Large-Scale Office Buildings
(23 Wards of Tokyo)
(Millions of ㎡)
2.5
2.16
2 1.87
1.75
1.54
1.5 Past average supply 1.41 1.43
approx. 1.04 million ㎡/year
1.25 1.21 (1998-2019)
1.19 1.17 Average estimate supply
1.09 for the next 5 years
1.03 million ㎡/year
0.99 0.97
1 0.91 0.87
0.86 0.85 0.85
0.77 0.77
0.72 0.69
0.65
0.58 0.54 0.54
0.5 0.36
0
*Estimate
*Research subject buildings: Buildings with a total office floor area exceeding 10,000㎡
Source: Mori Building (as of May 2020)
MITSUBISHI ESTATE CO., LTD. 50Commercial Property Business (Office Buildings)
8. Office Building Market Data: Average Rents/Vacancy Rates
(5 Central Wards of Tokyo)
(yen / tsubo-month)
30,000 12%
Average Rent Vacancy Rate
28,000
10%
26,000 9.19% 9.04%
8.75% 8.56%
24,000 7.98%
22,574 22,594 8%
8.18%
22,000 21,295 6.70% 21,134 21,541
20,064
5.51% 19,699
20,000 19,175 6.05% 5.30% 5.42% 6%
18,730
18,095 18,264 17,973
17,75817,593 17,495
18,000 17,195
16,71616,504
16,325 3.60%
4%
16,000 4.34%
3.41%
14,000
2.72% 2.89% 2.80% 2%
12,000 1.78%
1.50%
10,000 0%
03/3 04/3 05/3 06/3 07/3 08/3 09/3 10/3 11/3 12/3 13/3 14/3 15/3 16/3 17/3 18/3 19/3 20/3 21/3
Source: Miki Shoji Co., Ltd.
MITSUBISHI ESTATE CO., LTD. 51Commercial Property Business (Office Buildings)
9. Competitive Edge of Marunouchi: Vacancy Rates
5 Central Wards of Tokyo (Market) vs. Marunouchi
(Unconsolidated)
10%
9.19% 9.04%
8.75%
9% 8.56%
8.18%
7.98%
8%
6.70%
7%
6.06%
6% 6.05%
5.42%
5.51%
5.30%
5% 4.32%
4.36% 3.66%
4% 3.60%
4.34%
3.41% 2.72% 2.80%
3% 2.42% 2.42% 2.50%
2.77% 2.19%
2.89%
2% 1.50%
2.26% 2.42%
1.82%
1%
1.74% 1.65% 1.78%
0.19% 1.37%
0.55% 1.09%
0.69%
0%
03/3 04/3 05/3 06/3 07/3 08/3 09/3 10/3 11/3 12/3 13/3 14/3 15/3 16/3 17/3 18/3 19/3 20/3 21/3
5 Central Wards of Tokyo (Market) Marunouchi (Unconsolidated)
Source: Miki Shoji Co., Ltd.
MITSUBISHI ESTATE CO., LTD. 52Commercial Property Business (Office Buildings)
10. Competitive Edge of Marunouchi: Area/Number of Railway Lines
Marunouchi Nihonbashi Shinagawa Shibuya Toranomon
2,400m
1,500m
Area: 120ha Area: 76ha Area: 49ha Area: 86ha Area: 58ha
Railway lines: 28 lines Railway lines: 5 lines Railway lines: 9 lines Railway lines: 8 lines Railway lines: 2 lines
©Open Street Map
MITSUBISHI ESTATE CO., LTD. 53Commercial Property Business (Office Buildings)
11. Competitive Edge of Marunouchi: Number of Headquarters and Offices
(as of March 2020)
① Fortune Global 500 company headquarters ③ Top 100 law firm headquarters and offices
MARUNOUCHI
32
18 3 1 0 0 TORANOMON
5
NIHONBASHI
1
MARUNOUCHI SHINAGAWA NIHONBASHI SHIBUYA TORANOMON
SHIBUYA 1
SHINAGAWA
0
② Top 50 company headquarters in terms of
④ Foreign financial company offices
market capitalization
MARUNOUCHI
71
14 TORANOMON
17
3 2 1 12
0
NIHONBASHI
MARUNOUCHI NIHONBASHI SHINAGAWA TORANOMON SHIBUYA
SHIBUYA
4
SHINAGAWA
0
MITSUBISHI ESTATE CO., LTD. 54Commercial Property Business (Office Buildings)
12. Marunouchi Data: Marunouchi Tenant Mix (Unconsolidated)
March 2000 Type of Business Area ratio March 2021 Type of Business Area ratio
1 Manufacturing 42.5% 1 Finance 22.9%
2 Finance 22.2% 2 Manufacturing 20.0%
3 Trading 10.4% 3 Professional Firm 19.2%
4 Information 6.3% 4 Trading 10.4%
5 Professional Firm 4.4% 5 Information 6.2%
Others 14.2% Others 21.3%
Professional Firm Others
4.4% Others 21.3% Finance
14.2% 22.9%
Information Manufacturing
6.3% 42.5% Information
6.2%
Trading
10.4% Trading Manufacturing
10.4% 20.0%
Finance
22.2% Professional Firm
19.2%
MITSUBISHI ESTATE CO., LTD. 55Commercial Property Business (Office Buildings)
13. Marunouchi Data: Approaches for Marunouchi Area Development
Relaxation of plot ratio regulations: Special
Improvement of floor-area-ratio
Urban Renaissance Districts
Improving plot ratio in Marunouchi area by reviewing the use Possible to be permitted for relaxation of floor-area ratio
area regulation depending on levels of contribution to city
1,000% → 1,300% (June 2004)
regeneration as an exemption of urban planning
Example: International business bases (Global Business Hub Tokyo etc.)
*1,200% for limited areas
Development of fine urban environment (improvement of water quality of ditch
around the Imperial Palace, etc.)
BCP functions (self-reliant electric power, water supply, etc.)
Transfer of plot ratio: Change of building uses:
Exceptional plot ratio district system Consolidation of non-office use
Possible to transfer floor area among several areas meeting a Possible to consolidate and allocate mandated non-office
certain conditions use floor-areas when running several projects
simultaneously
"Exceptional floor-area
◆Example: Consolidate office and hotel usages
ratio district" area
Non-office ─
Office ─
◆Example: Transfer unused floor-area at Tokyo station to other buildings
around the station
Consolidate non-office use in
offices into hotels to expand
office areas in office buildings
Offices Hotels
MITSUBISHI ESTATE CO., LTD. 56You can also read